

Abstract
Objectives
Matrix-based risk models have been proposed as a tool to predict rapid radiographic progression (RRP) in rheumatoid arthritis (RA), but the experience with such models is limited. We tested the performance of three risk models for RRP in an observational cohort
Methods
Subjects from an observational RA cohort with hand radiographs and necessary predictor variables to be classified by the risk models were identified (n=478). RRP was defined as a yearly change in van der Heijde-Sharp score of ≥ 5 units. Patients were placed in the appropriate matrix categories, with a corresponding predicted risk of RRP. The mean predicted probability for cases and non-cases, integrated discrimination improvement, Hosmer-Lemeshow statistics and the c-statistics were calculated.
Results
The median (IQR) age was 59 (50, 66) years, disease duration 12 (4, 23) years and swollen joint count 6 (2, 13), 84% were female and 86% had erosions at baseline. Twelve percent (32/271) of patients treated with synthetic DMARDs at baseline and 10% (21/207) of patients treated with biologic DMARDs experienced RRP. Most of the predictor variables had a skewed distribution in the population. All models had a suboptimal performance when applied to the BRASS cohort, with c-statistics of 0.59 (model A), 0.65 (model B) and 0.57 (model C) and Hosmer-Lemeshow chi-square p-values of 0.06 (model A), 0.005 (model B) and 0.05 (model C).
Conclusion
Matrix risk models developed in clinical trials of patients with early RA had limited ability to predict RRP in this observational cohort of RA patients.
Rheumatoid arthritis (RA) is a chronic disease that can cause severe joint damage and disability. During the last decades, the number of therapeutic agents and the knowledge about treatment strategies for RA have increased substantially (1). This has left clinicians with more treatment choices, but also in need of tools to identify the right patients to treat aggressively with more effective, but expensive medication with potentially serious adverse events.
Risk model matrices have been proposed as clinical tools to identify RA patients at high risk of rapid radiographic progression (RRP) (2–5) or with probable response to disease modifying anti-rheumatic drug (DMARD) treatment (6). In addition, models to predict response to anti-TNF therapy in ankylosing spondylitis (AS) have been published recently (7), highlighting the interest in risk models within rheumatology. Clinicians might apply current risk models in their daily practice, but we have limited knowledge about whether the use of the models should be restricted to patient populations similar to the study populations used for the model development.
Risk models are common in cardiology, with the Framingham Risk Scores (8) and the Systematic Coronary Risk Evaluation (SCORE) (9) as examples of risk models for cardiovascular disease. Several publications have discussed the validation and development of such models, focusing on statistical methods to assess model fit and compare the classification abilities of different models(10–14). Statistics have been developed to measure the degree of correct reclassification by a new model compared to a previous model, such as reclassification calibration statistics, net reclassification improvement and integrated discrimination improvement (Table 1). These methods add information to traditional discriminatory abilities, for example the c-statistics.
Table 1.
| Overall model fit | Calibration (14) | Discrimination (14) | Reclassification |
|---|---|---|---|
|
| |||
|
Bayes information criterion (12) The log likelihood with a penalty for the number of variables included in the model. Nagelkerke R2 (12) The fraction of the log likelihood explained by the predictors in the model, adjusted to a range of 0 to 1. Analogous to the percentage of variation explained in linear regression models (R2). |
Hosmer-Lemeshow chi-square statistics (12;14) Tests the goodness-of-fit of the model by comparing the observed and predicted number of cases within each decile (or another number of categories) of predicted risk in the model. If the p-value is significant, the model does not fit the observed data. |
C-statistics (12;18) The area under the receiver operating charcteristics (ROC) curve. Rank based. Integrated discrimination improvement (12;18) The difference in the mean differences in predicted probabilities between cases and non-cases. |
Reclassification calibration statistics (12) Compares the observed and expected number of events in each cell of a reclassification table. Is based on Hosmer-Lemeshow statistics, requires 20 observations in each cell and a significant test indicates a lack of fit. Net reclassification improvement (10;12;18) Compares the net increase and decrease in risk among cases to that of non-cases |
Risk models developed in clinical trials may not be directly applicable to daily clinical settings, as selected patient groups are included in trials, often with aggressive disease of short duration. In this paper, we assess the performance of three models for prediction of RRP in RA in an observational cohort representing a broad RA population. All three models were developed in clinical trials populations. We apply statistical methods previously used to assess risk models in other specialties.
Material and methods
Design and study cohort
The Brigham Rheumatoid Arthritis Sequential Study (BRASS) is a single-centre observational cohort consisting of 1100 RA patients (15). All patients in BRASS are diagnosed with RA by board-certified rheumatologists and 96% fulfill the 1987 ACR classification criteria for RA at inclusion (16). 478 BRASS patients had radiographic data available and received treatment with DMARDs, and were thus eligible for the analyses. Baseline examinations took place between 2003 and 2006 and included patient reported outcome measures, biochemical markers, and clinical examinations with swollen and tender joint counts. Treatment was given according to the clinical practice of the patient’s physician, and visits with treatment adjustment could be scheduled when needed. The Brigham and Women’s Hospital Institutional Review Board approved the study and all patients gave written informed consent for participation in the data collection.
Risk models for rapid radiographic progression
We assessed three matrix-based risk models predicting RRP, all developed with multivariate logistic regression modeling. “Model A” was developed in data from the Active-Controlled Study of Patients Receiving Infliximab for the Treatment of Rheumatoid Arthritis of Early Onset (ASPIRE) study (3). Methotrexate naive patients were randomized to either methotrexate monotherapy or a combination of methotrexate and infliximab. “Model B” is based on data from the BeSt-trial, a study of treatment strategies in RA patients with disease duration less than or equal to two years (2). “Model C” was developed using data from the SWEFOT trial studying the efficacy and safety of either a combination of hydroxychloroquine, sulfasalazine and methotrexate or infliximab and methotrexate in patients failing initial methotrexate monotherapy (4). We chose to use the model from the second year of the SWEFOT trial based on the assumption that the second year of the trial would be more similar to the established disease seen in BRASS. Models A and B classify patients according to initial treatment, methotrexate monotherapy vs. infliximab and methotrexate (Model A) (3) or initial monotherapy vs. initial combination with prednisone vs. initial combination with infliximab (Model B) (2).
The treatment variables in Models A-C are more strictly defined than what is seen in clinical practice. To be able to include more of the observational data from BRASS, we grouped BRASS subjects based on receiving either synthetic DMARD treatment at baseline (monotherapy or combinations of synthetic DMARDs) or biologic DMARD therapy (monotherapy or in combination with synthetic DMARDs) and used these variables instead of methotrexate and methotrexate/infliximab as originally described in the Models. Corticosteroid use was not considered in the treatment classification.
Main outcome
Conventional radiographs of bilateral hands and wrists were available at baseline and the 2-year follow-up visit. All radiographs were scored according to the van der Heijde modified Sharp score by trained radiologists blinded to the sequence of the radiographs (17). Due to practical reasons, four different readers shared the work. The inter-reader correlation coefficient was calculated based on 40 sets of radiographs scored by two of the readers, and was 0.93 for the baseline scoring and 0.85 for the change score. The main outcome was defined as an annual change of 5 or more units in the total van der Heijde modified Sharp score ([change in total van der Heijde modified Sharp score during the follow-up period / length of follow-up in years] ≥ 5), which is the definition of rapid radiographic progression used by all the models assessed in the analyses (2–4).
Predictor variables
Anti-cyclic citrullinated peptide antibody (anti-CCP) was measured by a second-generation ELISA assay (INOVA Diagnostics, Inc., San Diego, CA, USA), and subjects with a level of 20U/ml or higher were classified as anti-CCP positive. Rheumatoid factor (RF) was assessed by immunoturbidimetric technique on the Cobas Integra 700 analyser (Roche Diagnostics, Indianapolis, IN, USA), with reagents and calibrators from Roche. A cut-off of ≥ 15 IU/ml was used for positive status. Reagents from Diasorin (Saluggia, Italy) were used to measure high-sensitivity C-reactive protein (CRP). Experienced clinicians performed 28 swollen and tender joint counts.
Serological status is included as RF level in Model A and combinations of RF and anti-CCP positivity in Model B. 28 swollen joint count is included in model A (<10, 10–17, ≥ 17). CRP is a predictor in Model A (<6 mg/l, 6–30 mg/l, ≥30 mg/l), Model B and C (both: <10 mg/l, 10–35 mg/l, ≥35 mg/l). Erosion score (0, 1–4, ≥4) is included in Model B, while erosion status (presence/absence) is one of the variables in Model C. Model C also includes current smoking (yes/no). Models A and B stratify subjects according to treatment.
Statistical analyses
All analyses were performed using the Statistical Package for Social Sciences (SPSS) for Windows, versions 15 and 19 (SPSS Inc, Chicago, IL, USA). Patient characteristics for all patients and patient groups according to treatment at baseline, the inclusion into BRASS, were described by median (25th percentile, 75th percentile) or percentages as appropriate and potential differences between the groups assessed by Mann-Whitney U-tests.
The distribution of the variables included in the three models was assessed in all patients and in treatment groups separately. The univariate predictive value of the model variables was then tested in logistic regression models with RRP as the outcome variable. Variables with three levels were treated as categorical variables, both because a linear effect could not be assumed, but also because each variable’s categories are included in the model, and therefore ideally the each individual category should have predictive value. As sensitivity analyses, univariate regression models were run with each variable treated as an ordinal variable.
The structure of matrix risk models and the observed progression rates in BRASS were illustrated by risk model matrix charts with color coding for predicted risk from the original publications, and observed values from BRASS as numerical values in the cells. The model first published, Model A, was chosen as an illustration in the main part of the publication and the two other models are included as online supplements.
We compared models by several measures. Discriminatory properties were tested by c-statistics (also known as the area under the receiver operating characteristic curve of the predictive model), which is the area under the plot of the sensitivity vs. 1-specificity (18). The mean predicted probability was calculated for cases and non-cases. The discriminatory abilities of the models were tested pair-wise (Models A vs. B, C vs. B, A vs. C) by the integrated discrimination improvement. The integrated discrimination improvement is calculated as (average predicted probability cases – average predicted probability controls) new model – (average predicted probability cases – average predicted probability controls) old model, and a positive value indicates that the new model is an improvement over the old model. P-values were calculated as described by Pencina et al (18). The Hosmer-Lemeshow goodness of fit test examines the calibration of the model by comparing the expected and observed event rates in subgroups of the population, typically within deciles, and a significant p-value indicates that the model does not fit the observed data (12).
For each model, the observed probability of RRP was plotted for groups of subjects according to predicted probability of RRP. The groups in model A and B were based on cut-offs for quartiles, while the groups for model C were based on tertiles. A large number of subjects sharing the same predicted probability in model C meant that the construction of four groups in this model would have led to large differences in the number of subjects in each group.
Results
The median (25th percentile, 75th percentile) age of all the 478 patients included in the analyses was 59 years (50, 66), with median disease duration of 12 years at baseline (4, 23). 84% were female, 70 % anti-CCP positive and 66 % RF positive. Patients treated with biologic DMARDs (median age 57 (48, 64) years) were slightly younger than patients treated with synthetic DMARDs (median age 59 (51, 67) years, p-value for comparison 0.02). Biologic DMARD users had longer disease duration (15 (7, 27) years) than synthetic DMARD users (10 (3, 20) years, p-value <0.001).
At baseline, the median (25th percentile, 75th percentile) / mean (SD) van der Heijde-Sharp score was 28 (5, 84) / 56 (64) for all patients, 22 (4, 57) / 44 (55) in the synthetic DMARD group and 49 (8, 119)/ 71 (72) in the biologic DMARD group. Table 2 shows the distribution of the predictive variables included in the matrix risk models in BRASS, and in sub-groups according to treatment. All model variables had a skewed distribution in the BRASS dataset, with more subjects in the lower inflammatory marker categories, higher erosion score categories, and in the non-smoker group, pointing towards a different patient population in BRASS than in the early RA clinical trials in which the matrix models were developed.
Table 2.
Univariate models assessing the association between variables included in the three models, with RRP as the outcome variable. Models were run for all patients, patients receiving only synthetic DMARDs at baseline and patients receiving biologic DMARDs at baseline.
| All patients (n=478) | Patients in synthetic DMARD group at baseline (n=271) | Patients in biologic DMARD group at baseline (n=207) | ||||||||
|---|---|---|---|---|---|---|---|---|---|---|
|
| ||||||||||
| Variables | N (%) | Odds ratio (95 % confidence interval) | P-value for univariate association | N (%) | Odds ratio (95 % confidence interval) | P-value for univariate association | N (%) | Odds ratio (95 % confidence interval) | P-value for univariate association | |
| Biologic DMARD at baseline | 207 (43) | 0.8 (0.5 – 1.5) | 0.57 | - | - | - | - | - | - | |
|
| ||||||||||
| Swollen joint count | <10 (ref.) | 290 (61) | - | - | 179 (66) | - | - | 111 (54) | - | - |
| 10–17 | 129 (27) | 1.8 (1.0 – 3.3) | 0.07 | 66 (24) | 1.5 (0.7 – 3.4) | 0.33 | 63 (30) | 2.4 (0.9 – 6.5) | 0.08 | |
| ≥17 | 59 (12) | 1.1 (0.4 – 2.8) | 0.84 | 26 (10) | 1.1 (0.3 – 4.0) | 0.89 | 33 (16) | 1.3 (0.3 – 5.2) | 0.72 | |
|
| ||||||||||
| CRP (Model A) | <6ml/l (ref.) | 329 (69) | - | - | 189 (70) | - | - | 140 (68) | - | - |
| 6–30 mg/l | 120 (25) | 1.2 (0.6 – 2.3) | 0.58 | 67 (25) | 1.4 (0.6 – 3.2) | 0.41 | 53 (26) | 0.9 (0.3 – 2.7) | 0.91 | |
| ≥30 mg/l | 29 (6) | 1.0 (0.3 – 3.4) | 0.96 | 15 (6) | 0.6 (0.1 – 4.6) | 0.60 | 14 (7) | 1.5 (0.3 – 7.4) | 0.62 | |
|
| ||||||||||
| RF (Model A) | <80 U/ml (ref.) | 315 (66) | - | - | 194 (74) | - | - | 121 (59) | - | - |
| 80–200 U/ml | 72 (15) | 1.2 (0.5 – 2.7) | 0.68 | 36 (14) | 1.2 (0.4 – 3.4) | 0.73 | 36 (18) | 1.5 (0.4 – 6.0) | 0.59 | |
| >200 U/ml | 80 (17) | 2.2 (1.1 – 4.3) | 0.02 | 33 (13) | 1.0 (0.3 – 3.2) | 0.97 | 47 (23) | 5.0 (1.8 – 13.8) | <0.01 | |
|
| ||||||||||
| CRP (Model B) | <10 mg/l (ref.) | 379 (79) | - | - | 213 (79) | - | - | 166 (80) | - | - |
| 10–35 mg/l | 79 (17) | 1.1 (0.5 – 2.3) | 0.88 | 48 (18) | 1.1 (0.4 – 2.8) | 0.88 | 31 (15) | 1.0 (0.3 – 3.7) | 1.00 | |
| ≥ 35 mg/l | 20 (4) | 1.5 (0.4 – 5.2) | 0.56 | 10 (4) | 0.8 (0.1 – 6.9) | 0.87 | 10 (5) | 2.3 (0.5 – 12.0) | 0.31 | |
|
| ||||||||||
| Erosion score | 0 (ref.) | 65 (14) | - | - | 44 (16) | - | - | 21 (10) | - | - |
| 1–4 | 59 (12) | NR | NR | 32 (12) | NR | NR | 27 (13) | NR | NR | |
| ≥4 | 354 (74) | NR | NR | 195 (72) | NR | NR | 159 (77) | NR | NR | |
|
| ||||||||||
| RF/anti-CCP status | −/− (ref.) | 106 (22) | - | - | 77 (30) | - | - | 29 (14) | - | - |
| +/− or −/+ | 76 (16) | 2.6 (0.7 – 9.2) | 0.14 | 42 (16) | 2.5 (0.6 – 9.7) | 0.20 | 34 (17) | NR | NR | |
| +/+ | 280 (59) | 4.5 (1.6 – 12.9) | <0.01 | 141 (54) | 3.6 (1.2 – 10.7) | 0.02 | 139 (69) | NR | NR | |
|
| ||||||||||
| Smoking | current | 37 (8) | 0.7 (0.2 – 2.4) | 0.588 | 21 (8) | 1.4 (0.4 – 5.1) | 0.609 | 16 (8) | NR | NR |
|
| ||||||||||
| Erosions | presence | 413 (86) | NR | NR | 227 (84) | NR | NR | 186 (90) | NR | NR |
Abbreviations: Anti-CCP - Anti-cyclic citrullinated peptide antibody CRP – C-reactive protein, DMARD – disease modifying anti- rheumatic drug, RF–rheumatoid factor, NR–not reported, too few cases with the outcome in the cell to perform the analyses.
Univariate analyses
The association between the predictive variables included in the matrix risk models and RRP was assessed in univariate logistic regression models, with RRP as the outcome. Twelve percent (32/271) of patients treated with synthetic DMARD at baseline and 10% (21/207) of patients treated with biologic DMARDs were classified as having RRP. In all 478 patients, regardless of treatment, high levels of RF and combined RF/anti-CCP positivity were associated with RRP (Table 2). Some analyses could not be performed due to the skewed distribution of the BRASS subjects within levels of the predictor variables with subsequent lack of cases in each cell. For example, only 4% of the subjects were classified in the highest CRP category from model B (Table 2). Overall, most variables did not have a statistically significant association with RRP in the BRASS cohort. Similar results were observed in sensitivity analyses with ordinal variables instead of categorical variables.
Performance of models in BRASS
The observed number of cases and subjects within each cell of the three models are illustrated in Figure 1 (as well as online supplemental Figures 1 and Figure 2). The figures reveal no clear gradient of risk, i.e. the observed RRP between cells coded in different colors does not follow the originally described gradient, as would have been expected if the models performed well in the BRASS study population. It is important to note that many of the cells were populated by few patients, with a tendency towards classification of subjects in the cells with lower swollen joint counts and CRP and few subjects in the upper right, “high risk” corners.
Figure 1.
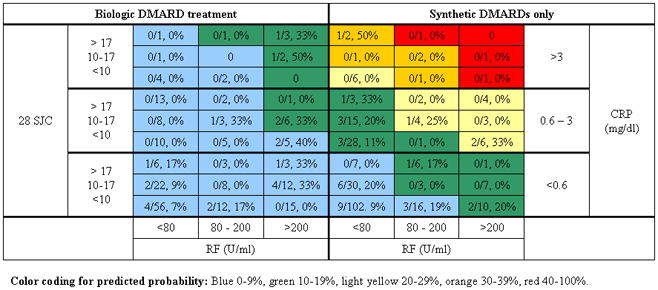
Example of the classification of patients according to Model A. 21/207 (10%) of patients receiving biologic treatment and 32/271 (12%) of patients receiving synthetic DMARDs without concomitant biologic DMARDs had RRP. The color coding in the table is the coding of the cells from the original publication, and the numbers in the cells represent the observed proportion of patients in BRASS classified within this cell who developed RRP. The figures reveal no clear gradient of risk, i.e., the observed RRP between cells coded in different colors does not follow the originally described gradient, as would have been expected if the models performed well in our study population. Several of the categories identified none or few subjects.
Abbreviations: CRP–C-reactive protein, DMARD–disease modifying anti- rheumatic drug, RF–rheumatoid factor, SJC–swollen joint count, U/ml unit per milliliter
All models had relatively low C-statistics, indicating a sub-optimal discrimination (Table 3). In pair-wise comparisons by the integrated discrimination improvement test, Model B showed a larger difference in predicted probabilities between cases and non-cases than Model A and C, suggesting better discrimination between cases and non-cases. Model A was the only model without a significant Hosmer-Lemeshow test, but the p-value was nearly significant at 0.06. The Hosmer-Lemeshow test is an indication of the fit of the model to the data, and a significant value means that the model has a poor fit. Based on these results, further classification statistics, such as net reclassification improvement (Table 1), were not calculated (12).
Table 3.
Discrimination and calibration statistics for the three models. Model specific tests in upper part of table and comparisons between models in the lower part. Integrated Discrimination Improvement is calculated as (average predicted probability cases – average predicted probability controls) new model – (average predicted probability cases – average predicted probability controls) old model, and a positive value indicates that the “new” model (mentioned last in the column heading) is an improvement over the “old” model. The Hosmer-Lemeshow goodness of fit test tests the calibration of the model by comparing the expected and observed event rates in subgroups of the population, typically within deciles, and a significant p-value indicates that the model does not fit the observed data (12).
| Model specific tests | Model A (3) | Model B (2) | Model C (4) |
|---|---|---|---|
| Discrimination | |||
| Mean predicted probability of RRP Cases /Non-cases | 9.8 / 9.1 | 29.6 / 20.2 | 20.1 / 18.2 |
| C-statistics (95% confidence intervals) | 0.59 (0.50, 0.67) | 0.65 (0.58, 0.73) | 0.57 (0.49, 0.64) |
| Calibration | |||
| Hosmer-Lemeshow chi-square statistics p-value (chi-square/degrees of freedom) | 0.059 (10.6/5) | 0.0049 (22.0/8) | 0.047 (9.64/4) |
|
| |||
| Comparison between models | Model A (3) vs. Model B (2) | Model C (4) vs. Model B (2) | Model A (3) vs. Model C (4) |
|
| |||
| Integrated Discrimination Improvement (p-value (18)) | 8.6 (<0.001) | 7.5 (0.004) | 1.1 (0.16) |
Abbreviations: RRP: rapid radiographic progression.
When grouping subjects according to their predicted probability of RRP, a clear gradient would ideally have been seen in the observed proportion of RRP between the groups. As illustrated in Figure 2, this was not the case in BRASS.
Figure 2.
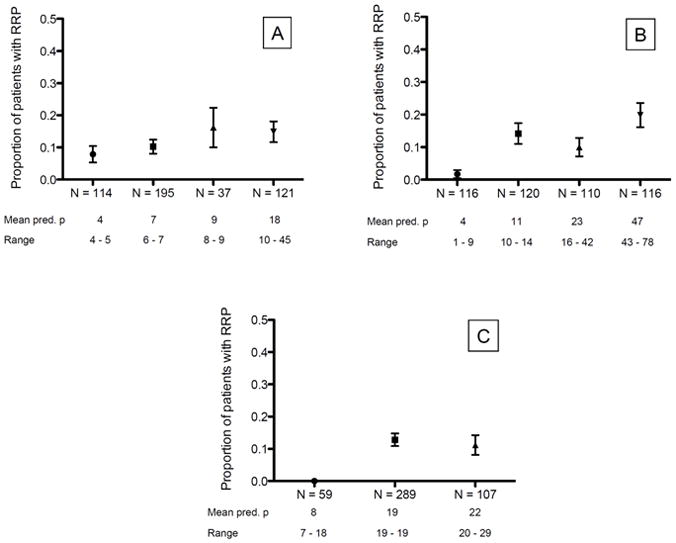
Observed proportion of RRP in groups of predicted probabilities for each model. Groups were based on tertiles/quartiles, but clustering of subjects at certain predicted probabilities in Model A and Model C meant that all groups did not contain equal numbers of subjects. Error bars represent standard error of mean. Panel A: Model A, Panel B: Model B, Panel C: Model C
Abbreviations: Pred. P = predicted probability, RRP = rapid radiographic progression
Discussion
We assessed the performance of three matrix risk models for RRP in an observational RA cohort. The findings indicate a suboptimal ability of models developed in clinical trials to predict severe radiographic joint progression in a clinic-based RA population, and highlight potential challenges for application of risk models in rheumatology.
There are several issues that might have contributed to the somewhat disappointing findings in this study. First, the models were developed in patients with reasonably short disease duration,(2–4) while BRASS includes patients of any disease duration. Second, the disease activity in the clinical trials patients was higher than in the BRASS patients, which led to a skewed distribution of BRASS subjects over the matrix cells. This observation raises the question of whether risk models should be developed for specific patient populations, or if more variables with several levels should be taken into account, for example as a calculator instead of a color-coded matrix. Third, treatment variables in the models were limited to methotrexate and methotrexate plus infliximab. The generalization of these variables to synthetic DMARDs and biologic DMARDs (including combinations with biologic DMARDs) in BRASS might have reduced the predictive abilities of the models. Although limitations of this study, these issues are also likely to be present if the risk models are applied in a clinical setting. Finally, four different readers scored the radiographs, possibly introducing some misclassification, even if inter-reader reliability was satisfactory.
Several points regarding the development of rheumatology risk model matrices warrant discussion. Risk model matrices for arthritic diseases are likely to be applied in situations where the patient has received a diagnosis and some treatment, as a minority of patients manages without DMARDs. This means that our patients already have received treatment that is confounded by indication by predicting factors for worse disease outcome, i.e. the same predicting factors that we include in our models. This circularity complicates the application of the models. The success of risk models in cardiology has its basis in models that have been developed to determine if previously untreated patients should be treated, in contrast to whether to modify preexisting treatment.
Models with several multi-level variables will stratify study subjects into numerous categories or strata. As RRP is a relative rare outcome, occurring in about 10–15 % of RA patients, a large dataset is needed to have sufficient information about cases and non-cases in each stratum of the risk model. Typically, cardiology models have been developed in observational data sets consisting of several thousand subjects, and cohorts of this size with radiographic data are not available in rheumatology at the moment. It should be a goal to instigate such collaborative efforts.
Another issue in the development process is to choose cut-offs to classify subjects into the correct risk prediction groups. It is not clear at what level of expected radiographic progression a patient should be classified as low risk (green) or high risk (red) for RRP. These are the groups with obvious treatment implications, while the intermediate (yellow) group is difficult to interpret and of limited value in a clinical setting. Without meaningful risk classification groups, the matrix will not be helpful for the clinician. Previous publications have discussed the importance of three risk level groups (low, moderate and high risk) and that, ideally, models should categorize a majority of patients into the high and low groups, with a minority in the clinically challenging intermediate group (11;18;19). Potential solutions to determine cut-offs include decision analyses, or seeking experts’ opinions. A lack of consensus on this question is illustrated by the differing cut-offs used in the three models included in this study, and that all models had more than three risk categories (4, 5 and 5) (2–4).
The present models focus solely on radiographic joint damage. An alternative outcome could have been a combination of joint damage and functional status, as was done in the development of the ACR/EULAR remission criteria (20).
Statistical methods to assess risk models mainly test calibration or discrimination, and the most common tests are summarized in Table 1. Calibration assesses the degree of agreement between the predicted probability and the observed probability. Discrimination examines if the model separates cases and non-cases. Ideally, the models should balance both – a patient who develops RRP should get a correct predicted probability for RRP (well-calibrated), and this should be different than the predicted probability for a subject who will not develop RRP (good discrimination). When comparing two risk models, the net reclassification index will assess the improvement in the correct classification of cases and non-cases. In this study, we were not able to use reclassification statistics due to the results from the Hosmer-Lemeshow tests indicating a bad fit of the models in BRASS. It has also been argued that such methods should be limited to nested models (19).
We found that published matrix risk models for RRP developed in clinical trials material had limited value in this clinical observational cohort. This might partially be due to the difference in disease duration between the trial and cohort study groups, and illustrates a need of model development in subjects with a broad range of disease activity and duration. Future research should aim to develop consensus on thresholds for risk classification to ensure clinically relevant risk categories. In conclusion, risk matrix models are potentially useful tools in rheumatology, but the development is challenging due to methodological issues.
Supplementary Material
Significance and Innovation.
This study shows a limited value of risk models for rapid radiographic progression when applied to a broad population of RA patients
Development of risk models is challenging, especially when data materials are limited, as in rheumatology
Acknowledgments
Financial support:
S. Lillegraven received a grant from the South-Eastern Norway Regional Health Authority. F.H.M Prince is supported by Niels Stensen Foundation, The Netherlands. D. H. Solomon is supported by NIH (K24 AR 055989 and 1RC2AR058989-01). BRASS is funded by Biogen IDEC, MedImmune and Crescendo Bioscience.
Footnotes
Conflict of interest statement:
N. A. Shadick has received research grants from Crescendo Biosciences, Medimmune, Abbott pharmaceuticals, AMGEN and Genentech. C.K. Iannaccone has received salary support from Biogen IDEC, MedImmune and Crescendo Biosciences. T.K. Kvien has received speaker honoraria from Abbott, AstraZeneka, MSD/Schering-Plough, Nicox, Pfizer/Wyeth, Roche, Schering-Plough, UCB, Wyeth, research grants from Abbott, BMS, MSD/Schering-Plough, Pfizer/Wyeth, Roche, UCB and consulting fees from Abbott, BMS, MSD/Schering-Plough, Nicox, Pfizer/Wyeth, Roche, UCB, Schering-Plough, UCB, Wyeth. M. E. Weinblatt is a consultant to and has received grant support from Biogen IDEC, MedImmune and Crescendo Biosciences. D. H. Solomon has received research grants from Amgen, Abbott, and Lilly within the past three years, has run a course supported by a grant from Bristol Myers Squibb and is a consultant to CORRONA. S. Lillegraven, N. Paynter, F.H.M. Prince, E. A. Haavardsholm and M.L.Frits declare no conflicts of interest.
Reference List
- 1.Scott DL, Wolfe F, Huizinga TW. Rheumatoid arthritis. Lancet. 2010;376(9746):1094–108. doi: 10.1016/S0140-6736(10)60826-4. [DOI] [PubMed] [Google Scholar]
- 2.Visser K, Goekoop-Ruiterman YP, de Vries-Bouwstra JK, Ronday HK, Seys PE, Kerstens PJ, et al. A matrix risk model for the prediction of rapid radiographic progression in patients with rheumatoid arthritis receiving different dynamic treatment strategies: post hoc analyses from the BeSt study. Ann Rheum Dis. 2010;69(7):1333–7. doi: 10.1136/ard.2009.121160. [DOI] [PubMed] [Google Scholar]
- 3.Vastesaeger N, Xu S, Aletaha D, St Clair EW, Smolen JS. A pilot risk model for the prediction of rapid radiographic progression in rheumatoid arthritis. Rheumatology (Oxford) 2009;48(9):1114–21. doi: 10.1093/rheumatology/kep155. [DOI] [PubMed] [Google Scholar]
- 4.Engstrom A, Saevarsdottir S, Rezaei H, Geborek P, Petersson I, Ernestam S, et al. Development of a matrix risk model for prediction of rapid radiographic progression based on the SWEFOT trial population. Ann Rheum Dis. 2011;70(Suppl3):77. Ref Type: Abstract. [Google Scholar]
- 5.Durnez A, Vanderschueren G, Lateur L, Westhovens R, Verschueren P. Effectiveness of initial treatment allocation based on expert opinion for prevention of rapid radiographic progression in daily practice of an early RA cohort. Ann Rheum Dis. 2011;70(4):634–7. doi: 10.1136/ard.2010.135319. [DOI] [PubMed] [Google Scholar]
- 6.Saevarsdottir S, Wallin H, Seddighzadeh M, Ernestam S, Geborek P, Petersson IF, et al. Predictors of response to methotrexate in early DMARD naive rheumatoid arthritis: results from the initial open-label phase of the SWEFOT trial. Ann Rheum Dis. 2011;70(3):469–75. doi: 10.1136/ard.2010.139212. [DOI] [PubMed] [Google Scholar]
- 7.Vastesaeger N, van der HD, Inman RD, Wang Y, Deodhar A, Hsu B, et al. Predicting the outcome of ankylosing spondylitis therapy. Ann Rheum Dis. 2011;70(6):973–81. doi: 10.1136/ard.2010.147744. [DOI] [PMC free article] [PubMed] [Google Scholar]
- 8.Wilson PW, D’Agostino RB, Levy D, Belanger AM, Silbershatz H, Kannel WB. Prediction of coronary heart disease using risk factor categories. Circulation. 1998;97(18):1837–47. doi: 10.1161/01.cir.97.18.1837. [DOI] [PubMed] [Google Scholar]
- 9.Conroy RM, Pyorala K, Fitzgerald AP, Sans S, Menotti A, De BG, et al. Estimation of ten-year risk of fatal cardiovascular disease in Europe: the SCORE project. Eur Heart J. 2003;24(11):987–1003. doi: 10.1016/s0195-668x(03)00114-3. [DOI] [PubMed] [Google Scholar]
- 10.Pencina MJ, D’Agostino RB, Sr, Steyerberg EW. Extensions of net reclassification improvement calculations to measure usefulness of new biomarkers. Stat Med. 2011;30(1):11–21. doi: 10.1002/sim.4085. [DOI] [PMC free article] [PubMed] [Google Scholar]
- 11.Pencina MJ, D’Agostino RB, Vasan RS. Statistical methods for assessment of added usefulness of new biomarkers. Clin Chem Lab Med. 2010;48(12):1703–11. doi: 10.1515/CCLM.2010.340. [DOI] [PMC free article] [PubMed] [Google Scholar]
- 12.Cook NR, Ridker PM. Advances in measuring the effect of individual predictors of cardiovascular risk: the role of reclassification measures. Ann Intern Med. 2009;150(11):795–802. doi: 10.7326/0003-4819-150-11-200906020-00007. [DOI] [PMC free article] [PubMed] [Google Scholar]
- 13.Ridker PM, Buring JE, Rifai N, Cook NR. Development and validation of improved algorithms for the assessment of global cardiovascular risk in women: the Reynolds Risk Score. JAMA. 2007;297(6):611–9. doi: 10.1001/jama.297.6.611. [DOI] [PubMed] [Google Scholar]
- 14.Steyerberg EW, Vickers AJ, Cook NR, Gerds T, Gonen M, Obuchowski N, et al. Assessing the performance of prediction models: a framework for traditional and novel measures. Epidemiology. 2010;21(1):128–38. doi: 10.1097/EDE.0b013e3181c30fb2. [DOI] [PMC free article] [PubMed] [Google Scholar]
- 15.Iannaccone CK, Lee YC, Cui J, Frits ML, Glass RJ, Plenge RM, et al. Using genetic and clinical data to understand response to disease-modifying anti-rheumatic drug therapy: data from the Brigham and Women’s Hospital Rheumatoid Arthritis Sequential Study. Rheumatology (Oxford) 2011;50(1):40–6. doi: 10.1093/rheumatology/keq263. [DOI] [PubMed] [Google Scholar]
- 16.Arnett FC, Edworthy SM, Bloch DA, McShane DJ, Fries JF, Cooper NS, et al. The American Rheumatism Association 1987 revised criteria for the classification of rheumatoid arthritis. Arthritis Rheum. 1988;31(3):315–24. doi: 10.1002/art.1780310302. [DOI] [PubMed] [Google Scholar]
- 17.van der Heijde D. How to read radiographs according to the Sharp/van der Heijde method. J Rheumatol. 2000;27(1):261–3. [PubMed] [Google Scholar]
- 18.Pencina MJ, D’Agostino RB, Sr, D’Agostino RB, Jr, Vasan RS. Evaluating the added predictive ability of a new marker: from area under the ROC curve to reclassification and beyond. Stat Med. 2008;27(2):157–72. doi: 10.1002/sim.2929. [DOI] [PubMed] [Google Scholar]
- 19.Janes H, Pepe MS, Gu W. Assessing the value of risk predictions by using risk stratification tables. Ann Intern Med. 2008;149(10):751–60. doi: 10.7326/0003-4819-149-10-200811180-00009. [DOI] [PMC free article] [PubMed] [Google Scholar]
- 20.Felson DT, Smolen JS, Wells G, Zhang B, van Tuyl LH, Funovits J, et al. American college of rheumatology/european league against rheumatism provisional definition of remission in rheumatoid arthritis for clinical trials. Ann Rheum Dis. 2011;70(3):404–13. doi: 10.1136/ard.2011.149765. [DOI] [PubMed] [Google Scholar]
Associated Data
This section collects any data citations, data availability statements, or supplementary materials included in this article.