Abstract
A finely tuned balance of translation, storage and decay of mRNAs (mRNAs) is important for the regulation of gene expression. In eukaryotic cells, this takes place in dynamic cytoplasmic RNA-protein granules termed Processing bodies (P-bodies). In this study, by using immunoelectron tomography, 3D modeling and template matching, we analyze the size and the organization of the polysomes in the vicinity of human P-bodies. Our results show the presence of several polysomes that are compatible with a translational activity around P-bodies. Therefore, movement of mRNAs between polysomes and P-bodies can take place when the two compartments are in close contact. The presence of initiation factors in the proximity of P-bodies also suggests that translation of mRNAs can resume at the periphery of these granules.
Keywords: electron tomography, initiation, mRNA, P-bodies, polysomes, ribosomes
Introduction
In eukaryotic cells, regulation of gene expression can occur at the post-transcriptional level, through a finely tuned balance of translation, storage and decay of mRNAs (mRNAs). While translation occurs throughout the cytosol, silencing and degradation of mRNAs can take place in dynamic cytoplasmic RNA-protein granules called Processing bodies (P-bodies). P-bodies assemble on non-translating mRNAs and are made of multiple components involved in mRNA decay or in microRNA (miRNA) translational repression machinery.1 Each mammalian cell contains two to 10 P-bodies. We recently reported that P-bodies display an internal bi-compartmentalization with peripheral protrusions anchored to a dense central core where decay enzymes accumulate. The peripheral area of the P-body is likely dedicated to the docking of repressed mRNAs, while the core to their degradation.2 In the working model of the “mRNA cycle,” mRNAs present on polysomes produce polypeptides through multiple rounds of translation. Then, in response to changes in the cellular environment or through specific recruitments, the competition between the translating machinery and the translation’s repressors directs the mRNAs toward the P-bodies for temporary storage or definitive degradation.3,4 While still binding to translation initiation factors, non-translating mRNAs can also accumulate in stress granules. Therefore, cytoplasmic mRNAs cycle between active polysomes, P-bodies and Stress granules.5 The competition between degradation, repression and return to translation is especially fierce in P-bodies, but the mechanisms triggering the fate of the mRNAs remain elusive. In particular, the extent of the association between polysomes and P-body components that regulate the transition of mRNAs between translating and non-translating assemblies is unknown. This would help explain how mRNAs are oriented to P-bodies and how they can return to the pool of translating ribosomes instead of being definitively degraded. In this study, we analyze the organization of the ribosomes in the vicinity of mammalian P-bodies using immunoelectron tomography, 3D modeling and template matching. Our results show the presence of several polysomes that are compatible with a translational activity in close connection with P-bodies. It has already been suggested that mRNA is sent from a translating pool to P-bodies for degradation. However, the presence of initiation factors in close proximity to the P-bodies suggests that re-initiation might also occur. The fate of the mRNAs transiting into P-bodies is discussed here with regard to these new data.
Results
Ribosomes and translation initiation factors can be detected in P-bodies
While the capacity of P-bodies to regulate translation through mRNA decay has been clearly demonstrated,1 the return of mRNAs from the P-bodies toward polysomes is more controversial and probably limited to a subset of mRNAs that control cellular adaptive responses.6 When such mRNAs exit, resumption of translation is likely to take place in close proximity to the P-bodies. First, we confirmed the presence of ribosomes adjacent to P-bodies using immunoelectron microscopy (IEM) which, compared with immunofluorescence, can provide a greater sensitivity when the signal is weak. As shown on Figure 1A, P-bodies are marked with anti-hDcp1a (large gold particles) and the ribosomes (small gold particles, black arrow) are located on and around the P-bodies, some even being sufficiently ordered to be interpreted as polysomes (white arrow). Eukaryotic initiation is allowed by the assembly of elongation-competent 80S ribosomes, which require at least nine initiation factors.7 Among these, the cap-binding protein eIF4E and the scaffold made by eIF4G play major roles in attaching the initiating mRNAs to the small ribosomal subunit (40S). The accumulation of eIF4E in P-bodies has already been described by immunofluorescence.8,9 However, it must be pointed out that the presence of eIF4E is necessary but not enough on its own, as the initiation factor can either take part in the recruitment of 43S pre-initiation complexes7 or interact with 4E-transporter to target the mRNA to P-bodies for decay.9 Therefore, to understand whether any of the observed ribosomes initiate translation, we looked for the presence of the other major initiation factor eIF4G in and around the P-bodies using IEM (Fig. 1B). Contrary to IF techniques,8 IEM allows for the detection of eIF4G (small gold particles in Fig. 1B), revealing for the first time the presence of this initiation factor at the periphery of a mammalian P-body where ribosomes accumulate. These data strongly suggest that translation can resume just at the periphery of P-bodies. To determine if the re-initiation involves mRNAs containing a premature termination codon (PTC), we looked for the presence of CBP80, a component of the cap-binding complex. Indeed, this complex is a marker for the so-called pioneer round of translation when PTC-containing mRNAs are examined by nonsense-mediated decay.10 However, a direct interaction of the P-bodies with CBP80 (small gold particles in Fig. 1C), could not be recovered, arguing against the recruitment of the cap-binding complex at the periphery of P-bodies when translation resumes.
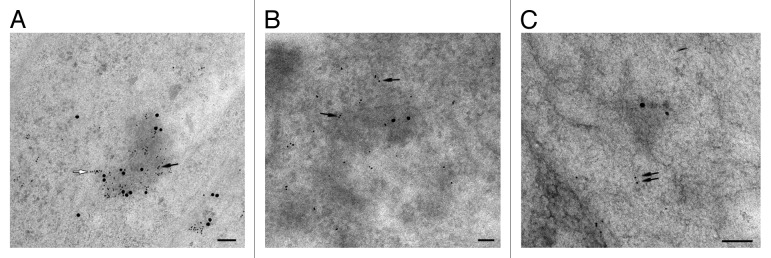
Figure 1. Ribosomes, translation initiation factor eIF4G but not CBP80 can be detected in P-bodies. (A) Immunogold detection with mouse anti-5,8S rRNA and rabbit anti-hDcp1a antibodies. Although several gold particles can label one single ribosome, clearly organized clusters attributable to polysomes are visible at the periphery of the P-body (white arrow). (B) Immunogold detection with rabbit anti-heIF4G and mouse anti-hDcp1a antibodies. (C) Immunogold detection with rabbit anti-hCBP80 and mouse anti-hDcp1a antibodies. hDcp1a was labeled with 15 nm gold particles, while the 5,8S rRNA, eiF4G and CBP80 were labeled with 6 nm gold particles (black arrows). Scale bar: 100 nm. It has to be noted that in a double-labeling experiment, the labeling of the first antigen produces a sterical hindrance to the full access of the second antibody, explaining the limited label of hDcp1a in each of the pictures.
Identification and distribution of ribosomes around P-bodies
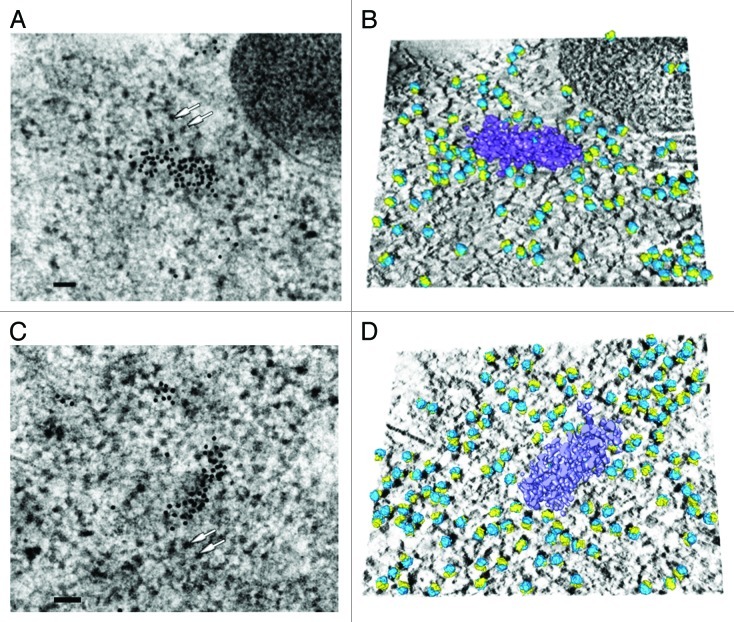
In order to obtain a 3D model of ribosomes linked to P-bodies in conditions as close as possible to their native state, we performed immunoelectron tomography on human HeLa cells subjected to high-pressure freezing followed by freeze-substitution. This approach retains macrocomplex structures with low artifacts, and enables the acquisition of high-resolution images of cytoplasmic domains such as P-bodies.2 To facilitate the detection of ribosomes and P-bodies, Bernhard’s EDTA regressive staining was performed. Indeed, this procedure allows a better detection of ribonucleoprotein complexes (i.e., ribosomes or P-bodies) based on the fact that, after ultrathin sections staining with uranyl acetate, the chelating agent EDTA preferentially removes the stain from DNA rather than RNA.11 For tomography, tilt-series from -60°‒+60° with an angular increment of 1° were recorded (Figs. S1 and 2). Figure 2A and C present the 0° tilt images of two series. After immunolabeling, the high-density regions corresponding to two different P-bodies were characterized by the presence of gold particles. Densities corresponding to 80S ribosome can also be observed forming clusters of various lengths and organizations (Fig. 2A and C, white arrows). To characterize the 3D organization of the ribosomes next to the P-bodies, we then reconstructed the tomograms and removed the densities corresponding to the gold particles. The P-bodies observed in our study, highlighted using watershed segmentation, are electron-dense bodies, both measuring ~230 nm (Fig. 2B and D, purple structures). A template-matching approach using MOLMATCH12 and TOM Toolbox13 allowed us to detect ribosomal particles and fit the template in the best-correlated positions and orientations on the tomogram (see also Material and Methods). After removing false positives, we retained 108 densities corresponding to ribosomes on the first tomogram (Fig. 2B, large subunits in blue and small subunits in yellow), and 140 on the second one (Fig. 2D, same color code). The cross-correlation coefficients between the 80S ribosomal template and the tomograms at those specific positions ranged from 0.38‒0.50, in accordance with recent observations of polysomes in human glioblastoma cells.14 To analyze the spatial distribution of the ribosomes near P-bodies, ellipsoids surrounding six different P-bodies in six different tomograms were drawn. To demarcate the region in the vicinity of the P-body, the dimensions of this ellipsoid were then multiplied by a factor of two (Fig. S3). Ribosomes, which can be observed as dark dense bodies following Bernhard’s EDTA regressive staining (Fig. S3), were counted inside and outside of this volume and their number per µm3 was compared. This analysis reveals a 3.6-fold increase in ribosome density around the P-body: 22,865 ribosomes/µm3 around the P-body, with 70 ribosomes counted on the 6 tomograms; and 6,370 ribosomes/µm3 outside, with 766 ribosomes counted.
Figure 2. Three-dimensional reconstruction of two different P-bodies with surrounding ribosomes highlighted. (A and C) Image (0°) of two tilted series. Human P-body is detected by immunoelectron microscopy following Bernhard’s EDTA regressive staining, which allows easier visualization of RNA-containing structures such as ribosomes (white arrows). For the immunogold detection of P-bodies, antibodies against hDcp1a were labeled with 10 nm gold particles. Scale bar: 100 nm. (B and D) Composite images combining: the average of the 10 central digital slices of the tomogram (solid mode); the P-body (surface mode, purple) delimited by watershed segmentation after removing the density corresponding to gold particles; and 80S ribosome models (surface mode, large subunits in blue, small subunits in yellow) properly positioned in the tomogram after molecular matching. The representations are tilted for better visualization.
Organization of the ribosomes into polysomes
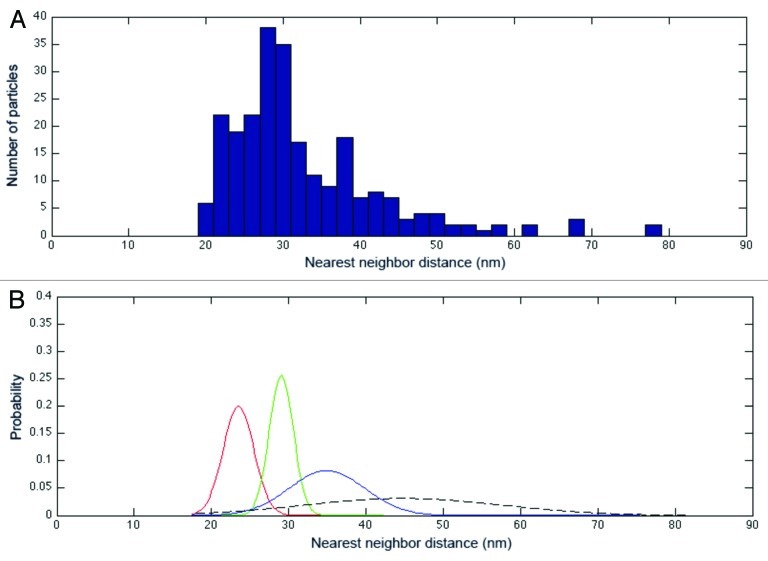
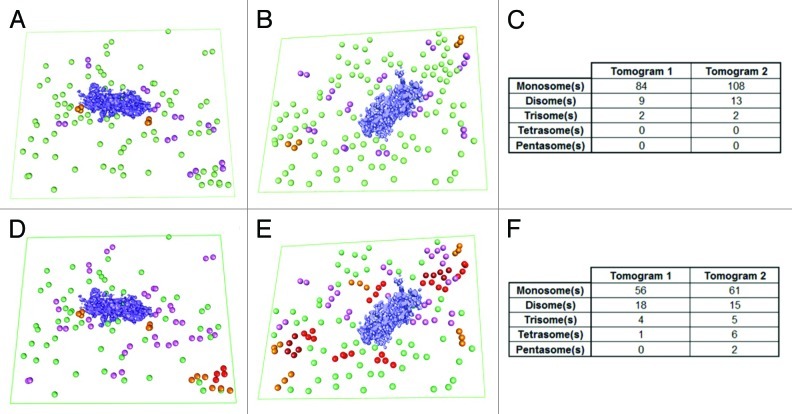
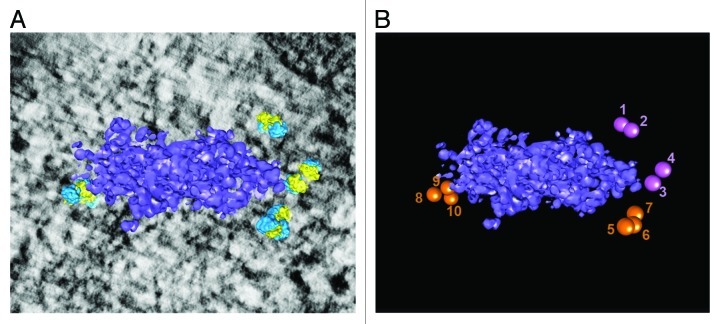
At the level of translation, gene expression can be regulated through the relative association of mRNAs with polysomes, reflecting a translationally active state. To further explore whether mRNAs in the vicinity of P-bodies are actively involved in polysomes, we took advantage of the unique potential of electron-tomography to determine the position of macrocomplexes inside cells.15 To assess the presence of polysomes in the tomograms, we calculated the distribution of each ribosome in regard to its nearest neighbor by measuring center-to-center distances.14 For statistical purposes, the distances calculated for each tomogram were merged. The resulting distribution is plotted in Figure 3A. The distribution was then deconvoluted, with the best result obtained with four separated Gaussian curves (Fig. 3B). The analysis revealed two major populations on the data set, with a mean distance between neighboring particles of 23.5 ± 1.99 nm and 29.05 ± 1.56 nm (Fig. 3B, red and green curves, respectively), corresponding to closely connected ribosomes that are potentially forming polysomes. The analysis also revealed two minor populations corresponding to isolated particles (Fig. 3B, blue and dotted line curves). These data are in accord with previous measurements of distances between ribosomes in eukaryotic polysomes.14,16 Based on our results, we set two cutoff distances to be used in considering whether two ribosomes are members of the same polysome. These cutoffs were chosen to be equal to the mean distance between neighboring particles in the two major populations plus one standard deviation (25.5 nm for population 1; 30.6 nm for population 2). Using the more stringent value, we found 9 disomes and 2 trisomes in tomogram 1; and 13 disomes and 2 trisomes in tomogram 2 (Fig. 4A‒C). Using the broader cutoff, we found a similar distribution of polysomal length with the expected higher levels of polysomes: 18 disomes, 4 trisomes and 1 tetrasome in tomogram 1; and 20 disomes, 6 trisomes, 2 tetrasomes and 2 pentasomes in tomogram 2 (Fig. 4D‒F). In both cases, only short polysomes (n ≤ 3) were detected next to the P-bodies as shown in Figure 5.
Figure 3. Clustering of nearest-neighbor center-to-center distances. (A) Distribution of nearest-neighbor center-to-center distances between all ribosome particles in the data set (n = 248) (For statistical relevance, the data from the two tomograms presented in Fig. 1 were merged). (B) Normal probability density functions corresponding to the data set in (A) (μ, average; σ, standard deviation). The analysis underlines the presence of two main populations (red and green lines) corresponding to ribosomes in close contact, as well as two minor ones (blue and dotted lines) corresponding to isolated particles.
Figure 4. Visualization of polysomes in the vicinity of the P-body on two different tomograms. (A and B) Distribution of the polysomes detected using a cutoff of 25.5 nm on tomograms 1 and 2, respectively. (D and E) Same analysis, but using a cutoff of 30.6 nm. Disomes are colored in pink, trisomes in orange, tetrasomes in red and pentasomes in dark red. For comparison, the isolated ribosomes (those with nearest-neighbor center-to-center distances higher than the cutoffs) are also depicted, in green. (C and F) Distribution of ribosomal units per polysome from the two same tomograms with cutoffs of 25.5 nm and 30.6 nm, respectively. Note that only small polysomes are closely associated with the P-bodies.
Figure 5. Short polysomes are detected next to the P-bodies. (A) Three-dimensional reconstruction of a P-body and closest polysomes (after removing the isolated particles using the most stringent cutoff of 25.5 nm). (B) Numbering of the ribosomes forming the polysomes that interact with the P-body (disomes are in purple, trisomes in orange).
Discussion
P-bodies are cytoplasmic granules in which expression of a subset of mRNAs is transiently or definitively repressed. The “mRNA cycle” working model, in which mRNAs undergo repeated translation cycles for protein production, has been proposed to explain P-bodies' central role in storage and/or decay. In response to translation defects, external stimuli or recruitment of specific factors, mRNAs are released from polysomes and sent to P-bodies.5 One challenge is to reveal the remodeling steps undergone by mRNA that is exiting translation and moving toward degradation and/or storage in the P-body. In this study, we show that the area surrounding P-bodies is enriched with ribosomes, forming several polysomes having distances and orientations compatible with active translation. Therefore, the current data show that movements of mRNA between polysomes and P-bodies can take place as a result of the close contacts between the two compartments. These movements are likely to be reciprocal and it will be difficult to distinguish mRNAs released from polysomes for incorporation into P-bodies from those already stored in P-bodies and going through re-initiation. However, the presence of eIF4E and eIF4G in the vicinity of the P-bodies, where polysomes accumulate, clearly suggests that a translational activity can start on the outskirts of the P-bodies, without excluding the possibility that co-translational degradation of some mRNAs can also occur, as previously described in yeast.17 This activity likely favors a fast translational regulation, notably in response to different stresses.18
One future challenge will be to determine which classes of mRNA are associated with the polysomes at the periphery of the P-body. Good candidates would be miRNA-repressed mRNA and mRNA containing a premature termination codon (PTC). mRNAs subjected to translational repression by miRNAs have been seen to congregate at the periphery of P-bodies2,19and also to have been released from these granules.4 It is thus tempting to speculate that translation re-initiation of these mRNAs might occur as soon as they exit from their storage compartments. In a same way, PTC-containing mRNAs are sent to P-bodies in order to be rapidly degraded through the nonsense-mediated decay (NMD) pathway and they have been described to accumulate at the periphery of P-bodies.20 NMD is thought to occur on mRNA bound to cap-binding complex and subjected to the pioneer round of translation. This round occurs when mature mRNA reaches the cytoplasm, and involves recruitment of ribosomes through direct interactions between eiF4G and CBP20/CBP80, the two components of the cap-binding complex.10 However, by using anti-CBP80 antibodies, we were not able to localize CBP80 in P-bodies, neither by immunofluorescence (not shown) or immunoelectron microscopy (Fig. 1C), arguing against a pioneer round of translation on P-bodies.
The molecular signals triggering endogenous mRNA to escape from P-bodies are still unknown. A possibility is that only a limited subset of mRNAs could be reactivated.6 In that case, the signals determining the fate of these selected mRNAs might be due to the presence of RNA-binding proteins, which affect the stability of the repressed mRNA in the P-body itself. Among these signals, the length of the poly(A) tail and the presence of the 5′cap are correlated with the capacity of translational resurrection. From the model presented here, we can speculate that proteins at the periphery of P-bodies (e.g., rck/p54) might recruit the sequestered mRNAs to protect them against decay enzymes and to act as platforms for their return to translation. The fate of mRNA (either storage or decay) will thus be determined at the interface between the two compartments of the P-body, through the competition between the protective peripheral platform and the core machinery made of decapping enzymes and exoribonucleases.
Materials and Methods
High-pressure freezing/freeze substitution
A cell slurry was made by re-suspending HeLa cells in 20% BSA in DMEM. A 2 µl drop of the pellet was loaded on pre-heated 0.5-mm thick flat specimen carrier having gold plated surface with a cavity diameter of 1.5 mm and a cavity depth of 0.2 mm (Cat. No 16706898, Leica Microsystems AG) and cells were frozen in the Leica EM PACT2 high-pressure freezer. Frozen samples in the carriers under liquid nitrogen were transferred immediately to an automatic freeze substitution system (Leica EM AFS2) equipped with an automatic reagent-handling system (Leica EM FSP) and placed in the -90°C precooled substitution solution. Cells were freeze-substituted in acetone containing 0.1% uranyl acetate at -90°C for 60 h. After that, temperature was elevated at a rate of 3°C/h to -50°C and samples were kept at this temperature for 24 h. Then, samples were washed one time with acetone and three times with 100% ethanol at -50°C. Samples were infiltrated with resin/100% ethanol mixtures by raising volume to volume proportion of Lowicryl HM20 (25% for 2 h, 50% for 2 h, 75% overnight and 100% four times for 1 h). Finally, polymerization was carried at -50°C for 48 h and at 20°C for 48 h. Ultrathin sections (90–110 nm) were collected on nickel grids (300 mesh).
Bernhard’s EDTA regressive staining
Prior to the reaction, P-bodies were immune-detected with rabbit anti-hDcp1a, as previously described.2 Bernhard’s EDTA regressive staining was performed according to Pearson and Davies.21 Briefly, grids were incubated in 2% uranyl acetate for 17 h at 50°C and then incubated for 2 h at room temperature with 0.2 M EDTA pH = 7. After subsequent washes with water, grids were incubated for 1 min with lead citrate.
Electron tomography and 3D reconstruction
To observe P-bodies and the 3D ultrastructural organization of ribosomes in HeLa cells, we used an immunoelectron tomography (IET) approach. Thin sections were prepared as in our previous work.2 P-bodies were selected using immunodetection with an anti-hDcp1a antibody and then tilt-series were recorded on a Tecnai G2 Sphera transmission electron microscope (FEI Company) operating at 200 kV with a nominal magnification of ×25,000. Digital images were collected with a 2 k × 2 k Megascan CCD camera. Tilt-series of 80‒100 nm-thick sections were recorded from -60°‒+60° with an angular increment of 1°. The images in the tilt series were pre-processed and aligned using the existing gold labeling as fiducial markers. The eTomo graphical user interface of the IMOD tomography package22 was used to calculate the 3D reconstruction. To accelerate the process, images were binned two times. Using the same package, CTF correction and 2D filtering were applied on the tilt series before reconstruction. The final tomograms were reconstructed with either 100 SIRT iterations (tomogram 1) or with weighted back-projection (tomogram 2). The tomogram resolutions, estimated at 35Å, were calculated using the McEwen and Marko formulation specially designed for resin-embedded samples.23 Visualization, map segmentation and surface rendering were performed using the UCSF CHIMERA software.24
Template matching
To identify the ribosomes in tomograms, we employed a template-matching approach, based on the measurement of the correlation between the template (density map of a reference particle) and the tomogram.12,25 Using the IMAGIC software, the template was generated from the atomic structure of a eukaryote 80S ribosome (PDB ID: 3O30 and 3O5H) by down-sampling to the same pixel size as the tomogram and filtering to the same resolution. All files were then converted into EM format using the TOM Toolbox13 on MATLAB. The template-matching process was performed using the MOLMATCH software.12 During this process, the cross-correlation function was calculated with an angular increment of 10° for all Euler angles. Furthermore, since the ribosome is an asymmetric object, we used for the template-matching procedure the full range of 0–360° for φ and ψ and 0–180° for θ. Cross-correlation maxima were extracted with the Av3 package26 while using a minimum peak radius equal to that of the 80S ribosome. This resulted in a set of potential particles, defined by their coordinates (x, y, z) and relative orientations (φ, ψ, θ). These were visually assessed, and those that corresponded to a truncated density (at the border of the tomogram) were removed. To interpret the results and extract polysomes, we performed nearest-neighbor center-to-center distance analysis on a merged data set containing the coordinates of ribosomes in the two tomograms. Normal probability density functions were calculated and several cutoffs were used to determine whether ribosomes form polysomes. It has to be noted that the thicknesses of the sections used in tomography allow the observation of long polysomes on the horizontal planes but still limits the number of ribosomes on the vertical one to up to three, thus favoring the visualization of shorter polysomes.
Immunoelectron microscopy
Lowicryl HM20-embedded thin sections of HeLa cells were first blocked with 1% serum albumin in 100 mM pH = 7.4 Phosphate buffer for 150 min and then reacted with primary antibody diluted in blocking buffer for 2 h. Rabbit and mouse anti-hDcp1a antibodies were both diluted at 1:250. Following four washes with blocking buffer (10 min each) and one wash in 100 mM TRIS-HCl pH = 7.4 containing 1% serum albumin, grids were incubated for 1 h with the second antibody coupled with 10 nm gold particles (dilution 1:40, Delta Microscopies). After subsequent washes with TRIS-HCl pH = 7.4 buffer containing 1% serum albumin, grids were fixed with 2.5% glutaraldehyde and contrasted for 90 min in 5% uranyl acetate. Double immunodetections consisted of repeating two single immunodetections in a row. The first detection was performed with the same antibodies as for immunofluorescence experiments: Y10B at 1:2 dilution, anti-heIF4G undiluted or anti-heIF4E at 1:5 dilution revealed with goat anti-rabbit coupled with 6 nm gold particles (at 1:40 dilution, Delta Microscopies). The second detection was performed with mouse anti-hDcp1a (at 1:250 dilution) revealed with goat anti-mouse coupled with 15 nm gold particles (at 1:40 dilution, Delta Microscopies).
Supplementary Material
Acknowledgments
N.C. was supported by a post-doctoral fellowship from the Ligue Nationale Contre le Cancer. This work was supported by grants ANR-08JCJC-0027-01 and ANR-09-MIE. We are grateful to F. Förster for supplying us with MOLMATCH Software and TOM Toolbox, to E. Izaurralde for the anti CBP80 antibody and to Juliana Berland for insightful comments on the work. EM and fluorescence experiments were processed at the Microscopy Rennes Imaging Center (MRic) facilities (www.microscopie.univ-rennes1.fr/).
Disclosure of Potential Conflicts of Interest
No potential conflicts of interest were disclosed.
Footnotes
Previously published online: www.landesbioscience.com/journals/rnabiology/article/23342
References
- 1.Eulalio A, Behm-Ansmant I, Izaurralde E. P bodies: at the crossroads of post-transcriptional pathways. Nat Rev Mol Cell Biol. 2007;8:9–22. doi: 10.1038/nrm2080. [DOI] [PubMed] [Google Scholar]
- 2.Cougot N, Cavalier A, Thomas D, Gillet R. The dual organization of P-bodies revealed by immunoelectron microscopy and electron tomography. J Mol Biol. 2012;420:17–28. doi: 10.1016/j.jmb.2012.03.027. [DOI] [PubMed] [Google Scholar]
- 3.Decker CJ, Parker R. P-bodies and stress granules: possible roles in the control of translation and mRNA degradation. Cold Spring Harb Perspect Biol. 2012;4:a012286. doi: 10.1101/cshperspect.a012286. [DOI] [PMC free article] [PubMed] [Google Scholar]
- 4.Bhattacharyya SN, Habermacher R, Martine U, Closs EI, Filipowicz W. Relief of microRNA-mediated translational repression in human cells subjected to stress. Cell. 2006;125:1111–24. doi: 10.1016/j.cell.2006.04.031. [DOI] [PubMed] [Google Scholar]
- 5.Balagopal V, Parker R. Polysomes, P bodies and stress granules: states and fates of eukaryotic mRNAs. Curr Opin Cell Biol. 2009;21:403–8. doi: 10.1016/j.ceb.2009.03.005. [DOI] [PMC free article] [PubMed] [Google Scholar]
- 6.Arribere JA, Doudna JA, Gilbert WV. Reconsidering movement of eukaryotic mRNAs between polysomes and P bodies. Mol Cell. 2011;44:745–58. doi: 10.1016/j.molcel.2011.09.019. [DOI] [PMC free article] [PubMed] [Google Scholar]
- 7.Jackson RJ, Hellen CU, Pestova TV. The mechanism of eukaryotic translation initiation and principles of its regulation. Nat Rev Mol Cell Biol. 2010;11:113–27. doi: 10.1038/nrm2838. [DOI] [PMC free article] [PubMed] [Google Scholar]
- 8.Andrei MA, Ingelfinger D, Heintzmann R, Achsel T, Rivera-Pomar R, Lührmann R. A role for eIF4E and eIF4E-transporter in targeting mRNPs to mammalian processing bodies. RNA. 2005;11:717–27. doi: 10.1261/rna.2340405. [DOI] [PMC free article] [PubMed] [Google Scholar]
- 9.Ferraiuolo MA, Basak S, Dostie J, Murray EL, Schoenberg DR, Sonenberg N. A role for the eIF4E-binding protein 4E-T in P-body formation and mRNA decay. J Cell Biol. 2005;170:913–24. doi: 10.1083/jcb.200504039. [DOI] [PMC free article] [PubMed] [Google Scholar]
- 10.Maquat LE, Tarn WY, Isken O. The pioneer round of translation: features and functions. Cell. 2010;142:368–74. doi: 10.1016/j.cell.2010.07.022. [DOI] [PMC free article] [PubMed] [Google Scholar]
- 11.Bernhard W. A new staining procedure for electron microscopical cytology. J Ultrastruct Res. 1969;27:250–65. doi: 10.1016/S0022-5320(69)80016-X. [DOI] [PubMed] [Google Scholar]
- 12.Förster F, Han BG, Beck M. Visual proteomics. Methods Enzymol. 2010;483:215–43. doi: 10.1016/S0076-6879(10)83011-3. [DOI] [PubMed] [Google Scholar]
- 13.Nickell S, Förster F, Linaroudis A, Net WD, Beck F, Hegerl R, et al. TOM software toolbox: acquisition and analysis for electron tomography. J Struct Biol. 2005;149:227–34. doi: 10.1016/j.jsb.2004.10.006. [DOI] [PubMed] [Google Scholar]
- 14.Brandt F, Carlson LA, Hartl FU, Baumeister W, Grünewald K. The three-dimensional organization of polyribosomes in intact human cells. Mol Cell. 2010;39:560–9. doi: 10.1016/j.molcel.2010.08.003. [DOI] [PubMed] [Google Scholar]
- 15.Ortiz JO, Förster F, Kürner J, Linaroudis AA, Baumeister W. Mapping 70S ribosomes in intact cells by cryoelectron tomography and pattern recognition. J Struct Biol. 2006;156:334–41. doi: 10.1016/j.jsb.2006.04.014. [DOI] [PubMed] [Google Scholar]
- 16.Christensen AK, Bourne CM. Shape of large bound polysomes in cultured fibroblasts and thyroid epithelial cells. Anat Rec. 1999;255:116–29. doi: 10.1002/(SICI)1097-0185(19990601)255:2<116::AID-AR2>3.0.CO;2-O. [DOI] [PubMed] [Google Scholar]
- 17.Hu W, Sweet TJ, Chamnongpol S, Baker KE, Coller J. Co-translational mRNA decay in Saccharomyces cerevisiae. Nature. 2009;461:225–9. doi: 10.1038/nature08265. [DOI] [PMC free article] [PubMed] [Google Scholar]
- 18.Lavut A, Raveh D. Sequestration of highly expressed mRNAs in cytoplasmic granules, P-bodies, and stress granules enhances cell viability. PLoS Genet. 2012;8:e1002527. doi: 10.1371/journal.pgen.1002527. [DOI] [PMC free article] [PubMed] [Google Scholar]
- 19.Pillai RS, Bhattacharyya SN, Artus CG, Zoller T, Cougot N, Basyuk E, et al. Inhibition of translational initiation by Let-7 MicroRNA in human cells. Science. 2005;309:1573–6. doi: 10.1126/science.1115079. [DOI] [PubMed] [Google Scholar]
- 20.Durand S, Cougot N, Mahuteau-Betzer F, Nguyen CH, Grierson DS, Bertrand E, et al. Inhibition of nonsense-mediated mRNA decay (NMD) by a new chemical molecule reveals the dynamic of NMD factors in P-bodies. J Cell Biol. 2007;178:1145–60. doi: 10.1083/jcb.200611086. [DOI] [PMC free article] [PubMed] [Google Scholar]
- 21.Pearson EC, Davies HG. A critical evaluation of Bernhard’s EDTA regressive staining technique for RNA. J Cell Sci. 1982;54:207–40. doi: 10.1242/jcs.54.1.207. [DOI] [PubMed] [Google Scholar]
- 22.Kremer JR, Mastronarde DN, McIntosh JR. Computer visualization of three-dimensional image data using IMOD. J Struct Biol. 1996;116:71–6. doi: 10.1006/jsbi.1996.0013. [DOI] [PubMed] [Google Scholar]
- 23.McEwen BF, Marko M. The emergence of electron tomography as an important tool for investigating cellular ultrastructure. J Histochem Cytochem. 2001;49:553–64. doi: 10.1177/002215540104900502. [DOI] [PubMed] [Google Scholar]
- 24.Pettersen EF, Goddard TD, Huang CC, Couch GS, Greenblatt DM, Meng EC, et al. UCSF Chimera--a visualization system for exploratory research and analysis. J Comput Chem. 2004;25:1605–12. doi: 10.1002/jcc.20084. [DOI] [PubMed] [Google Scholar]
- 25.Frangakis AS, Böhm J, Förster F, Nickell S, Nicastro D, Typke D, et al. Identification of macromolecular complexes in cryoelectron tomograms of phantom cells. Proc Natl Acad Sci USA. 2002;99:14153–8. doi: 10.1073/pnas.172520299. [DOI] [PMC free article] [PubMed] [Google Scholar]
- 26.Förster F, Hegerl R. Structure determination in situ by averaging of tomograms. Methods Cell Biol. 2007;79:741–67. doi: 10.1016/S0091-679X(06)79029-X. [DOI] [PubMed] [Google Scholar]
Associated Data
This section collects any data citations, data availability statements, or supplementary materials included in this article.


