Abstract
We experimentally demonstrate label-free photonic crystal (PC) microcavity biosensors in silicon-on-insulator (SOI) to detect the epithelial-mesenchymal transition (EMT) transcription factor, ZEB1, in minute volumes of sample. Multiplexed specific detection of ZEB1 in lysates from NCI-H358 lung cancer cells down to an estimated concentration of 2 cells per micro-liter is demonstrated. L13 photonic crystal microcavities, coupled to W1 photonic crystal waveguides, are employed in which resonances show high Q in the bio-ambient phosphate buffered saline (PBS). When the sensor surface is derivatized with a specific antibody, the binding of the corresponding antigen from a complex whole-cell lysate generates a change in refractive index in the vicinity of the photonic crystal microcavity, leading to a change in the resonance wavelength of the resonance modes of the photonic crystal microcavity. The shift in the resonance wavelength reveals the presence of the antigen. The sensor cavity has a surface area of ~11 μm2. Multiplexed sensors permit simultaneous detection of many binding interactions with specific immobilized antibodies from the same bio-sample at the same instant of time. Specificity was demonstrated using a sandwich assay which further amplifies the detection sensitivity at low concentrations. The device represents a proof-of-concept demonstration of label-free, high throughput, multiplexed detection of cancer cells with specificity and sensitivity on a silicon chip platform.
Keywords: photonic crystal microcavity, chip integrated biosensor, nanophotonic biosensor, lung cancer detection, sandwich assay, multiplexed label-free assay
1. Introduction
Detection of biomolecules on microarrays based upon label-free on-chip optical biosensors (Iqbal et al., 2012; Densmore et al., 2009; Sipova et al., 2010; Cunningham et al., 2004) is very attractive since this format avoids complex chemistries caused by steric hindrance of labels. In addition, chip-integrated technologies permit miniaturization contributing to the ultimate goal of personalized diagnostic assays for detecting toxins, allergens or biomarkers of disease, including cancer. Surface plasmon resonance (SPR) biosensors by Biacore (Sipova et al., 2010), and the Biomolecular Interaction Detector (BIND) platform (Cunningham et al., 2004) based on one-dimensional gratings in polymer substrates represent two technologies that have achieved commercial success. Devices based on two-dimensional photonic crystals in silicon (Lee et al., 2007; Zlatanovic et al., 2009; Lai et al., 2011; Lai et al., 2012; Chakravarty et al., 2012), have recently demonstrated the ability to confine and guide slow light on length scales of the wavelength of light leading to high sensitivity and miniaturization into compact sensors for chemical (Chakravarty et al., 2005) and bio-sensing (Lee et al., 2007; Zlatanovic et al., 2009; Lai et al., 2011; Lai et al., 2012; Chakravarty et al., 2012). A concern still remains regarding the specificity of the label-free interaction that is detected. Specificity can be established by a statistical determination based on the results from multiple sensor spots as well as via sandwich assays. We recently showed that multiple high sensitivity PC microcavity sensors can be arrayed on a chip and interrogated simultaneously by a single measurement. Using interconnecting on-chip waveguides, redundant measurements in multiple locations can be performed at the same instant of time (Zou et al., 2012). In this paper we present, to our knowledge, the first demonstration of multiplexed sandwich assay detection using the PC biosensor platform, combining simultaneous specific and control binding experiments for the detection of a biomarker from lung cancer cell lysates.
Primary lung cancer develops from epithelial cells lining the airways of the lung. Normally, these epithelial cells form a crucial barrier between the internal and external environments and in the lung, these cells prevent leakage of blood while assisting with exchange of O2 and CO2. Exposure to airborne particles and toxins, especially those found in cigarette smoke, leads to genetic changes in epithelial cells which accumulate and underlie progressive changes from hyperplasia and dysplasia to carcinoma in situ and frank cancer. As such tumors grow, they outstrip supplies of blood and oxygen, become stressed, and undergo the epithelial-mesenchymal transition (EMT), a process by which cells switch their epithelial gene expression patterns to a mesenchymal phenotype with increased migratory and invasive properties. This process is thought to underlie metastatic potential in many tumor types. A facile method for detection of the EMT state of tumor samples would have major importance both clinically and for basic science investigations. We and others have shown that ZEB1 and ZEB2 have a prominent role in controlling the EMT process in lung cancer (Gemmill et al., 2011; Takeyama et al., 2010). In this paper, we present proof-of-concept data that validate the ability of photonic crystal microcavity sensors to detect ZEB1 specifically via sandwich assays with high sensitivity.
2. Materials and Methods
2.1 Photonic Crystal Fabrication
The device is a photonic crystal (PC) microcavity coupled to a photonic crystal waveguide (PCW) in silicon on a silicon-on-insulator (SOI) substrate. The devices were fabricated using standard silicon wafer fabrication technologies in cleanroom facilities at the J.J. Pickle Research Center, Univ. of Texas, Austin. Precise methodologies for fabricating this type of device were described previously (Chakravarty et al., 2012)
2.2 Antibodies, coupling reagents and derivatization
We coupled the following antibodies or proteins to the PC resonance cavities; anti-MYC 9E10 (Sigma Aldrich, Cat #: A3833 MYC–tag 9E10), anti-ZEB1 (H102, Santa Cruz, Cat #: sc-25388), pre-immune mouse IgG (BD Pharmingen™, Mat. #: 557273), bovine serum albumin (Invitrogen, Cat #: 15561-020). Chemicals including 3-aminopropyl-triethoxy-silane (3-APTES) (Acros, CAS #:919-30-2) and glutaraldehyde (Fischer Scientific, CAS#111-30-8) were used to functionalize the silicon surface using published procedures (Zou et al., 2012; Chakravarty et al., 2012; Subramanian et al., 1999). Devices were routinely washed 3 times in PBS before measurements and after each addition of target lysate.
2.3 Lung Cancer Cell Line NCI-H358
The lung cancer cell line NCI- H358 was obtained from the Tissue Culture Core facility of the Univ. of Colorado Cancer Center, Aurora, CO. It was stably transfected with a tetracycline-inducible 6myc-ZEB1 expression construct, as described by (Gemmill et al., 2011).
3. Results and Discussions
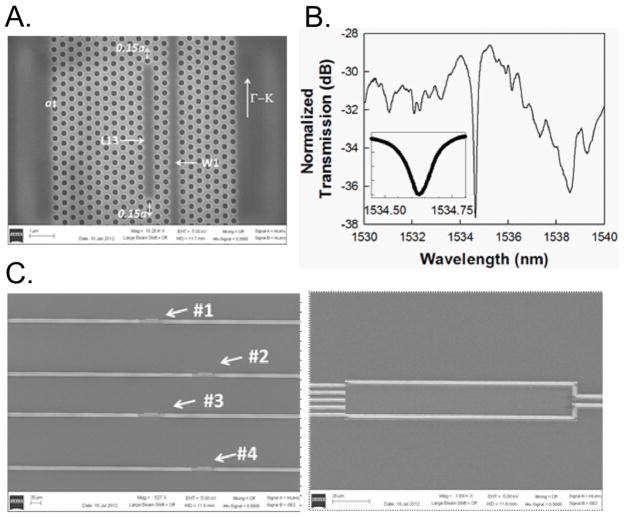
The PC waveguide (PCW) is a W1 line defect waveguide with uniform lattice constant a=400 nm, where W1 denotes that the width of the PCW is √3a. Silicon slab thickness and air hole diameter are h=0.58a (232 nm) and d=0.5775a (231 nm). Linear L13 PC microcavities with 13 missing holes along the Γ–K direction are fabricated two periods away from the PCW (Fig. 1A).
Fig. 1.
(A) Scanning electron micrograph (SEM) image showing L13 PC microcavity coupled to a W1 PC waveguide. (B) Fiber-to-fiber normalized experimental output transmission spectrum of W1 PCW in (A) showing band edge at 1538 nm and L13 PC microcavity resonance mode at 1534 nm. (inset) magnifies the resonance frequency range. (C) Multiplexed device showing the 1×4MMI (right) and the photonic crystal sensor regions (left) on each arm.
The edge air holes are shifted outward (Akahane et al., 2003) in the Γ–K direction by 0.15a (60 nm). A ~5–10 nm layer of silicon dioxide is functionalized to bind capture biomolecules to the device surface. For initial characterization, the silicon surfaces were functionalized and probe capture biomolecules were dispensed onto the PC microcavity. Details of the device simulation and fabrication have been published previously (Chakravarty et al., 2012).
Our PC microcavity sensor was designed considering that eventually the probe capture biomolecules would be dispensed by ink-jet printing. In ink-jet printing, the diameter of the ink-jet dispensed spot determines the minimum spacing between adjacent unique sensors, not the size of the sensor (Lai et al., 2012). This spot is approximately 35 μm and thus permits device densities as high as one every 50 μm.
Resonances in L13 PC microcavities such as the high quality factor (Q) ~26,760 in SOI structures (Lai et al., 2012) have been characterized previously. We experimentally demonstrated bio-sensing sensitivity down to 0.67 nanograms/ml, surface mass sensitivity of 0.8 picograms/mm2 on a sensing surface area of 11 μm2, (Chakravarty et al., 2012) that compares extremely favorably with 1 pg/mm2 sensitivity in SPR devices (Sipova et al., 2010).
Counter to current trends in photonic crystal sensor research, we designed PC microcavities slightly larger than the L3-type because of the physical advantages of higher Q possible in longer PC microcavities resulting from a larger mode volume with the combined effects of lower radiation loss and higher stored energy. In addition, our design achieves higher sensitivity because of the larger optical mode volume of the resonance cavity, a feature enabling more overlap with analytes that fill the 216 nm holes and coat the silicon surface. Highest sensitivity (Chakravarty et al., 2012) was achieved in silicon-on-insulator (SOI) structures at a biomolecule analyte concentration of 0.1 μg/ml.
A typical transmission spectrum of the W1 PCW device immersed in phosphate buffered saline (PBS) is shown in Fig. 1B. The coupled L13 PC microcavity device was covered with a representative probe capture antibody. The experimentally confirmed Q-factor in SOI is approximately 13,000, obtained as λ/Δλ from the inset. In a multiplexed design, four L13 PC microcavities are arrayed on the four arms of a multimode interference (MMI) power splitter for simultaneous detection, as shown in Fig. 1C, (Zou et al., 2012).
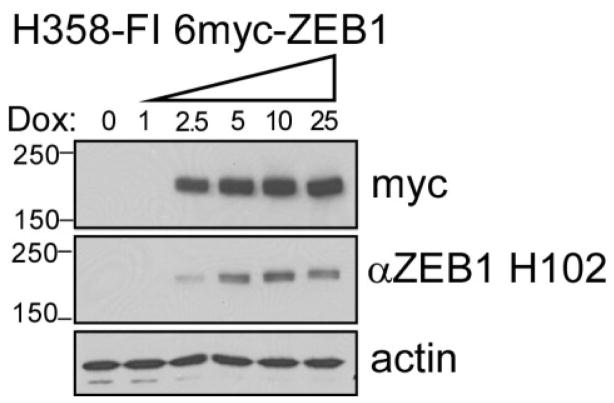
In H358-ZEB1 lung cancer cells, expression of the ZEB1 gene was controlled with the tetraycycline derivative, doxycycline. Exogenous ZEB1 (MW = ~180 kDa) was tagged at the N-terminus with 6 copies of the MYC epitope, permitting recognition by the anti-myc antibody, 9E10. Samples were prepared from these cells prior to induction (0-day lysate) or after 3 days dox treatment to induce 6myc-ZEB1 (3-day lysate). Exogenous 6myc-ZEB1 present in the induced lysates can be detected using either the 9E10 antibody or an antibody that binds to native ZEB1 (Fig. 2).
Fig. 2.
Western blot analysis of doxycycline-induced 6-myc-ZEB1 expressed in NCI-H358 cells. Cultures were treated for 3 days prior to harvest with increasing doses of dox (ng/ml), as indicated. Protein lysates (10 μg/lane) were electrophoretically separated on 4–15% gradient SDS-PAGE gels and resulting blots were probed with 9E10 to detect the 6-myc tag and H102 to detect ZEB1 epitopes. Actin demonstrated equal loading.
This analysis verified that ZEB1 was strongly expressed in the dox-induced lysate (3d dox), was absent from the control lysate (0 dox), and that both antibodies are highly specific for ZEB1.
Anti-ZEB1 antibodies diluted 1:1000 in PBS and mixed with 35% glycerol in PBS were printed onto the functionalized PC microcavity and incubated overnight at 4°C. After printing, the device was washed 3× with PBS, coated in BSA to block non-specific binding and re-washed 3× with PBS.
Devices were tested with TE-polarized light. Target lysates were introduced in PBS which forms the top cladding. When ZEB1-positive lysates bind to anti-ZEB1 antibodies attached to the PC microcavity, a change in the refractive index causes an alteration in the resonance frequency and a shift in wavelength of the dropped resonance from the PCW’s transmission spectrum. The magnitude of the shift is precisely correlated with the concentration of ZEB1 in the lysates.
Sensitivity analysis of individual L13 PC microcavities was performed first by analyzing its resonance spectrum in PBS after functionalization with anti-ZEB1 capture antibody. Target samples were then introduced sequentially. These consisted of 3-day induced lysates (nominally containing 10,000 cells per μL), variously diluted with PBS. After addition of diluted lysate, the resonance wavelength (λ1) was monitored as a function of time. No resonance wavelength shift could be observed during the first 20 min, after which it increased as a function of time until saturation was achieved by 40 min (λ2). The chip was PBS washed 3× to remove unbound biomolecules and the post-wash resonance wavelength λ3 (< λ2) was measured. The final shift (Δλ) is plotted in Fig. 3, and given by Δλ=λ3−λ1. A similar diffusion limited time-dependence of binding has been observed in previous measurements (Zou et al., 2012; Chakravarty et al., 2012; Subramanian et al., 1999). Similar measurements were obtained from a control PC microcavity derivatized with BSA.
Fig. 3.
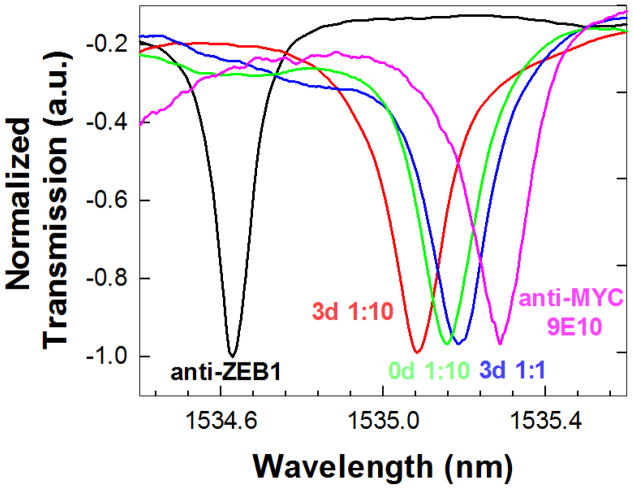
Experimental transmission spectra as a function of added sample type/concentration. The respective sample legends are color coded according to the color of the experimental spectrum. The baseline transmission spectrum with probe capture anti-ZEB1 in PBS is indicated in black.
Fig. 3 plots the transmission spectra observed when 60 μL of variously diluted 3-day induced lysates were added. A resonance wavelength shift from the anti-ZEB1 baseline (@ 1534.6 nm, black trace) was observed when the 3-day lysate (diluted 1:10) was added (red trace). A further shift was observed when 1:1 diluted 3-day lysate was added (blue trace). Subsequent introduction of the 1:10 diluted 0-day lysate (which contains no detectable ZEB1) caused a small negative shift (green trace). This negative shift was within the range of wavelength accuracy of our optical spectrum analyzer and also the range of error observed from our control experiment. This result is consistent with the absence of any additional binding interaction from proteins in the 0-day induced lysate.
For confirmation that the resonance shift was specific for ZEB1 in the 3-day lysate, and not the result of non-specific interactions, a second antibody (anti-MYC 9E10, diluted 1:1000 in PBS) was introduced. The anti-MYC antibody was expected to bind the MYC-epitope tag attached to ZEB1 in the 3-day lysates. A secondary resonance wavelength shift was observed with anti-MYC, as shown by the pink trace in Fig. 3. The specificity of binding was thus confirmed by these sandwich assay measurements. The resonance wavelength shift observed over the entire sequence of sample additions for the BSA-coated control PC microcavity was within 0.02 nm, which establishes the error margin of our device.
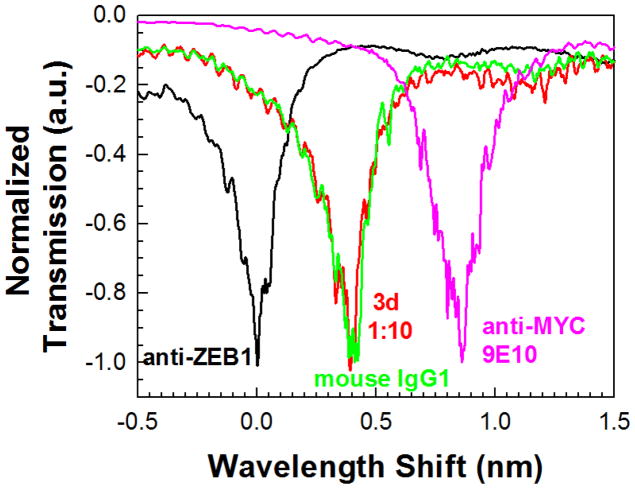
Immunoglobulins can bind other proteins (e.g., complement) in addition to the antigenic molecules recognized by hypervariable antigen binding sites. Thus it was possible that the resonance supershift observed in Fig. 3 could have resulted from non-specific interactions of anti-MYC antibody with background proteins on the biosensor surface. To rule this out, the resonance shift caused by isotype-matched control antibody was measured, as shown in Fig. 4. After establishing the baseline resonance spectrum for an L13 PC microcavity coated with anti-ZEB1 (black trace), the 3-day ZEB1 lysate (diluted 1:10) was added. A resonance wavelength shift of ~0.4 nm was detected (red trace), comparable to the shift observed in Fig. 3. Addition of the isotype-matched mouse IgG1 control antibody (green trace, diluted 1:10 in PBS) failed to elicit a resonance wavelength shift. However, subsequent addition of anti-MYC 9E10 antibody (1:1000 in PBS) generated a secondary shift of 0.5 nm (pink trace). These observations demonstrate that the resonance supershift resulted from 9E10 antibody binding to myc-tagged ZEB1 and was not confounded by non-specific background interactions.
Fig. 4.
Experimental transmission spectra as a function of added sample. Sample legends are color coded according to the color of the experimental spectrum. The baseline transmission spectrum with probe capture anti-ZEB1 in PBS is indicated in black. The isotype matched contol mouse IgG1 is in green.
Fig. 5 plots the resonance wavelength shifts as a function of concentration or type of target sample solution. To further characterize sensitivity, the probe capture and second antibodies were switched and the resonant wavelength shifts plotted again as a function of concentration. A larger wavelength shift was observed in each case upon addition of the 3-day lysate (diluted in PBS to different concentrations), when the primary probe capture antibody bound to the silicon surface was anti-MYC 9E10 versus when the primary probe capture antibody was anti-ZEB1, as in Fig. 3. Similar higher sensitivities were observed in Western blot studies when anti-MYC 9E10 was used as the primary antibody instead of anti-ZEB1 (Fig. 2). We note that BSA failed to elicit detectable resonance shifts with any of the lysates tested, further supporting the specificity of the PC biosensor. The response of the biosensors is reproducible, the relative standard deviation (RSD) being 6.5% at the lysate concentration 3d 1:10 for n=2 across different chips with 230 nm silicon device layer in SOI.
Fig. 5.
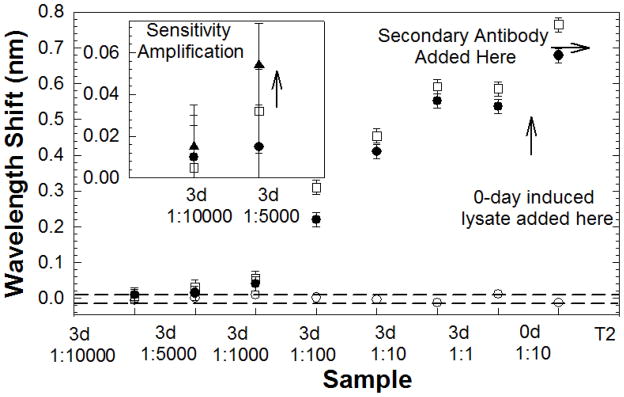
L13 PC microcavity resonance wavelength shift as a function of concentration with anti-ZEB1 primary probe capture (filled circles) and anti-MYC 9E10 primary probe capture (open squares) antibodies. The secondary antibody T2 is anti-MYC 9E10 and anti-ZEB1 respectively for data plotted with filled circles and open squares. Control BSA coated L13 PC microcavity resonance as a function of position is plotted with open circles. (inset) Sandwich assay experiment at lowest concentration enables binding specificity verification and sensitivity amplification. Secondary anti-ZEB1 induced resonance shift indicated by filled triangles.
The dashed lines indicate the wavelength shifts observed in the control experiment with BSA. Since no wavelength shifts should be theoretically observed in the control experiment, the boundaries indicated by the dashed lines represent the error margins in our measurement. Since the samples were added one after another in Fig. 5, the dashed lines in essence also represent the wavelength shift error margins as a function of time. The wavelength accuracy of the optical spectrum analyzer (Ando AQ6317B) of 0.02 nm determines the measurement error margin for any resonance wavelength, as shown in Fig. 5.
In the L13 PC microcavity (Chakravarty et al., 2012), the optical mode overlaps a surface area on the chip of 11 μm2. The dispensed 60 μl probe lysate occupies a circular area with diameter 8 mm. Hence, a significant fraction of the dispensed lysates are washed away and thus do not contribute to detection. The probe lysates were prepared from approximately 10,000 NCI-H358 cells per microliter of buffer. A 60 μl aliquot of 1:1000 diluted 3-day lysate yielded a wavelength shift of 0.07 nm. By ratio, our device detected target ZEB1 proteins in lysates equivalent to 10 NCI-H358 cells per μl. At the lowest concentration of 1:10,000, the wavelength shift observed was within the range of wavelength accuracy of our OSA, indicated by the dashed line in Fig. 5 and the device was considered unresponsive to this dilution.
The sandwich assay technique offers the potential to further amplify the resonance wavelength shift for small concentrations. Anti-ZEB1 and anti-MYC 9E10 antibodies recognize different epitopes of the induced ZEB1 in NCI-H358 cell lysates, but do not bind to each other. We functionalized a device using anti-MYC 9E10 as the capture antibody and added 1:5,000 diluted 3-day lysate. A resonance wavelength shift of 0.032 nm was observed upon lysate binding to primary anti-MYC 9E10 antibody with an additional wavelength shift when the second anti-ZEB1 antibody was added. An additional resonance wavelength shift of 0.022 nm was thus observed, amplified from 0.032 nm, to a total shift of 0.055 nm as observed in Fig. 5 inset. When the same measurement was done with the 3-day 1:10,000 dilution, the total resonance wavelength shift was 0.015 nm which is within the range of wavelength error 0.02 nm of our measurements. The two concentrations of 1:10,000 and 1:5,000 correspond to 1 cell and 2 cells per micro-liter respectively.
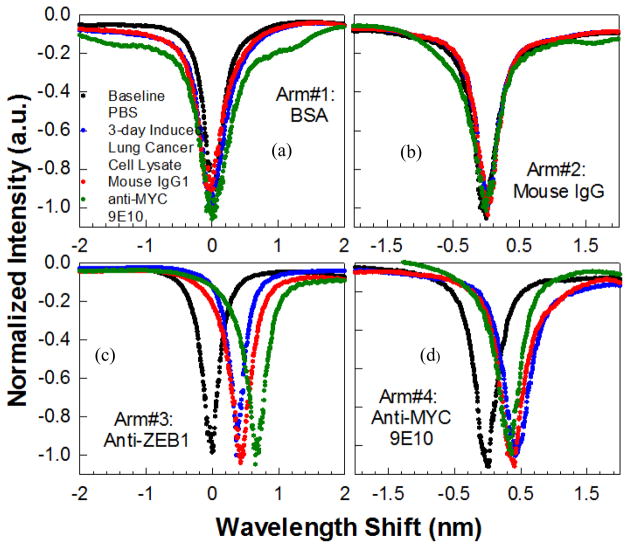
The specificity and sensitivity demonstrated by separate binding interactions with specific antibodies and non-binding with control antibodies was next demonstrated simultaneously by multiplexing PC microcavities in a MMI power splitter. The arms of the MMI in Fig. 1C were labeled 1, 2, 3 and 4 and derivatized with BSA, isotype-matched control mouse IgG1, anti-ZEB1 and anti-MYC 9E10, respectively. All arms of the MMI were excited by input light with simultaneous measurements made from the four output arms. Fig. 6 (a)-(d) shows the results of wavelength shifts observed upon sequential additions of the 3-day induced cell lysate diluted 1:10 (equivalent to 1000 cells per micro-liter), the isotype matched control IgG1 followed by the secondary antibody anti-MYC 9E10. Specific binding was only observed on arms #3 and #4 while no wavelength shifts were observed on control arms #1 and #2. The binding specificity was confirmed on arm #3 by the additional resonance wavelength shift upon introduction of the secondary antibody anti-MYC 9E10. The multiplexed negative control experiments and the duplicate specific shifts observed in arms #3 and #4 thus validate the specificity of the binding interactions detected by the PC.
Fig. 6.
Multiplexed simultaneous specific detection of ZEB1 in lung cancer cell lysates with four arms of the MMI derivatized with (a) bovine serum albumin (b) isotype matched control mouse IgG1 (c) anti-ZEB1 antibody and (d) anti-MYC 9E10 antibody. Baseline spectra for each arm is shown in black. Resonance wavelength positions shown in red, blue, green respectively with sequential addition of 3-day induced (1:10) lung cancer cell lysates, mouse IgG1 and anti-MYC 9E10, respectively
The PC device comprising the L13 PC microcavity coupled to the W1 PC waveguide, with the sandwich assay, thus demonstrated the capability to specifically detect ZEB1 in 2 cells per microliter of induced NCI-H358 cell lysates. Specificity was further established by multiplexing the binding and negative control antibodies, allowing simultaneous measurements of the same sample in the same instant of time.
In some respects, the biomarkers used to demonstrate the sandwich assay technique in the proof-of-concept experiments here may be considered as a type of labeling, since we have incorporated a MYC epitope which can be recognized by the anti-MYC antibody 9E10 in Western Blot tests. However, unlike sandwich ELISA methods, in which enzyme-linked antibodies are required to bind the detection antibody (secondary antibody as defined here) for signal generation, no such requirement exists in our method. Users can simply design biomarker detection assays using a primary antibody and one to several second antibodies that recognize different specific epitopes of the target protein; in all cases, signal detection is performed by the photonic crystal.
Such biomarkers are available and will be studied in the future for lung cancer detection (Choi et al., 2012; Takenaka et al., 2011; Tretiakova et al., 2011; Pesta et al., 2011; Lee et al., 2012; Tong et al., 2012; Ohira et al., 2003). Physical methods to further increase PC microcavity sensitivity are being investigated including optimization of PC microcavity length, the slow light effect in coupled PC waveguides and PC microcavity resonance mode quality factors (Chakravarty et al., 2012; Lai et al., 2012). The sandwich assay demonstrated here provides a biochemical means to enhance the sensitivity in these hybrid nano-structures.
Our device has detected a single protein out of a very complex mixture containing more than 20, 000 to 50,000 proteins derived from a whole cell lysate of a lung cancer cell line. While not the same as patient tumor samples, a whole cell lysate will contain a major fraction of the complexity anticipated in tumor biopsies, and therefore provides a reasonable model for these proof-of-principle experiments.
4. Conclusions
In summary, we have demonstrated experimentally the specific detection of a relevant cancer-associated protein in lung cancer cell lysates with sensitivity down to 2 cells per micro-liter using PC microcavity biosensors in SOI devices. Specific detection at low concentrations and signal amplification were achieved by the sandwich assay principle. To our knowledge, this is the first demonstration of multiplexed detection of a specific protein from such complex mixtures in a label-free two-dimensional silicon PC platform. The combination of multiplexed resonance cavities with simultaneous detection permits duplicate or triplicate analyses in the same measurement for statistical confidence. Thus by combining multiplexing capability with sensitivity and specificity, our device provides a significant advantage over existing technologies for development of personalized diagnostic assays.
Acknowledgments
The authors acknowledge the National Cancer Institute for supporting this work under the Small Business Innovation Research (SBIR) program (Contract # HHSN261201000085C). HAD and RMG were supported by an NCI-sponsored SPORE CA58187. WCL, YZ and RTC also acknowledge support from AFOSR MURI (Contract # FA9550-08-1-0394).
Footnotes
Publisher's Disclaimer: This is a PDF file of an unedited manuscript that has been accepted for publication. As a service to our customers we are providing this early version of the manuscript. The manuscript will undergo copyediting, typesetting, and review of the resulting proof before it is published in its final citable form. Please note that during the production process errors may be discovered which could affect the content, and all legal disclaimers that apply to the journal pertain.
References
- Akahane Y, Asano T, Song BS, Noda S. Nature. 2003;425:944–947. doi: 10.1038/nature02063. [DOI] [PubMed] [Google Scholar]
- Chakravarty S, Topol’ančik J, Bhattacharya P, Chakrabarti S, Kang Y, Meyerhoff ME. Opt Lett. 2005;30:2578–2580. doi: 10.1364/ol.30.002578. [DOI] [PubMed] [Google Scholar]
- Chakravarty S, Zou Y, Lai WC, Chen RT. Biosensors and Bioelectron. 2012;38(1):170–176. doi: 10.1016/j.bios.2012.05.016. [DOI] [PMC free article] [PubMed] [Google Scholar]
- Choi CM, Yang SC, Jo HJ, Song SY, Jeon YJ, Jang TW, Kim DJ, Jang SH, Yang SH, Kim YD, Lee KH, Jang SJ, Kim YT, Kim DK, Chung DH, Kim L, Nam HS, Cho JH, Kim HJ, Ryu JS. Ann Oncol. 2012;23:2088–2093. doi: 10.1093/annonc/mdr606. [DOI] [PubMed] [Google Scholar]
- Cunningham BT, Li P, Schulz S, Lin B, Baird C, Gerstenmaier J, Genick C, Wang F, Fine E, Laing LJ. Biomolecular Screening. 2004;9(6):481–490. doi: 10.1177/1087057104267604. [DOI] [PubMed] [Google Scholar]
- Densmore A, Vachon M, Xu DX, Janz S, Ma R, Li YH, Lopinski G, Delage A, Lapointe J, Luebbert CC, Liu QY, Cheben P, Schmid JH. Optics Lett. 2009;34:3598–3600. doi: 10.1364/OL.34.003598. [DOI] [PubMed] [Google Scholar]
- Gemmill RM, Roche J, Potiron VA, Nasarre P, Mitas M, Coldren CD, Helfrich BA, Garrrett-Mayer E, Bunn PA, Drabkin HA. Cancer Lett. 2011;300(1):66–78. doi: 10.1016/j.canlet.2010.09.007. [DOI] [PMC free article] [PubMed] [Google Scholar]
- Iqbal M, Gleeson MA, Spaugh B, Tybor F, Gunn WG, Hochberg M, Baehr-Jones T, Bailey RC, Gunn LC. IEEE J Sel Top Quant Electron. 2010;16:654–661. [Google Scholar]
- Lai WC, Chakravarty S, Wang X, Lin CY, Chen RT. Appl Phys Lett. 2011;98 (2):023304–0223306. [Google Scholar]
- Lai WC, Chakravarty S, Zou Y, Chen RT. Optics Lett. 2012;37(8):1208–1210. doi: 10.1364/OL.37.001208. [DOI] [PMC free article] [PubMed] [Google Scholar]
- Lee HJ, Kim YT, Park PJ, Shin YS, Kang KN, Kim Y, Kim CW. J Thorac Cardiovasc Surg. 2012;143:421–427. doi: 10.1016/j.jtcvs.2011.10.046. [DOI] [PubMed] [Google Scholar]
- Lee M, Fauchet PM. Opt Express. 2007;15:4530–4535. doi: 10.1364/oe.15.004530. [DOI] [PubMed] [Google Scholar]
- Ohira T, Gemmill RM, Ferguson K, Kusy S, Roche J, Brambilla E, Zeng C, Baron A, Bemis L, Erickson P, Wilder E, Rustgi A, Kitajewski J, Gabrielson E, Bremnes R, Franklin W, Drabkin HA. Proceedings of the National Academy of Sciences of the United States of America. 2003;100:10429–10434. doi: 10.1073/pnas.1734137100. [DOI] [PMC free article] [PubMed] [Google Scholar]
- Pesta M, Kulda V, Kucera R, Pesek M, Vrzalova J, Liska V, Pecen L, Treska V, Safranek J, Prazakova M, Vycital O, Bruha J, Holubec L, Topolan O. Anticancer Res. 2011;31 (11):4031–4038. [PubMed] [Google Scholar]
- Sipova H, Zhang S, Dudley AM, Galas D, Wang K, Homola J. Anal Chem. 2010;82:10110–10115. doi: 10.1021/ac102131s. [DOI] [PMC free article] [PubMed] [Google Scholar]
- Subramanian A, Kennel SJ, Oden PI, Jacobson KB, Woodward J, Doktycz MJ. Enzyme and Microbial Technology. 1999;24:26–34. [Google Scholar]
- Takenaka M, Hanagiri T, Shinohara S, Kuwata T, Chikaishi Y, Oka S, Shigematsu Y, Nagata Y, Shimokawa H, Nakagawa M, Uramoto H, So T, Tanaka F. Anticancer Res. 2012;31:4631–4636. [PubMed] [Google Scholar]
- Takeyama Y, Sato M, Horio M, Hase T, Yoshida K, Yokoyama T, Nakashima H, Hashimoto N, Sekido Y, Gazdar AF, Minna JD, Kondo M, Hasegawa Y. Cancer Lett. 2010;296 (2):216–224. doi: 10.1016/j.canlet.2010.04.008. [DOI] [PMC free article] [PubMed] [Google Scholar]
- Tong BC, Harpole DH., Jr Surg Oncol Clin N Am. 2012;21:161–175. doi: 10.1016/j.soc.2011.09.007. [DOI] [PubMed] [Google Scholar]
- Tretiakova M, Salama AK, Karrison T, Ferguson MK, Husain AN, Vokes EE, Salgia R. J Environ Pathol Toxicol Oncol. 2011;30:341–354. doi: 10.1615/jenvironpatholtoxicoloncol.v30.i4.70. [DOI] [PubMed] [Google Scholar]
- Zlatanovic S, Mirkarimi LW, Sigalas MM, Bynum MA, Chow E, Robotti KM, Burr GW, Esener S, Grot A. Sens and Actuators B. 2009;141:13–19. [Google Scholar]
- Zou Y, Chakravarty S, Lai WC, Lin CY, Chen RT. Lab Chip. 2012;12:2309–2312. doi: 10.1039/c2lc40081b. [DOI] [PMC free article] [PubMed] [Google Scholar]


