

Abstract
OBJECTIVE
To assess older adults’ attitudes toward eliciting health outcome priorities.
METHODS
This observational cohort study of 356 community-living adults age ≥ 65 included three tools: 1) Health Outcomes: ranking four outcomes (survival, function, freedom from pain, and freedom from other symptoms); 2) Now vs. Later: rating importance of current versus future quality of life; 3) Attitude Scale: agreement with statements about health outcomes and current versus future health.
RESULTS
Whereas 41% preferred Health Outcomes, 40% preferred the Attitude Scale. Only 7–12% rated any tool as very hard or hard. In bivariate analysis, participants of non-white race and with lower education, health literacy, and functional status were significantly more likely to rate at least one of the tools as easy (p<0.05). Across all tools, 17% of participants believed tools would change care. The main reason for thinking there would be no change was satisfaction with existing care (62%).
CONCLUSIONS
There is variability in how older persons wish to be asked about health outcome priorities. Few find this task difficult, and difficulty was not greater among participants with lower health literacy, education, or health status.
PRACTICE IMPLICATIONS
By offering different tools, healthcare providers can help patients clarify their health outcome priorities.
Keywords: Health priorities, organization and administration, decision-making, goals, patient participation
1. Introduction
Older persons with multiple medical conditions often face treatment decisions with competing outcomes. Interventions with benefits for one health domain may cause harm in another [1–4]. For example, medications for primary and secondary prevention reduce the risk of individual disease-specific outcomes, but the resulting polypharmacy increases the risk of adverse drug events, balance problems, and weight loss [5]. When faced with competing outcomes, patients’ preferences need to guide the decision-making process [3, 6]. However, the most effective method to elicit treatment preferences in this population is unclear.
One approach to the elicitation of preferences for persons with multiple conditions is to have them prioritize health outcomes that are applicable across diseases, or universal health outcomes [7]. This approach asks persons to think about which outcomes, encompassing such domains physical and cognitive functioning and life extension, are most important to them both currently and in the future. We refer to this process as “health outcome prioritization.” Although several elicitation methods exist for this approach, including decision analytic approaches and multi-attribute theory [8, 9], these methods are generally complex, may not be easily understood by older persons [10], and have not been widely adopted in clinical practice.
Developing a tool to elicit treatment preferences requires that the measure be easily understood by and acceptable to patients. Previous research has shown considerable variability in older adults’ desired level of involvement in decision-making, or whether they want to be asked. This includes differences in being asked their opinion and their role in making a final treatment decision [11]. However, much less is known about what types of decision-making tools older adults prefer to use, or how they want to be asked. Preference for a tool’s fundamental design should be considered, especially given the limited data on what approach is most easily understood and clinically useful for health outcome prioritization. Furthermore, designing tools that recognize patients’ feelings about ease of use and expectations for impacting medical care can help anticipate barriers to fuller patient engagement. This type of information is especially important since even when patients desire to be involved in decision-making, they often do not feel empowered to do so [12].
This exploratory study examines older persons’ attitudes toward three different tools to eliciting universal health outcomes. These tools were designed to explore a range of approaches to health outcome prioritization by utilizing both single-item and multi-item questions and different response categories. The main objectives are to assess: 1) participants’ preferences for and difficulty with different approaches; 2) relationships between attitudes and sociodemographic and health characteristics; and 3) participants’ views of the tools’ potential for changing physician care.
2. Methods
2.1. Participants
Three hundred and fifty six persons age 65 and older were recruited for the study from locations selected in order to obtain a socioeconomically and racially diverse population. These included one senior center in an urban, predominately African American community; two senior centers in suburban, predominately white communities; and an independent/assisted living facility with market-rate and subsidized apartments. Participants were solicited by the investigators at events including flu clinics, exercise classes, congregate meals, discussion groups, and presentations. Volunteers did not receive any reimbursement for participation. Exclusion criteria included primary language other than English and, for participants recruited from the housing facility, a diagnosis of dementia provided by the facility social worker. One participant who did not complete the interview was excluded from analysis. The study protocol was approved by the Human Investigation Committee of the Yale School of Medicine.
2.2. Measurements
Participants completed the questionnaire and health outcome prioritization tools with a trained research associate in a face-to-face interview. The research associate used electronic tablets to display the two tools using visual analogue scales (VAS) and enter responses.
The questionnaire collected self-reported information on sociodemographic and health characteristics including gender; race; age; education; health literacy using the seven-item REALM-Short Form (REALM-SF) [13]; finances; religion; chronic conditions; functional status based on instrumental activities of daily living (IADLs) [14]; single-item self-rated health and global quality of life (QOL); and depression using the two-item PRIME MD [15].
The tools used for health outcome prioritization address two types of tradeoffs: 1) among different health outcome domains, including between quantity and quality of life, and 2) between current and future health. These tradeoffs stretch across diagnostic labels and are at the core of many treatment decisions, whether addressing primary or tertiary prevention. Furthermore, focus groups suggest that older adults do conceptualize outcomes in this global manner when making treatment decisions [16]. In the absence of prior data on how to best facilitate older persons expressing their health outcome priorities, we developed different types of tools in order to compare their relative ease of use and acceptability. Two of the tools asked participants to do a single-item task, with each task addressing one of the two types of tradeoffs. These tools were based on visual analogue scales (VAS) as the response category. The third tool consisted of two multi-item subscales, one addressing each type of trade-off, with responses based on Likert scaling. We describe each of the scales in greater detail below.
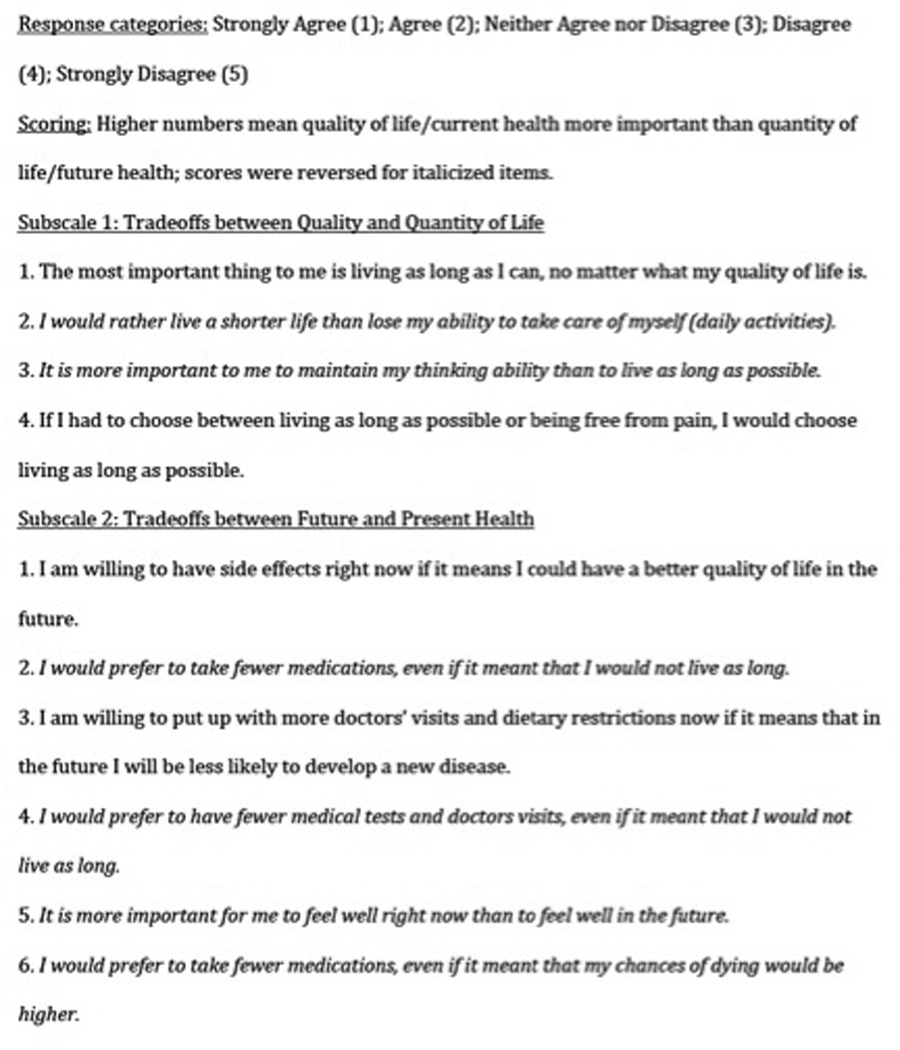
The Attitude Scale is composed of a series of statements with which participants are asked to rate the strength of their agreement (Figure 1). The statements are grouped into two subscales, with one representing each of the two tradeoffs. The health outcome domain subscale includes four statements, for example: “I would rather live a shorter life than lose my ability to take care of myself (daily activities).” The current versus future health subscale includes six statements, for example, “I am willing to have side effects right now if it means I could have a better quality of life in the future”. The Now vs. Later tool asks participants to assess the relative importance of quality of life now, versus at one year and at five years in the future on a VAS (Figure 2). Participants moved a bar along a 100-point horizontal axis, anchored by “quality of life now” at one end and “quality of life 1(5) years from now” at the other. The Health Outcomes tool asks participants to rate the relative importance of four universal health outcomes (survival, function, freedom from pain, and freedom from other symptoms) on a vertical VAS from 0 to 100 (Figure 3). It has previously been piloted with older adults [17].
Figure 1.
Attitude scale: Quantity vs. quality of life
Figure 2.

Now vs. later item
Figure 3.

Health outcomes item
After using each of the tools, participants were given a series of questions. To assess difficulty, participants were asked, “How difficult were these questions?” with a five-point Likert response scale ranging from “very easy” to “very difficult,” followed by an open-ended “Why?” question. Participants were then asked, “Do you think this tool would change the way your physician cares for you?” with response categories of “yes,” “no,” or “don’t know,” again followed by a “Why?” question for an open-ended response. Finally, participants were asked, “Of the 3 exercises which one did you like best?” after using all three tools.
2.3. Analysis
Participant characteristics were described using univariate statistics. Relationships between participants’ preferred tool and health and sociodemographic characteristics were analyzed in bivariate analysis, using the chi-square test.
Qualitative data from the two open-ended questions on difficulty and changing care were coded using content analysis, to create a taxonomy suitable for quantitative analysis [18]. Codes were generated inductively, using repeated rounds of coding to generate and refine taxonomy. Each response received a single code from the primary coding category to facilitate subsequent analysis. Codes were assigned hierarchically when a single answer contained more than one idea, with the goal of selecting the participants’ most specific critical or negative comment about the tools. The hierarchy included coding difficulty over ease, comments related to specific aspects of the tools over comments related to the more general task of prioritization, and the most detailed categorization possible. A secondary code category was developed for concepts that were not the primary focus of a comment and occurred infrequently, but represented strong emotional and religious responses of individual participants to the content of the tools. Because the secondary codes were infrequent, they were analyzed as number of responses rather than proportions. To assess coding reliability, two investigators independently coded a 10 percent sample of responses, compared and discussed results, and repeated this process until reaching greater than 80 percent agreement for each of the difficulty and changing care responses. A single researcher coded the remaining responses.
Qualitative difficulty codes were organized into a three-point scale of Easy, Neutral, and Difficult. To facilitate comparison with the quantitative difficulty ratings, the quantitative difficulty scale was collapsed into “Easy/Very Easy”, “Moderately Hard,” and “Hard/Very Hard.” Correlation between these scales was assessed using the Spearman correlation coefficient. Differences in quantitative and qualitative difficulty among the three tools were assessed using a chi-squared test.
Relationships between difficulty ratings and participant characteristics were examined in bivariate and multivariate analyses. For this last set of analyses, the qualitative difficulty ratings were used because the qualitative codes provided a more comprehensive assessment of participants’ attitudes. For example, qualitative codes could draw distinctions between the tool being conceptually difficult to understand (assigned a rating of “difficult”) and the tool being clear but still requiring thoughtfulness (assigned a rating of “neutral”).
3. Results
3.1. Participant Characteristics
Table 1 shows sociodemographic and health characteristics of the three-hundred fifty six study participants. The sample was three quarters female and white, with high education and health literacy, as well as high self-rated health and QOL. The majority was also financially stable (64%) and considered themselves to be deeply or fairly religious (82%). A majority had four or more chronic conditions (69%), and over one quarter had one or more IADLs (26%) and had experienced depression in the past month (28%).
Table 1.
Participant demographic and health characteristics (N=357)
| Female (%) | 75 |
| Age (Mean ± SD) | 76 ± 7 |
| White (%) | 75 |
| Education (Mean ± SD) | 13 ± 2 |
| Health Literacy (REALM-SF) (%) | |
| ≤3rd Grade | 1 |
| 4th–6th Grade | 3 |
| 7th–8th Grade | 21 |
| ≥9th Grade | 75 |
| Finances at End of Month (%) | |
| Some Money Left | 64 |
| Just Enough | 28 |
| Not Enough | 8 |
| Religiosity (%) | |
| Deeply Religious | 27 |
| Fairly Religious | 55 |
| Slightly/Not At All Religious/Against | |
| Religion | 17 |
| Chronic Conditions (%) | |
| 0–3 | 31 |
| 4–6 | 43 |
| >6 | 26 |
| 1+ IADL Disabilities (%) | 26 |
| Self-Rated Health (%) | |
| Excellent/Very Good | 44 |
| Good | 41 |
| Fair/Poor | 15 |
| Quality of Life (QOL) (%) | |
| Best Possible | 31 |
| Good | 59 |
| Fair/Poor | 10 |
| Depression in past month (%) | 28 |
3.2. Tool Preferences
Approximately equal proportions of participants preferred the Attitude Scale (40%) and Health Outcomes item (41%), with a much smaller proportion preferring the Now vs. Later item (12%). Only eight percent did not have a preferred tool, preferred none, or refused the question. Of all of the sociodemographic and health characteristics examined, only race was associated with participants’ preferred tool. Thirty-eight percent of white participants preferred the Attitude Scale versus 44 percent of non-whites, 39 percent of whites preferred the Health Outcomes compared to 46 percent of non-whites, and 14 percent of whites preferred either the Now vs. Later item or had no preference, compared to 10 percent of non-whites (p=0.03).
3.3. Difficulty
Quantitative difficulty ratings varied significantly across the health outcome tools, with the largest proportion of participants rating the Now vs. Later tool as Very Easy/Easy (Table 2). Only small proportions of participants (7–12%) rated any of the tools as very hard or hard.
Table 2.
Quantitative and qualitative difficulty scale ratings for the three health outcome prioritization tools
| Attitude Scale (%) |
Now vs. Later (%) |
Health Outcomes (%) |
P Value | |
|---|---|---|---|---|
| Quantitative Difficulty | ||||
| Very Easy/Easy | 38 | 63 | 52 | <0.0001 |
| Moderately Hard | 54 | 30 | 36 | |
| Hard/Very Hard | 8 | 7 | 12 | |
| Qualitative Difficulty | ||||
| Easy | 18 | 9 | 8 | <0.0001 |
| Neutral | 27 | 65 | 61 | |
| Difficult | 56 | 26 | 32 |
Percentages may not add up to 100 due to rounding.
Participants’ qualitative difficulty responses fell into two primary categories (Table 3). We assigned the category of “Structure” when the participant referred to the particular wording and configuration of the tool, and of “Content” when the participant referred to the concept of preferences or the general experience of prioritizing health outcomes. We assigned three specific codes within the “Structure” category: “Confusion,” “Specificity,” and “Clarity and Ease.” “Confusion” referred to any mention of the tool wording or structure that was difficult. “Specificity” referred to a more specific mention that the tool lacked information desired by the participant. In contrast, “Clarity and Ease” included references to the tool wording or structure being clear, simple, or easy to understand. We assigned four specific codes within the “Concept” category: “Challenge,” “Projection,” “Prior Thought,” and “Thought.” “Challenge” applied to general comments that the concepts in the tool were challenging to answer. Comments specifically about the difficulty of evaluating a hypothetical situation, because the participant had not experienced a given outcome, were coded as “Projection.” “Prior Thought” was assigned to responses referring to familiarity with the concepts. “Thought” was assigned to more general statements that the tool required the participant to think, without reference to either challenge or familiarity.
Table 3.
Coding of open-ended responses regarding difficulty of using health outcome tools
| Category | Qualitative Difficulty |
Code | Definition | Example | All Tool Responses (%) |
|---|---|---|---|---|---|
| Structure | Difficult | Confusion | Wording and/or structure was difficult or confusing. | “Because they had a double meaning and they contradicted one another.” | 7 |
| Difficult | Specificity | Wording was insufficiently detailed or explicit, and/or the choices were too similar. | “It’s hard to think about what disease I might have and how sick it’s going to make me feel. My decision would depend on that.” | 8 | |
| Easy | Clarity and Ease | Wording and/or structure was clear or easy to understand. | “The questions were simply logical and comfortable order for me. There were not hard choices.” | 11 | |
| Content | Difficult | Challenge | Content was challenging or novel, and/or the participant was uncertain of his/her responses. | “Very thought provoking. Hard to think about. All four are important to me so was hard to place in order of importance.” | 16 |
| Difficult | Projection | Hypothetical context was difficult to respond to. | “Hard to imagine how my life would be with dizziness, pain, shortness of breath, and how much it would affect my decision to place boxes in importance level.” | 7 | |
| Neutral | Prior Thought | Content was familiar and/or related to a personal belief or experience. | “I live for today. I know how I feel. I recently had uterine cancer and I chose not to have chemotherapy.” | 43 | |
| Neutral | Thought | Content required thought, in a value-neutral expression without mentioning specific belief. | “You really have to think about what you really want. You have to make some sacrifices in order to feel better.” | 8 | |
These qualitative codes were assigned one of three difficulty ratings. This categorization and the percent of participant responses under each code are presented in Table 4. Qualitative difficulty also varied significantly across the tools. While over half of Attitude Scale responses were hard, over 60% of responses for the other two tools were neutral (Table 2). There was moderate correlation between the qualitatively derived and quantitative rating scales: 0.51 for the Attitude Scale, 0.54 for Now vs. Later, and 0.61 for Health Outcomes (p<.001).
Table 4.
Participant characteristics associated in Chi-square tests with difficulty ratings derived from open-ended responses
| Tool | Variable | Values | Easy (%) | Neutral (%) | Hard (%) | P-Value |
|---|---|---|---|---|---|---|
| Attitude | Race | White | 15 | 26 | 59 | .03 |
| Scale | Black/Other | 26 | 28 | 45 | ||
| Education | <=12th | 23 | 30 | 47 | .002 | |
| >12th | 11 | 24 | 64 | |||
| Health | <9th Grade | 23 | 41 | 36 | <.001 | |
| Literacy | ||||||
| 9th Grade + | 16 | 22 | 62 | |||
| IADL | 0 IADLs | 19 | 21 | 60 | <.001 | |
| Disabilities | ||||||
| 1+ IADLs | 14 | 42 | 43 | |||
| Self-Rated | Excellent / | 17 | 24 | 59 | .004 | |
| Health | Very Good / Good | |||||
| Fair / Poor | 19 | 44 | 37 | |||
| QOL | Best | 23 | 16 | 60 | <.001 | |
| Good | 15 | 28 | 56 | |||
| Worst / Poor / Fair | 12 | 53 | 35 | |||
| Now vs. | Health | <9th Grade | 14 | 74 | 13 | .02 |
| Later | literacy | |||||
| 9th Grade + | 7 | 63 | 30 | |||
| Health | IADL | 0 IADLs | 6 | 59 | 35 | .05 |
| Outcomes | Disabilities | |||||
| 1+ IADLs | 11 | 67 | 22 |
Percentages may not add up to 100 due to rounding.
Concepts coded with secondary codes included negative emotions and religious beliefs (Table 4). A small number (n=8) of participants mentioned having negative emotions around the general process, for example: “Psychologically it stirred me up because it made me think about my mortality.” Just one participant mentioned negative feelings based on using a tool, saying, “I hope the bad won’t happen and that I didn’t jeopardize myself in any way.” Regarding religion, four participants mentioned a belief that only God should make decisions about health outcomes, including, “These are terrible questions. God almighty decides. God knows when to take you. She didn't mention God at all.” More responses (n=8) simply mentioned a belief in God as justifying a participant’s response. As one participant said, “I know what I want. My religion comes into place. God will take care of the future. This is all in His hands. I think about now.”
Bivariate associations between difficulty categories derived from qualitative analysis and participant characteristics are presented in Table 4. Participants of non-white race were significantly more likely to rate the Attitude Scale as easy than white participants. Participants with lower health literacy were significantly more likely to rate the Attitude Scale and Now vs. Later tool as easier than those with higher health literacy. Similarly, those with lower education rated the Attitude Scale as easier than those with higher education. Participants with 1 or more IADL disabilities were more likely to rate the Attitude Scale and Health Outcomes tool as easy than those without disabilities. Participants with lower self-rated health and QOL were more likely to rate the Attitude scale as easy than those with higher levels.
3.4. Changing Care
The majority of participants responded that the tools would not change the way their physician cared for them (84% across all tools). The proportion of participants who felt the tool would change care increased from 14 percent after using the first tool (Attitude Scale) to 17 percent for the second tool (Now vs. Later item), and finally 21 percent for the last tool (Health Outcomes item).
Qualitative answers about changing care that were not more descriptive than their quantitative responses were simply coded as the tool “Would change care” (16%) or “Wouldn’t change care/don’t know” (12%). Six mutually exclusive primary codes were assigned to capture the remaining reasons why the tool would not change care (Table 5). Over half of the reasons were attributable to being “Already Satisfied” (66%), and 18% were based on favoring “Professional Judgment.” One secondary code was added to capture negative emotions, which occurred 33 times across all three tools. This included expressing the possibility that the tool could have a negative effect on care, or that the participant didn’t want it to have an impact. For instance, one participant said, “I would hope not. When the doctor takes the Hippocratic Oath he promises to do good.”
Table 5.
Participants’ reasons for why tools would not change physician care1
| Code | % of Responses (all tools) |
Definition | Example |
|---|---|---|---|
| Already Satisfied | 62 | Participant satisfied with existing physician relationship and/or physician understanding of patient preferences. | “They already know how I feel. I have already talked to them about it.” |
| Not Currently Needed | 4 | Participant believes that he/she is not currently in state of health where information would affect care. | “If I get sick they may want this information but not now.” |
| Irrelevant - Patient | 4 | Participant believes it is the patient's decision and/or intends to act regardless of physician's advice. | “My main doctor knows I am independent. I do more about what I think is right than worry about their opinions.” |
| Unfeasible | 4 | Participant expresses concern about practicality of using tool, including limited time, number of appointments, or unfamiliar physicians. | “She doesn't know me, I am a 15 minute visit.” |
| Physician Resistance | 9 | Participant expresses negative feelings about current physician and/or the physician caring about patient preferences. | “Don’t think she is easily moved, she likes to make her own decisions.” |
| Professional Judgment | 18 | Participant believes physicians act on professional expertise and ethnics and/or that physicians should not act on patient preferences. | “Because they are going to treat diseases the way they are supposed to treat them. Not based on how I feel.” |
Includes only participants who answered “No” to the tool changing care and who elaborated a qualitative reason; n=773
Percentages may not add up to 100 due to rounding.
4. Discussion and conclusion
4.1. Discussion
Among a cohort of community-dwelling older persons administered three different tools, there was substantial variability in participants’ preferred tool for eliciting their health outcome priorities. There were no strong associations between sociodemographic or health characteristics and the preferred tool. Only a small proportion of participants rated any of the tools as hard or very hard using a quantitative rating scale. Difficulty ratings were not higher among those with characteristics that have been associated with health disparities, such as non-white race, poorer health status, or low health literacy and education. Open-ended responses about difficulty included an approximately equal proportion of comments on the specific tools and the general task of identifying priorities. Most participants did not feel that using the tool with their physician would change care, and the most common reason cited was satisfaction with existing care.
The finding in the present study that patients vary in their preferred tool and perceptions of difficulty is in keeping with the existing literature about variability in treatment preferences and preferred decision-making styles. There is substantial evidence of variation in participants’ preferences among treatments based on reductions in risk and the probability of adverse drug events [19–24]. Similarly, preferences for roles in the decision-making process vary among patients [11, 25–32]. Our results add to the literature by showing that patients vary not only in treatment preferences and desired level of involvement, but also in how they want to be asked about such preferences. This study represents one of the first efforts to provide details regarding older persons’ preference amongst approaches to elicit health outcome priorities, as well as perceptions about those approaches, such as ease of use and clinical utility. Understanding these factors is critical to support shared decision-making, especially given the evidence that patients often do not feel empowered to actively participate [12].
The analysis of quantitative and qualitative difficulty ratings implies that the tools can be used by older adults to approach the challenging process of heath outcome prioritization. Quantitatively, only a small proportion of participants found the tools to be hard or very hard. Qualitatively, a higher proportion was labeled with difficult codes. However, over half of the qualitative difficulty was attributable to concepts we labeled as Challenge and Projection, which referred respectively to difficulty with prioritization and the hypothetical context. Both concepts therefore refer to a general process of health outcome prioritization, and not specifics of a particular tool. Considering the small number of difficult quantitative responses, this emphasis on the challenging process may suggest that the tools were in fact successful in helping participants think about an inherently challenging subject. Although characteristics such as lower health literacy, education, or health status might be expected to be associated with greater difficulty in using these tools, we did not find associations between these characteristics and participants’ difficulty ratings. While the tools did surface negative emotions and strong religious beliefs for a few participants, difficulty was not higher for those experiencing recent depression or who rated themselves as highly religious, implying that negative emotions would not pose a barrier for these populations. The higher proportion of participants with increased disability or poorer health who found certain tools easier to use may reflect prior experience with similar decisions.
Despite participants’ ratings of the tools, a significant number did not think the tools would change their care, based on satisfaction with existing care. Some participants said that they had talked about these issues with their physicians, but often participants expressed a more general sense that the physician “knew” how they felt. The potential absence of specific conversations is concerning, since studies have shown significant differences between patients and physicians when choosing outcome priorities [24, 33, 34]. In particular, one study with hypertensive diabetes patients found that while 75 percent of physicians included their patient’s top heath concern in their top three priorities, physicians were less likely to prioritize symptomatic conditions such as pain, shortness of breath, and depression [34]. Agreement was lower for some more “vulnerable” subpopulations, including patients with low health status and with competing demands unrelated to health [34]. Moreover, many of the other reasons for tools not changing care, such as “Physician Resistance” and “Professional Judgment” support the idea of perceived negative physician attitudes towards patient engagement being a barrier in shared decision-making [12]. These comments highlight the need for the explicit conversations that tools can facilitate about priorities, as well as addressing barriers patients see to their input being valued and utilized.
Another explanation of the low number of participants who thought tools would change care is difficulty understanding the types of changes this might include. Participants may have better understood how their care could change with each successive tool, as reflected by the increasing percentage of participants who thought care would change as the question was repeated. Several participants also qualitatively expressed a better understanding with subsequent questioning. For instance, one respondent said “No” when first asked, because “Why should it make any difference? It should not make any difference.” The participant then switched to “Yes,” the final comment being, “They would know what I want and try to follow my wishes.” Response bias may also have impacted the increase in positive answers. Addressing uncertainty in how the tools would change care, as well as potential misconceptions of existing agreement about treatment goals, are important steps in the future implementation of these tools.
Several limitations of this study should be noted. The non-random ordering of the tools could have impacted participant preferences and perceptions. To address this, structural codes in qualitative difficulty were favored to capture tool-specific information and changing care codes were averaged across all tools. However, the potential to interpret the difficulty question as concerning either structure or content means the split between the two coding groups may be incorrect. The study sample is representative of the diversity found in our city of New Haven, but our findings may not generalize to populations in other communities because of differences in sociodemographic, health, cultural, or historical factors. The analysis did not correct for multiple comparisons since it is intended as an exploratory study.
4.2. Conclusion
The variation in preferred tool and wide range of qualitative responses indicates differing preferences among older adults in how they are asked about health outcome priorities. Only a small number of participants found the tools difficult, and participants with characteristics that might be expected to make the tools more difficult to complete did not find the tools harder to use. The absence of significant associations between most sociodemographic variables and tool preference and difficulty suggests that healthcare providers may want to offer options in prioritization tools to all patients. The low number of people who believe tools would change care may reflect a belief that doctors already know this information, and could pose a potential challenge to tool implementation.
4.3. Practice Implications
The variability in patient preferences among tools and the lack of barriers for populations who might be expected to have difficulty using the tools supports the feasibility of using the health outcome prioritization tools with a wide range of patients. This includes patients with limited education or health literacy who may struggle with more complex tools, such as decision aids. Patients may be best served by offering a choice of tools, or by using several and choosing which best conveys their priorities. By explicitly discussing priorities as part of a routine clinical visit, patients and clinicians can tailor care plans. For example, treatment for a patient who prioritizes maintaining independence over prolonging life may not include medications for secondary prevention that can interfere with function, such as statins causing muscle pain and fatigue. Because health outcome priorities may change over time, the tools are intended to allow patients to reassess goals as their health and priorities evolve.
The main challenges to implementing tools include addressing tool usefulness and time requirements. Patients may require education about the availability of different treatment options and the relevance of their priorities to selecting the optimal choice. For finding time to use tools, primary care physicians already feel overburdened and may not realistically be able to include using tools in an already busy schedule [35]. However, there are new models of care being developed where the tool could more easily be introduced. One possibility is expanding beyond the patient-physician dyad and including other providers, such as patient coaches [36]. A second option would be group visits or self-management classes [37], and reviewing the patient’s chosen tool at an individual appointment. Tool implementation and impact on care is a valuable area for future research.
Acknowledgments
Role of Funding and Conflict of Interest:
Supported by grant Pioneer 58381 from the Robert Wood Johnson Foundation, and the Claude D. Pepper Older Americans Independence Center at Yale University School of Medicine (#P30AG21342 NIH/NIA). Dr. Fried is supported by grant K24 AG028443. Ms. Case is supported by the American Federation of Aging Research’s Medical Student Training in Aging Research Program and the Yale University School of Medicine Office of Student Research.
Footnotes
Publisher's Disclaimer: This is a PDF file of an unedited manuscript that has been accepted for publication. As a service to our customers we are providing this early version of the manuscript. The manuscript will undergo copyediting, typesetting, and review of the resulting proof before it is published in its final citable form. Please note that during the production process errors may be discovered which could affect the content, and all legal disclaimers that apply to the journal pertain.
Presented at the 2011 American Geriatric Society Meeting.
Contributor Information
Siobhan M. Case, Yale University School of Medicine, New Haven, USA.
Terri R. Fried, Department of Medicine, Yale University School of Medicine, New Haven, USA, and Clinical Epidemiology Research Center, VA Connecticut Healthcare System, West Haven, USA.
John O’Leary, Clinical Epidemiology Research Center, VA Connecticut Healthcare System, West Haven, USA, and Program on Aging, Yale University School of Medicine, New Haven, USA.
REFERENCES
- 1.Gurwitz JH, Field TS, Harrold LR, Rothschild J, Debellis K, Seger AC, Cadoret C, Fish LS, Garber L, Kelleher M, Bates DW. Incidence and preventability of adverse drug events among older persons in the ambulatory setting. JAMA. 2003;289:1107–1116. doi: 10.1001/jama.289.9.1107. [DOI] [PubMed] [Google Scholar]
- 2.Boyd CM, Darer J, Boult C, Fried LP, Boult L, Wu AW. Clinical practice guidelines and quality of care for older patients with multiple comorbid diseases: Implications for pay for performance. JAMA. 2005;294:716–724. doi: 10.1001/jama.294.6.716. [DOI] [PubMed] [Google Scholar]
- 3.Tinetti ME, Bogardus ST, Jr, Agostini JV. Potential pitfalls of disease-specific guidelines for patients with multiple conditions. N Engl J Med. 2004;351:2870–2874. doi: 10.1056/NEJMsb042458. [DOI] [PubMed] [Google Scholar]
- 4.Gandhi TK, Weingart SN, Borus J, Seger AC, Peterson J, Burdick E, Shu K, Federico F, Leape LL, Bates DW. Adverse drug events in ambulatory care. N Engl J Med. 2003;348:1556–1564. doi: 10.1056/NEJMsa020703. [DOI] [PubMed] [Google Scholar]
- 5.Agostini JV, Han L, Tinetti ME. The relationship between number of medications and weight loss or impaired balance in older adults. J Am Geriatr Soc. 2004;52:1719–1723. doi: 10.1111/j.1532-5415.2004.52467.x. [DOI] [PubMed] [Google Scholar]
- 6.Krahn M, Naglie G. The next step in guideline development: Incorporating patient preferences. JAMA. 2008;300:436–438. doi: 10.1001/jama.300.4.436. [DOI] [PubMed] [Google Scholar]
- 7.Fried TR, Tinetti M, Agostini J, Iannone L, Towle V. Health outcome prioritization to elicit preferences of older persons with multiple health conditions. Patient Educ Couns. 2010;83:278–282. doi: 10.1016/j.pec.2010.04.032. [DOI] [PMC free article] [PubMed] [Google Scholar]
- 8.Lenert L, Kaplan RM. Validity and interpretation of preference-based measures of health-related quality of life. Med Care. 2000;38:II138–II150. doi: 10.1097/00005650-200009002-00021. [DOI] [PubMed] [Google Scholar]
- 9.Horsman J, Furlong W, Feeny D, Torrance G. The health utilities index (HUI): Concepts, measurement properties and applications. Health Qual Life Outcomes. 2003;1:54. doi: 10.1186/1477-7525-1-54. [DOI] [PMC free article] [PubMed] [Google Scholar]
- 10.Van Ness PH, Towle VR, Juthani-Mehta M. Testing measurement reliability in older populations: Methods for informed discrimination in instrument selection and application. J Aging Health. 2008;20:183–197. doi: 10.1177/0898264307310448. [DOI] [PMC free article] [PubMed] [Google Scholar]
- 11.Levinson W, Kao A, Kuby A, Thisted RA. Not all patients want to participate in decision making. A national study of public preferences. J Gen Intern Med. 2005;20:531–535. doi: 10.1111/j.1525-1497.2005.04101.x. [DOI] [PMC free article] [PubMed] [Google Scholar]
- 12.Frosch DL, May SG, Rendle KA, Tietbohl C, Elwyn G. Authoritarian physicians and patients' fear of being labeled 'difficult' among key obstacles to shared decision making. Health Aff. 2012;31:1030–1038. doi: 10.1377/hlthaff.2011.0576. [DOI] [PubMed] [Google Scholar]
- 13.Arozullah AM, Yarnold PR, Bennett CL, Soltysik RC, Wolf MS, Ferreira RM, Lee SY, Costello S, Shakir A, Denwood C, Bryant FB, Davis T. Development and validation of a short-form, rapid estimate of adult literacy in medicine. Med Care. 2007;45:1026–1033. doi: 10.1097/MLR.0b013e3180616c1b. [DOI] [PubMed] [Google Scholar]
- 14.Lawton MP, Brody EM. Assessment of older people: Self-maintaining and instrumental activities of daily living. Gerontologist. 1969;9:179–186. [PubMed] [Google Scholar]
- 15.Whooley MA, Avins AL, Miranda J, Browner WS. Case-finding instruments for depression. Two questions are as good as many. J Gen Intern Med. 1997;12:439–445. doi: 10.1046/j.1525-1497.1997.00076.x. [DOI] [PMC free article] [PubMed] [Google Scholar]
- 16.Fried TR, McGraw S, Agostini JV, Tinetti ME. Views of older persons with multiple morbidities on competing outcomes and clinical decision-making. J Am Geriatr Soc. 2008;56:1839–1844. doi: 10.1111/j.1532-5415.2008.01923.x. [DOI] [PMC free article] [PubMed] [Google Scholar]
- 17.Fried TR, Tinetti M, Agostini J, Iannone L, Towle V. Health outcome prioritization to elicit preferences of older persons with multiple health conditions. Patient Educ Couns. 2011;83:278–282. doi: 10.1016/j.pec.2010.04.032. [DOI] [PMC free article] [PubMed] [Google Scholar]
- 18.Bradley EH, Curry LA, Devers KJ. Qualitative data analysis for health services research: Developing taxonomy, themes, and theory. Health Serv Res. 2007;42:1758–1772. doi: 10.1111/j.1475-6773.2006.00684.x. [DOI] [PMC free article] [PubMed] [Google Scholar]
- 19.Tsevat J, Dawson NV, Wu AW, Lynn J, Soukup JR, Cook EF, Vidaillet H, Phillips RS. Health values of hospitalized patients 80 years or older. JAMA. 1998;279:371–375. doi: 10.1001/jama.279.5.371. [DOI] [PubMed] [Google Scholar]
- 20.Benson J, Britten N. Patients' decisions about whether or not to take antihypertensive drugs: Qualitative study. BMJ. 2002;325:873. doi: 10.1136/bmj.325.7369.873. [DOI] [PMC free article] [PubMed] [Google Scholar]
- 21.Man-Son-Hing M, Gage BF, Montgomery AA, Howitt A, Thomson R, Devereaux PJ, Protheroe J, Fahey T, Armstrong D, Laupacis A. Preference-based antithrombotic therapy in atrial fibrillation: Implications for clinical decision making. Med Decis Making. 2005;25:548–559. doi: 10.1177/0272989X05280558. [DOI] [PubMed] [Google Scholar]
- 22.Tinetti ME, McAvay GJ, Fried TR, Allore HG, Salmon JC, Foody JM, Bianco L, Ginter S, Fraenkel L. Health outcome priorities among competing cardiovascular, fall injury, and medication-related symptom outcomes. J Am Geriatr Soc. 2008;56:1409–1416. doi: 10.1111/j.1532-5415.2008.01815.x. [DOI] [PMC free article] [PubMed] [Google Scholar]
- 23.Llewellyn-Thomas HA, Paterson JM, Carter JA, Basinsk A, Myers MG, Hardacre GD, Dunn EV, D'Agostino RB, Wolf PA, Naylor CD. Primary prevention drug therapy: Can it meet patients' requirements for reduced risk? Med Decis Making. 2002;22:326–339. doi: 10.1177/0272989X0202200411. [DOI] [PubMed] [Google Scholar]
- 24.Devereaux PJ, Anderson DR, Gardner MJ, Putnam W, Flowerdew GJ, Brownell BF, Nagpal S, Cox JL. Differences between perspectives of physicians and patients on anticoagulation in patients with atrial fibrillation: Observational study. BMJ. 2001;323:1218–1222. doi: 10.1136/bmj.323.7323.1218. [DOI] [PMC free article] [PubMed] [Google Scholar]
- 25.Degner LF, Sloan JA. Decision making during serious illness: What role do patients really want to play? J Clin Epidemiol. 1992;45:941–950. doi: 10.1016/0895-4356(92)90110-9. [DOI] [PubMed] [Google Scholar]
- 26.Belcher VN, Fried TR, Agostini JV, Tinetti ME. Views of older adults on patient participation in medication-related decision making. J Gen Intern Med. 2006;21:298–303. doi: 10.1111/j.1525-1497.2006.00329.x. [DOI] [PMC free article] [PubMed] [Google Scholar]
- 27.Anthony JS. Self-advocacy in health care decision-making among elderly African Americans. J Cult Divers. 2007;14:88–95. [PubMed] [Google Scholar]
- 28.Laakkonen ML, Pitkala KH, Strandberg TE, Berglind S, Tilvis RS. Older people's reasoning for resuscitation preferences and their role in the decision-making process. Resuscitation. 2005;65:165–171. doi: 10.1016/j.resuscitation.2004.11.016. [DOI] [PubMed] [Google Scholar]
- 29.Schulman-Green DJ, Naik AD, Bradley EH, McCorkle R, Bogardus ST. Goal setting as a shared decision making strategy among clinicians and their older patients. Patient Educ Couns. 2006;63:145–151. doi: 10.1016/j.pec.2005.09.010. [DOI] [PMC free article] [PubMed] [Google Scholar]
- 30.Hamann J, Neuner B, Kasper J, Vodermaier A, Loh A, Deinzer A, Heesen C, Kissling W, Busch R, Schmieder R, Spies C, Caspari C, Harter M. Participation preferences of patients with acute and chronic conditions. Health Expect. 2007;10:358–363. doi: 10.1111/j.1369-7625.2007.00458.x. [DOI] [PMC free article] [PubMed] [Google Scholar]
- 31.Longtin Y, Sax H, Leape LL, Sheridan SE, Donaldson L, Pittet D. Patient participation: Current knowledge and applicability to patient safety. Mayo Clin Proc. 2010;85:53–62. doi: 10.4065/mcp.2009.0248. [DOI] [PMC free article] [PubMed] [Google Scholar]
- 32.Flynn KE, Smith MA. Personality and health care decision-making style. J Gerontol B Psychol Sci Soc Sci. 2007;62:P261–P267. doi: 10.1093/geronb/62.5.p261. [DOI] [PMC free article] [PubMed] [Google Scholar]
- 33.Montgomery AA, Fahey T. How do patients' treatment preferences compare with those of clinicians? Qual Health Care. 2001;10(Suppl 1):i39–i43. doi: 10.1136/qhc.0100039... [DOI] [PMC free article] [PubMed] [Google Scholar]
- 34.Zulman DM, Kerr EA, Hofer TP, Heisler M, Zikmund-Fisher BJ. Patient-provider concordance in the prioritization of health conditions among hypertensive diabetes patients. J Gen Intern Med. 2010;25:408–414. doi: 10.1007/s11606-009-1232-1. [DOI] [PMC free article] [PubMed] [Google Scholar]
- 35.Fried TR, Tinetti ME, Iannone L. Primary care clinicians' experiences with treatment decision making for older persons with multiple conditions. Arch Int Med. 2011;171:75–80. doi: 10.1001/archinternmed.2010.318. [DOI] [PMC free article] [PubMed] [Google Scholar]
- 36.Stacey D, Murray MA, Legare F, Sandy D, Menard P, O'Connor A. Decision coaching to support shared decision making: A framework, evidence, and implications for nursing practice, education, and policy. Worldviews Evid Based Nurs. 2008;5:25–35. doi: 10.1111/j.1741-6787.2007.00108.x. [DOI] [PubMed] [Google Scholar]
- 37.Brennan J, Hwang D, Phelps K. Group visits and chronic disease management in adults: A review. Am J Lifestyle Med. 2011;5:69–84. [Google Scholar]