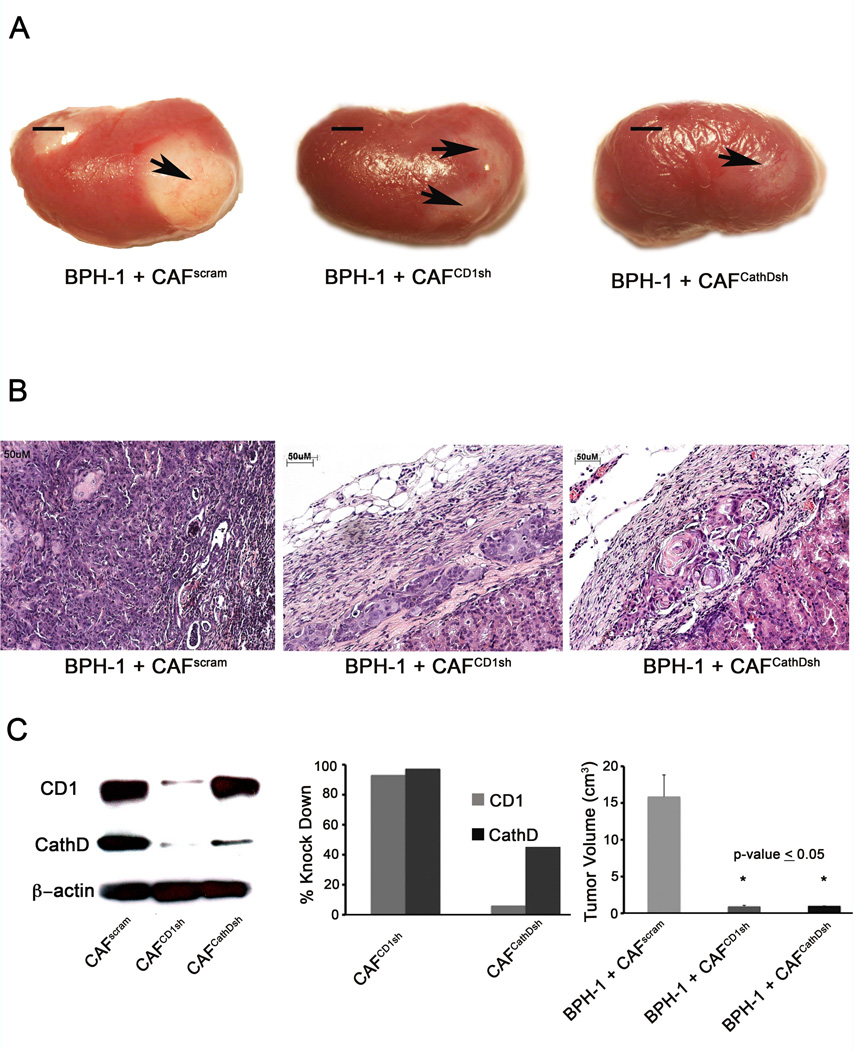
Figure 4. Cyclin D1 and Cathepsin D are required for CAF induced tumorigenicity in vivo.
(A) Gross morphology of 2 month grafts of BPH-1 + CAFPSR, BPH-1 + CAFCD1sh, and BPH-1 + CAFCathDsh, scale bar equal to 5cm. (B) H&E staining of BPH-1 + CAFPSR, CAFCD1sh, or CAFCathDsh. BPH-1 + CAFPSR recombinants formed adenosquamous carcinoma as previously described. Scale bar equal to 50µm (C) Western blot confirming knockdown of CD1 and CathD in CAFs (left). Knockdown efficiency determined by performing densitometric analysis of western blot represented by bar graph (middle). Quantiation of tumor volume of 2 month grafts of BPH-1 + CAFPSR, BPH-1 + CAFCD1sh, and BPH-1 + CAFCathDsh (right), graphical representation of the mean ± SD of the grafts is shown in n=6. Significance determined by ANOVA, p-value ≤0.05.

