Abstract
There is a long standing interest in measuring complete emission spectra from individual cells in flow cytometry. We have developed flow cytometry instruments and analysis approaches to enable this to be done routinely and robustly. Our spectral flow cytometers use a holographic grating to disperse light from single cells onto a CCD for high speed, wavelength-resolved detection. Customized software allows the single cell spectral data to be displayed and analyzed to produce new spectra-derived parameters. We show that familiar reference and calibration beads can be employed to quantitatively assess instrument performance. We use microspheres stained with six different quantum dots to compare a virtual bandpass filter approach with classic least squares (CLS) spectral unmixing, and then use antibody capture beads and CLS unmixing to demonstrate immunophenotyping of peripheral blood mononuclear cells using spectral flow cytometry. Finally, we characterize and evaluate several near infrared (NIR) emitting fluorophores for use in spectral flow cytometry. Spectral flow cytometry offers a number of attractive features for single cell analysis, including a simplified optical path, high spectral resolution, and streamlined approaches to quantitative multiparameter measurements. The availability of robust instrumentation, software, and analysis approaches will facilitate the development of spectral flow cytometry applications.
INTRODUCTION
The measurement of complete emission spectra from individual cells is a long standing goal in flow cytometry that is now poised to become possible on a routine basis. While conventional flow cytometry uses photomultiplier tubes (PMTs) to measure fluorescence in specific wavelength bands selected with dichroic mirriors and band pass filters, spectral flow cytometry uses prisms or gratings to disperse light over a detector array. The development of spectral flow cytometry can be traced back to the earliest days of the field (1–8), but it is only recently that advances in optics, detectors, and software have made this approach practical. Highly efficient dispersion of collected light by prisms or gratings onto array detectors such as multianode PMTs (9, 10) or CCDs (11–14) enable the sensitive measurement of complete spectra from individual cells at rates of hundreds or thousands of particles per second, presenting new possibilities for single cell analysis.
Multianode PMT-based systems offer high speed and high signal gain with spectral resolution on the order of 10 nm, but with decreased sensitivity in the red and near IR regions of the optical spectrum. Gregori et al (9) recently reported an initial characterization of such a system. CCD-based systems offer high spectral resolution and uniform detector quantum efficiency over a wide spectral range, but tend to have slower readout speed that can limit the event rate. Goddard et al (11) reported on the use of an early version of such a system for fluorescence measurements, and our group has used a similar approach to measure surface enhanced Raman scattering from single cells and particles (12–16).
In this report, we describe spectral flow cytometry instruments, software, and experimental design that allow spectral flow cytometry to be integrated with conventional flow cytometry approaches. Starting with microspheres as calibration and reference standards, and spectral display and unmixing to estimate the contributions of multiple labels to single particle spectra, we demonstrate performance in multiplexed labeling using QDots and multicolor immunophenotyping of normal peripheral blood mononuclear cells (PBMCs). We also characterize a near infrared (NIR) spectral flow cytometer, several NIR fluorophores, and demonstrate how multiparameter flow cytometry can be extended into this underutilized region of the optical spectrum.
Methods
Reagents
A full list of reagents, sources, and catalogue numbers is provided in Table S1 (Supporting Information). Fluorescent neutravidin (Thermo Scientific) was prepared by incubating 1.5 uM protein with 15 uM of the reactive form of the dye of interest for 60 minutes at 21 °C, followed by gel filtration on a desalting column (Pierce). The fluorophore to protein ratio was determined from UV absorbance measurements at 280 nm and the absorbance maximum and extinction coefficient of the fluorophore, after correction for fluorophore absorbance at 280 nm. The relative quantum yield (Qr) was calculated from the fluorescence of the protein-conjugated fluorophore compared to the fluorescence of an equivalent concentration of free dye in MeOH.
Peripheral blood mononuclear cells (PBMCs) were obtained frozen from Cell Technologies Limited, thawed as instructed and stained with optimal concentrations (as determined by titration) of the indicated antibodies for 45 minutes at room temperature (RT), followed by washing by two cycles of centrifugation (5 min 500g) and resuspension.
Spectral Flow Cytometry
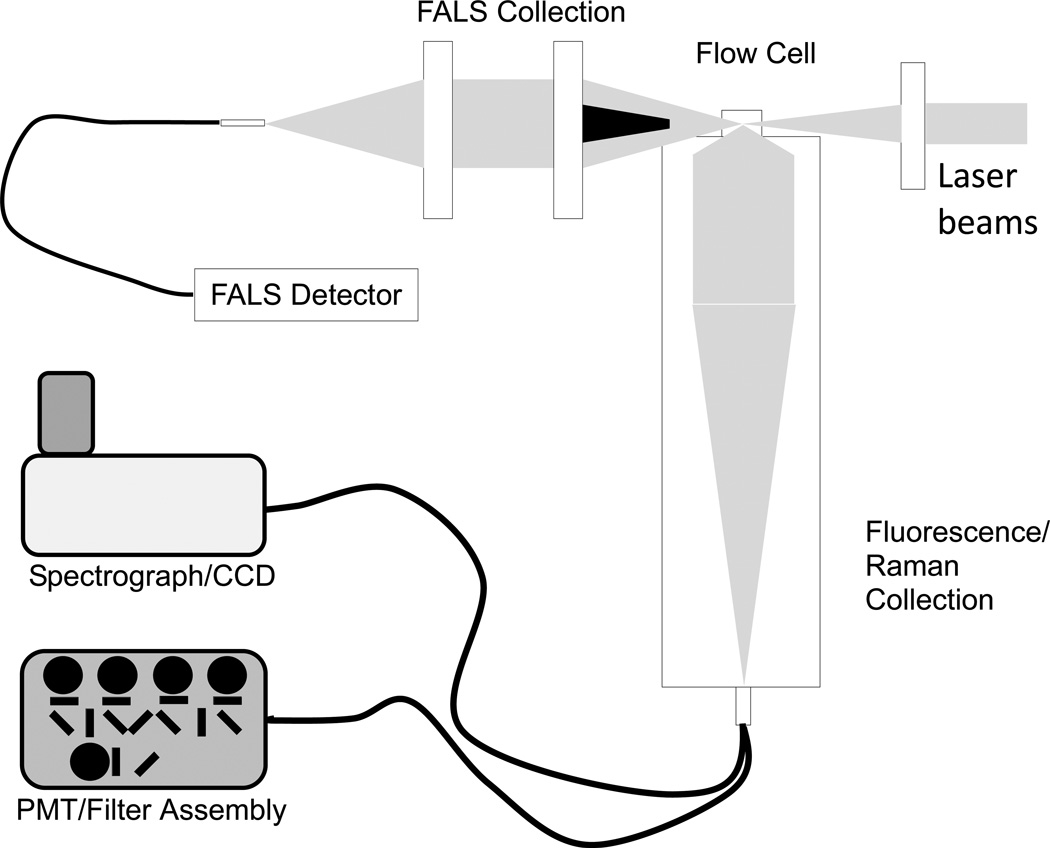
Single particle fluorescent measurements were made on two different custom spectral flow cytometers, one for visible excitation and detection and the second for NIR excitation and detection. The first instrument (schematic in Figure 1) employed an optical bench (flow cell, excitation laser beam shaping optics, forward angle obscuration bar, orthogonal collection optics, and optical relay fibers) from a FACSCanto flow cytometer (BD Biosciences), 488 nm (200 mW, Sapphire, Coherent) and 405 nm (45 mW, Cube, Coherent) lasers, and a multi-PMT detector assembly from a Beckman Coulter Elite/Altra cell sorter. In addition, PMT assemblies comprised of a subminiature version A (SMA) fiber input, collimating lens, optical filter, focusing lens, PMT holder (ThorLabs), PMT (R3896, Hamamatsu) and socket (C1951, Hamamatsu) were used for side scatter detection. Spectral dispersion and detection was performed using a fiber-coupled Holospec (Kaiser Optical Systems) imaging spectrograph with a 457 nm edge filter (Semrock) or a 488 nm notch filter (Kaiser) and a broadband volume phase holographic grating (HFG-650, Kaiser) interfaced with an EM-CCD detector (Newton DU970-UVB, Andor). The theoretical maximum resolution of this spectrograph/camera combination was 0.19 nm, but with the ~860 um diameter fluorescence collection fiber as the limiting aperture, the spectral resolution of the system was approximately 11.33 nm. Forward scatter detection employed an obscuration bar to block the laser beam, a collimating lens, a 10 nm BP filter at the appropriate excitation wavelength, and a focusing lens to couple the collected light into an optical fiber. Light was detected using a fiber collimation assembly to direct the light onto the original FACSCanto FALS photodiode. The estimated light collection angle in the forward direction was ~3–20 degrees. Due to reflective losses in the beam steering and shaping optics, the power just prior to the beam final focusing optic was approximately 15 mW and 60 mW at 405 nm and 488 nm, respectively. Signal from each of the probe volumes was focused onto a different fiber, which in turn could be input into either a PMT assembly or to a spectral detection assembly, depending on the application. Typical sheath and sample flow rates were 20 µl/sec and 0.02 µl/sec respectively, which gave a transit time (pulse width) of ~20 µsec through the probe volume.
Figure 1.
Schematic of a multilaser spectral flow cytometer.
The second instrument was similar to that previously described (13), but configured to support NIR detection. It used a flow cell and excitation laser beam shaping optics from a Coulter Elite cell sorter with collection optics (with NIR anti-reflective coating) and fibers from commercial sources interfaced to PMTs. Excitation was provided by a diode laser emitting ~100 mW at 785 nm (B&W Tek). Spectral dispersion and detection was performed using a fiber-coupled Holospec (Kaiser) imaging spectrograph with a 785 nm edge filter (Razr Edge, Semrock) and a narrowband volume phase holographic grating (HSG-785-LF, Kaiser) interfaced with an deep depletion (DD) CCD detector (Newton DU920N-BRDD, Andor). The theoretical maximum resolution of this spectrograph-camera combination was 0.12 nm, but with the ~600 um diameter fluorescence collection fiber as the limiting aperture, the spectral resolution of this system was approximately 3.23 nm. Forward scatter detection employed an obscuration bar to block the laser beam, a collimating and a focusing lens to couple light into an optical fiber, and a collimating lens to direct light onto an amplified photodiode (ThorLabs PDA100).. The estimated light collection angle in the forward direction was ~3–20 degrees. Typical sheath and sample flow rates were 2 µl/sec and 0.002 µl/sec respectively, which gave a transit time (pulse width) of ~200 µsec through the probe volume.
For both instruments, data was acquired with a custom data acquisition system that digitized signal pulses from the analogue detectors (PMTs and photodiodes) and recorded pulse height and area from each channel, plus pulse width from the trigger channel (usually forward or side scatter). The data system also recorded the spectra of each particle as detected by the CCD detector. In full vertical binning mode with 5X binning of the horizontal (spectral) axis, the CCD had a minimum trigger period (dead time) of 5.12 msec, allowing a maximum event rate of 195 spectra/second in the ideal case where events occur synchronously. Exposure times for the camera were between 100 and 400 µsec. The spectral axes were calibrated using a Hg/Ne calibration lamp (Newport) and/or scattered light from laser lines at 532 nm, 660nm, and 785 nm. Data from photodiodes and PMTs was stored in FCS 3.0 format while spectral data was stored in ASCII format. A zip-file container format was developed to hold these two data types which were read in to a customized version of FCS Express 4 (De Novo Software) with spectral analysis and display capabilities.
Data Analysis
Spectral flow cytometry data analysis used a combination of the customized version of FCS Express and MatLab. In some cases the system background spectrum, determined by acquiring data with a software trigger, was subtracted from each sample spectrum, in other cases the background was treated as a signal component in spectral unmixing. FCS Express enabled display and simple parameter math-based manipulation of the single particle spectra, including the calculation and display of integrated emission from specified wavelength ranges as new parameters, as well as the display and gating used in conventional flow cytometry. Spectral unmixing was performed using a non-negative classical least squares (CLS) fitting routine developed in MatLab. This routine used reference spectra that were obtained from blank cells (autofluorescence) or single stained particles to estimate the contribution of each component to the mixture spectra. The resulting intensities, along with the fit error for each event, were exported as a text file and incorporated into the zip container file such that they could be displayed and analyzed in FCS Express. After spectral unmixing, negative particles typically had a median intensity of zero, and intensity axes are displayed on a biexponential scale with a transition at ~1%of full scale.
The number of photons detected were estimated by multiplying the integrated emission intensity units by the manufacturer-supplied CCD system sensitivity (10.54 pe-/A/D count for the EM-CCD and 6.2 pe- for the DD-CCD) under the operating conditions used (2.5 MHz readout rate, 2× preamplifier gain).
RESULTS
High Resolution Spectra of Individual Particles in Flow
The spectral flow cytometers used in this work employ standard square (for the NIR system) or rectangular (for the visible system) flow cells and free-space or gel-coupled collection optics to focus collected light into multimode optical fibers. The output of these fibers is then coupled into either a filter and mirror-based PMT array or into an imaging spectrograph containing a long pass edge filter and volume phase holographic grating and interfaced to a CCD detector. Particles are hydrodynamically focused to flow through the center of an elliptically-shaped focused laser beam spot at the measurement probe volume. Sheath flow ranged from 2–20 µl/second to give particle transit times of 200 – 20 µsec through the probe volume. Detection was typically triggered using a threshold set on the forward or orthogonal light scatter signal.
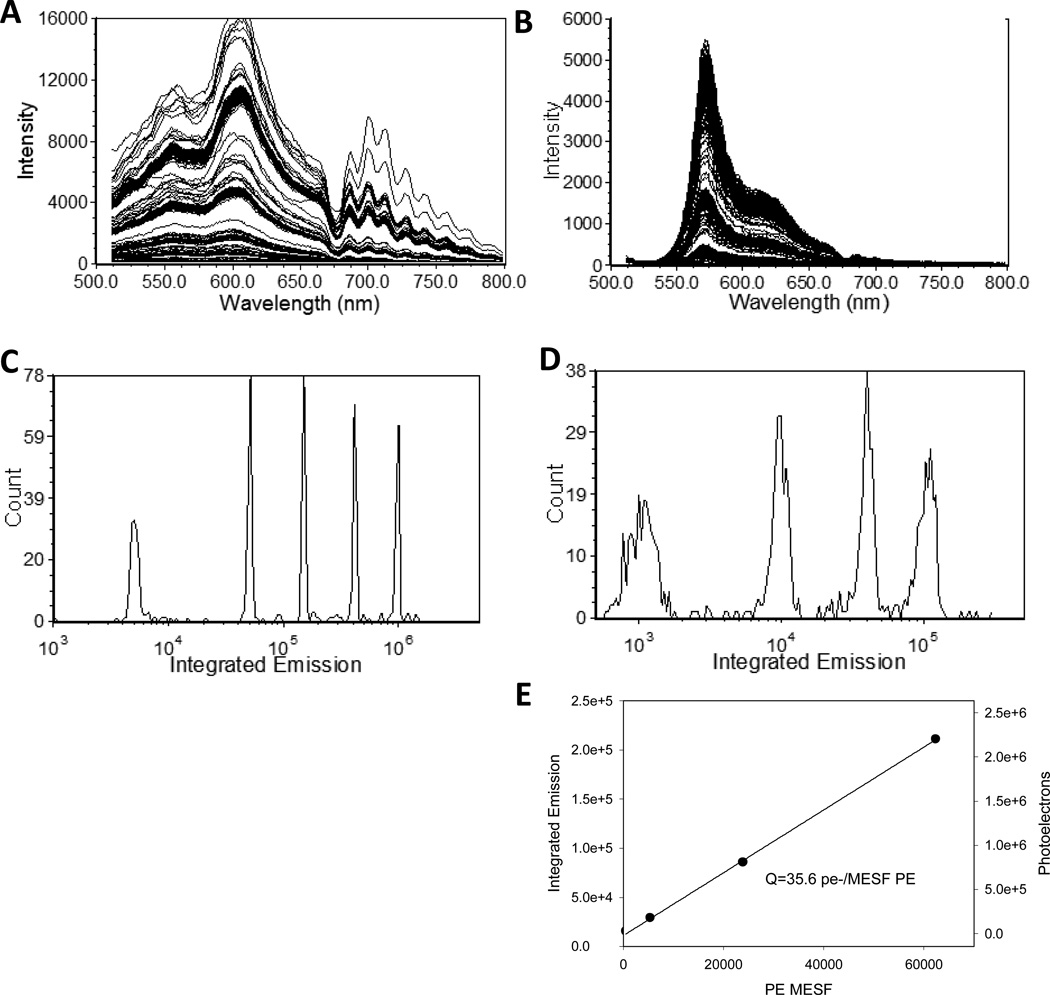
For spectral detection, the CCD integration time was set to match the transit time and the image is cropped to just the area of the chip that contains the image of the spectrum. This region of interest is then binned on-chip to the desired spectral resolution in the horizontal (spectral) dimension and to one super-pixel in the vertical direction. A system background spectrum obtained using a software trigger was generally subtracted from each particle spectrum (Figure S1). Presented in Figure 2 are spectral data from multifluorophore beads and single fluorophore PE beads excited at 488 nm, with detection triggered by 488 nm FALS. The single particle spectra can be analyzed in a number of different ways, depending on the application. To characterize instrument sensitivity, the total integrated emission can be calculated and displayed as a familiar frequency histogram (Figure 2C). In conventional flow cytometry, the increase in bead CV as bead intensity decreases has been used to estimate photon counting statistics and calculate instrument response and background, expressed as the values Q and B (17–19). In the case of the spectral measurements presented here, the increase in CV with decreasing intensity is small, less than two fold for all but the dimmest bead, indicating photon counting statistics do not dominate these measurements and precluding this approach. However, the response of the CCD chip (provided by the manufacturer) can be used to estimate the number of photoelectrons (pe−) detected, which can in turn be used to quantify the response of the system. For the PE beads in Figure 2D, a plot of pe- vs particle MESF yields a slope of 35.6 pe−/MESF, an estimate for Q.
Figure 2.
Spectral flow cytometry of reference and calibration particles. (A, B) Single particle spectra and (C, D) integrated emission (512 nm – 819 nm) from (A, C) multifluorophore (UltraRainbow) beads and (B, D) PE-stained calibration (Quantibrite) beads. (E) Plot of mean photons detected vs MESF of the PE stained beads.
Spectral Unmixing and Multiparameter Analysis
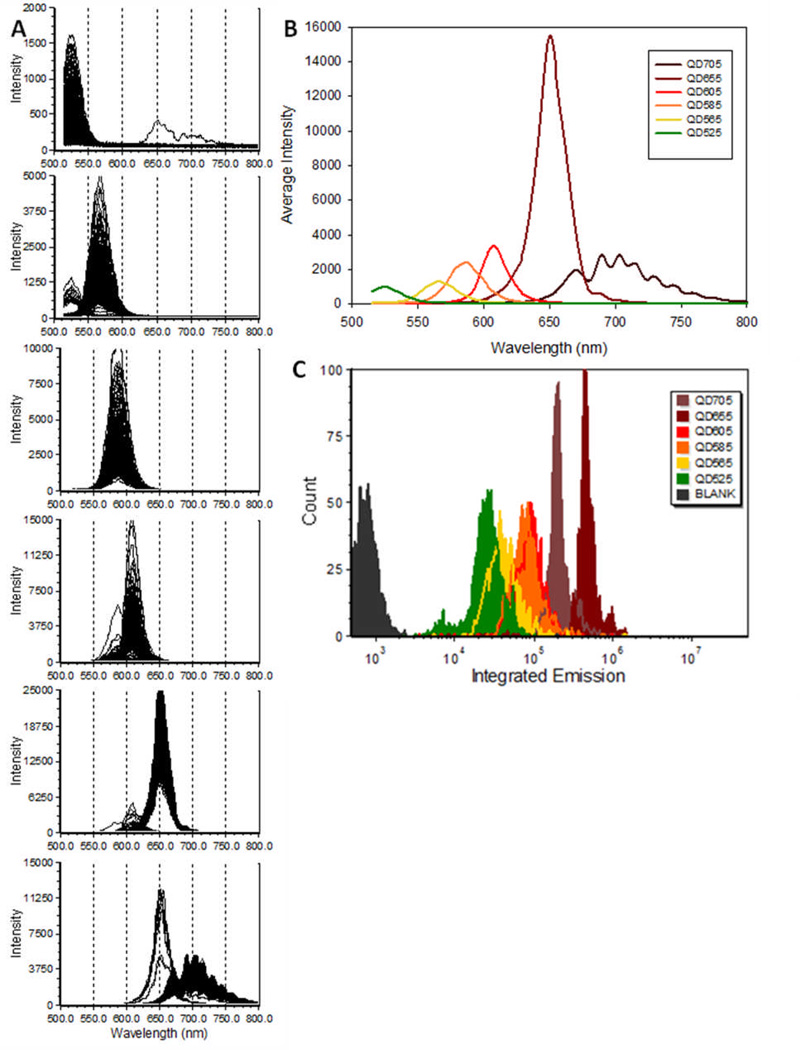
Flow cytometry’s distinctive analytical strength stems from its ability to make multiparameter measurements on individual particles. To evaluate the abilities of spectral flow cytometry to measure many different fluorophores we labeled biotinylated microspheres with six different streptavidin quantum dots and measured them using spectral flow cytometry with 405 nm excitation and with detection triggered by 405 nm FALS. Presented in Figure 3 are the individual spectra, average spectra, and integrated emission from beads stained with six different quantum dots. The emission maximum for each QDot was consistent with the designation provided by the manufacturer, with the QD705 spectra showing evidence of etaloning, an optical artifact resulting from total internal reflection at the glass surfaces of the back-thinned CCD detector. It is interesting to note that the low level carryover of differently-labeled beads from previous samples can be readily identified in the single particle spectra. The brightness of the QDots bound to beads in saturating amounts varied by more than a factor of 20 from the dimmest (QD525) to the brightest (QD655), as can be seen from the identically scaled individual spectra and the integrated emission histogram, and reflected the relative extinction coefficients reported by the manufacturer. For reference, these same beads gave a brightness of ~1×10⁶ PE MESF when stained with a saturating amount of PE-streptavidin and measured on a conventional flow cytometer.
Figure 3.
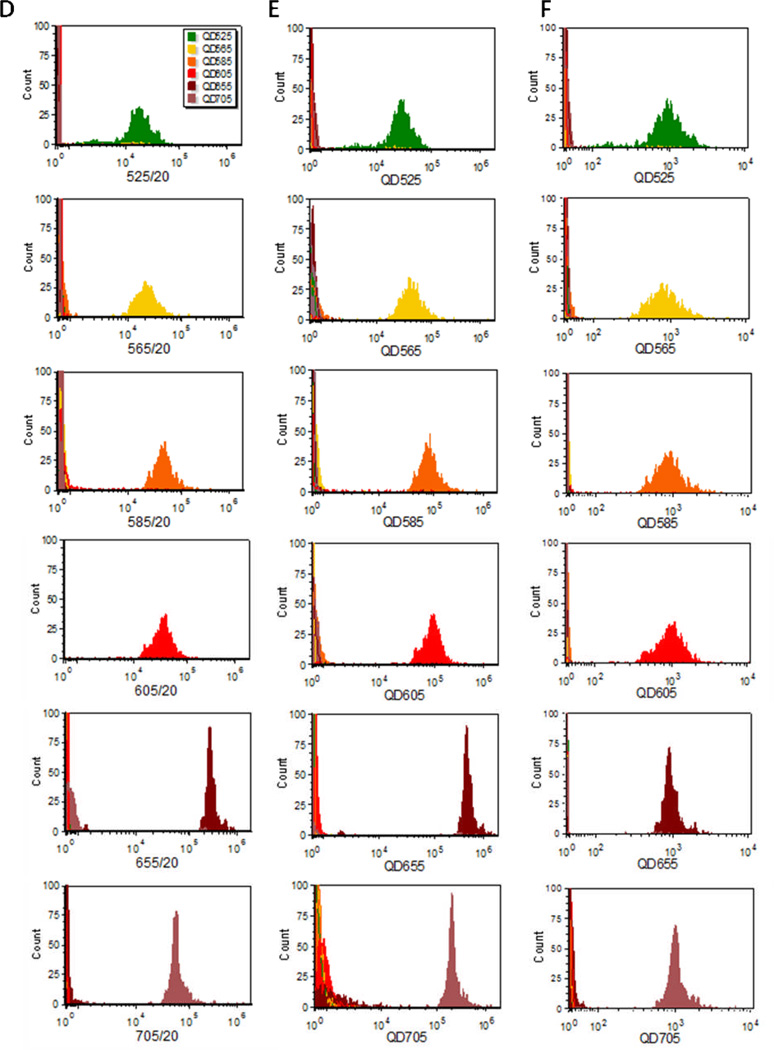
Fluorescence spectra of QDot stained beads. A) Individual spectra of beads stained with QD525, QD565, QD585, QD605, QD655, and QD705 (from top to bottom). B) Average single bead spectra from the data shown in (A). C) Integrated intensity histograms from the data shown in (A). D) Intensity histograms from application of virtual bandpass filters to spectral data. E) Intensity histograms from unmixed spectral data using the reference bead spectra. F ) Abundance histograms from unmixed spectral data using the reference bead spectra and intensities.
In conventional flow cytometry, optical filters are used to spectrally filter light during detection. In spectral flow cytometry, it is possible to digitally apply filters using software after acquisition. To illustrate this, we used the parameter math functions of FCS Express Spectral to apply 20 nm wide “virtual band pass” filters corresponding to the nominal center wavelength of each Qdot to generate six new parameters. As could be predicted from inspecting the spectra (Figure 3B), spillover emission from QD565, QD585, and QD605 was observed in adjacent channels, and this was addressed by compensation in the usual manner using single stained controls to produce the histograms are presented in Figure 3D.
In spectral flow cytometry, a variety of alternative approaches can be used to analyze the spectral data, the simplest of which is probably CLS spectral unmixing. This approach assumes that the detected spectrum is a linear combination of several components, each of which has a known spectrum that does not change during the experiment. CLS allows one to determine the relative contribution of each component to the measured spectra (16). For the data set above, we defined a reference spectrum for each Qdot as the average single bead spectrum from beads labeled at saturation (Figure 3), plus a background determined from a blank bead, as components and used a non-negative CLS fitting routine to determine the amount of each reference component present. The fitting routine reported the contribution of each Qdot, normalized to account for the differences in brightness of the different QDots, as is often desired. The fitting routine can also be configured to report the intensity contribution of each component, for cases where the absolute intensity is a more appropriate output than the amount of an individual tag. For the single Qdot beads, the predominant component is clearly identified by the spectral unmixing Figure 3E, even for the tags with a high degree of spectral overlap (QD565, QD585, and QD605).
As noted above, and evident in both the parameter math-based analysis and the unmixing analysis, the different QDots vary by <20-fold in intensity. A comparison of the virtual bandpass and unmixing results (Table S2, Supporting Information), shows comparable CVs for the two approaches, but higher total signal intensities for the spectral unmixing approach owing to the fact that the virtual bandpass approach considered only a fraction of the total emission of each tag. Moreover, the spectral unmixing results allow the difference in tag brightness to be accounted for to produce an abundance histogram (Figure 3F), in which the integrated intensity of each reference tag is used to normalized tag brightness to an arbitrary intensity (here 1000), allowing the abundance of each tag to be expressed independent of its brightness. If the binding capacity of the capture beads is calibrated, the abundance values can be linked to a defined number of antibody molecules, providing a straightforward approach to quantitative receptor measurements.
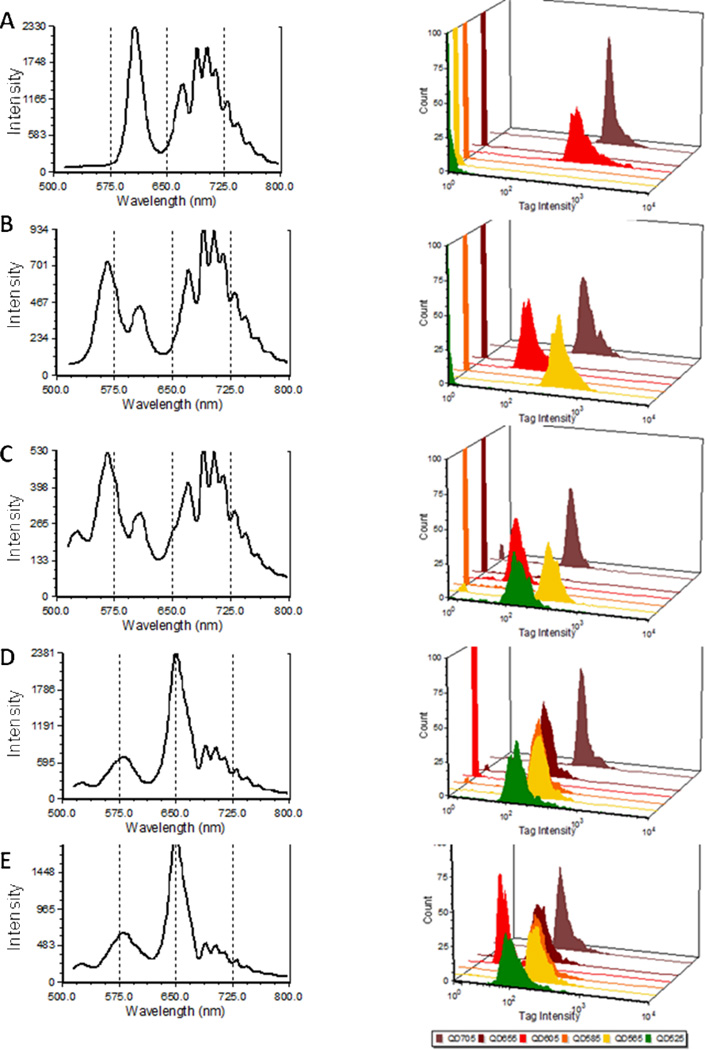
A more challenging test is to identify individual tags in a mixture. We mixed different streptavidin Qdots on biotinylated beads in equal amounts of two, three, four, five, or all six tags, and analyzed them by spectral flow cytometry followed by CLS spectral unmixing. As presented in Figure 4, the measured spectra grew increasingly complex as the number of tags per bead increased. However, the spectral unmixing routine readily identified the components in each mixture. The contributions of each tag decreased in proportion to the number of tags as competition increased for binding to the beads. One of the tags (QD605) decreased to a relatively greater degree than the others, a behavior we ascribed to a low concentration of streptavidin in this preparation, a suspicion that was confirmed when comparing titration curves (Figure S2). The ability of spectral flow cytometry to accurately identify combinatorial staining with six different Qdots suggests that this approach could be used for high levels of multiplexed encoding, following the recent examples of fluorescent cell barcoding (20) or analysis of antigen-specific T cells using MHC-peptide/Qdot multimers (21, 22).
Figure 4.
Spectral encoding using Qdots. Average spectra (left) and abundance histograms after spectral unmixing (right) of beads stained with A) two (QD605+QD705), B) three (QD565+QD605+QD705),C) four (QD565+QD585+QD605+QD705), D) five (QD525+QD565+QD585+QD655+QD705), or E) all six Qdots (from top to bottom) as measured by spectral flow cytometry.
PBMC Immunophenotyping using Spectral Flow Cytometry
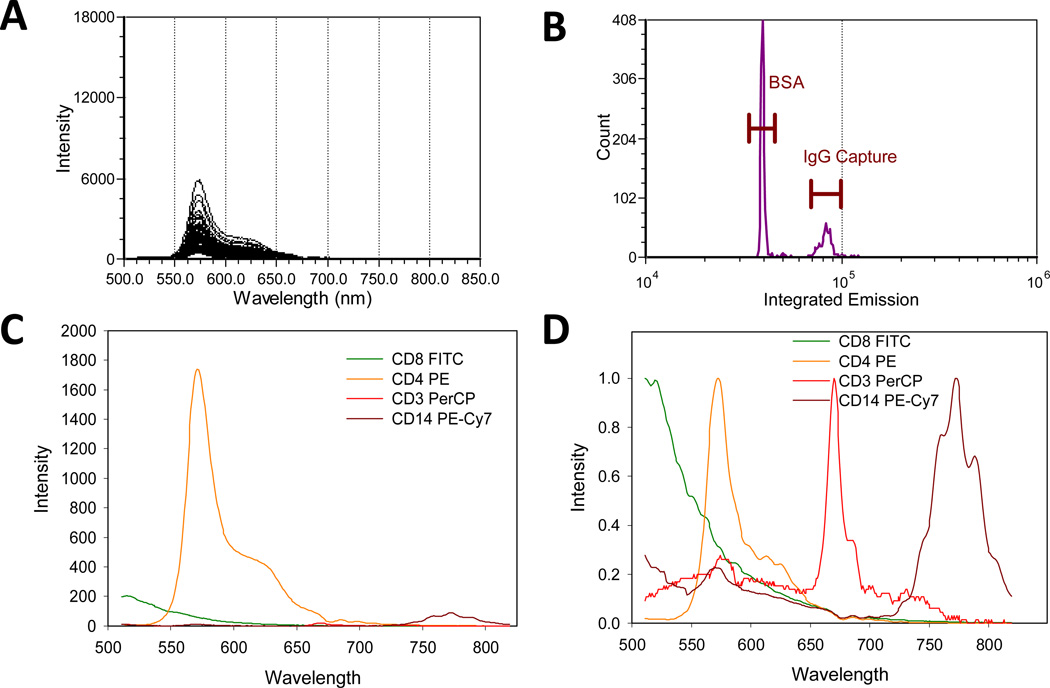
The experiments with beads above demonstrate the analytical performance of spectral flow cytometry and spectral unmixing in a well controlled system. To evaluate the performance of this approach in a typical immunophenotyping application using cells, we used spectral flow cytometry to analyze PBMCs stained with canonical surface markers used in lymphocyte sub-setting. To start, we stained a mixture of BSA- and anti-kappa antibody capture beads of BSA with fluorescence labeled antibodies and acquired reference spectra (488 nm excitation, 405 nm SSC triggering) for spectral unmixing (Figure 5). As with the QDots above, the intensity of the stained antibody capture beads varied with the antibody label (Figure 5C), with the PE labeled antibody being far brighter than the others, and PerCP showing the dimmest signal.
Figure 5.
Spectral flow cytometry of labeled antibodies on capture beads. (A) Single bead spectra and (B) intensity histograms of a BSA/antibody capture bead cocktail stained with PE-antiCD4 antibody. (C) Average spectra and (D) normalized average spectra of the bright antibody capture beads stained with FITC-antiCD8, PE-antiCD4, PerCP-antiCD3, and PECy7-antiCD14.
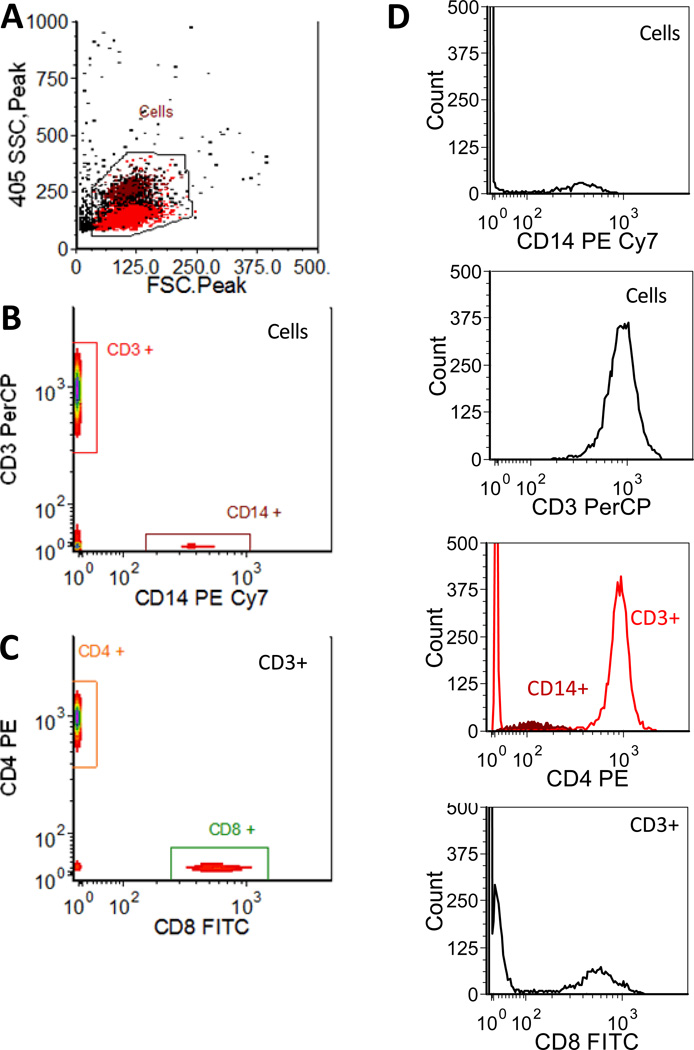
PBMCs stained with a cocktail of these antibodies were then analyzed using spectral flow cytometry. Presented in Figure 6 are light scatter and antibody abundance histograms resulting from spectral unmixing. As discussed above, the CLS unmixing approach used here takes the integrated emission intensity of the reference spectra for each label and normalizes the unmixing results such that the reference bead gives 1000 units, representing the abundance of each tag rather than the intensity. Despite the fact that the peak brightness of the fluorescence-labeled antibodies varied by nearly a factor of 200 (PE vs PerCP), spectral flow cytometry was able to clearly resolve CD14+ monocytes and CD3+ T cells (Figure 6B), as well as the CD4 and CD8 positive subsets (Figure 6C). Thus the dynamic range of the spectral FC measurement is more than adequate for common flow cytometry applications using conventional fluorophores. Inspection of the spectra of the gated cell subsets revealed other expected features, including the (relatively) dim staining of the CD14+ monocyte population (Figure 6D).
Figure 6.
Spectral flow cytometry of fluorescence-labeled PBMCs. A) Light scatter histogram showing back gating of CD3 and CD14 positive cells, B) bivariate histogram of CD3 vs CD14 staining, and C) bivariate histogram of CD4 vs CD8 for CD3 positive cells. (D) Single parameter histograms for each marker, with gates indicated.
Spectral Flow Cytometry of NIR Fluorophores
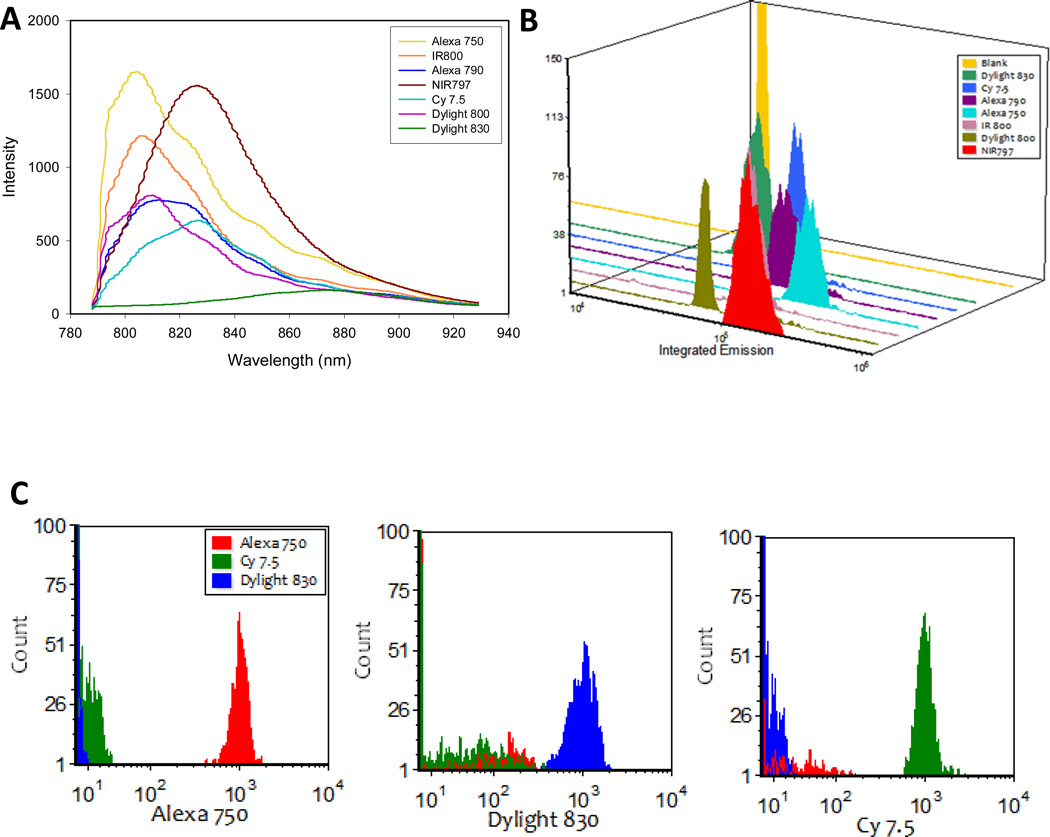
The spectral flow cytometry applications described above using visible excitation and emission can obviously be performed acceptably using the conventional approach of dichroic mirrors and band pass filters to select spectral bands for detection on PMTs. However, as one moves to the red and NIR region of the spectrum, decreased sensitivity of PMTs and brightness of available dyes combine to make detection challenging. Avalanche photodiodes (APDs) have been proposed (23, 24) as more capable detectors for dyes in this region of the spectrum, and CCDs also have excellent response in this spectral region. To evaluate the use of spectral flow cytometry for the analysis of NIR fluorescent labels, neutravidin or streptavidin conjugates of several NIR excited fluorophores were prepared or procured (Table 1). We characterized these reagents in terms of their fluorophore/protein ratio (F/P) and their quantum yield relative to free fluorophore (Qr), as well as measuring their staining of biotin microspheres using spectral flow cytometry (785 nm excitation, 785 nm SSC triggering). Exceptions were the streptavidin-Alexa 790, which was obtained already labeled from a commercial source and Dylight 830, which exhibited a shift in absorbance maximum upon conjugation that made it impossible to reliably determine these quantities. The spectra of the NIR labels varied to different degrees, and did their relative brighnesses (Figure 7A and B, Figure S4), and when the average spectra were used as references for CLS unmixing, fluorophores with similar spectra were difficult to resolve (Figure S5), resulting in cross talk in the unmixing results. However, when fluorophores with distinctive spectra were selected, CLS unmixing was able to clearly distinguish these, with resolution determined primarily by the relative brightness of the fluorophores. As presented in Figure 7C, Alexa750, Cy7.5, and DyLight 830 are readily resolved from each other using CLS unmixing, with the very dim DyLight 830 showing the poorest resolution from the other two dyes. These results using commercially available dyes show significant promise for increased use of the NIR for multicolor measurements, and the development of additional bright dyes with distinctive spectra would increase the number of probes that could be measured in this region of the optical spectrum.
Table 1.
Near infrared fluorophores used in this study
| Dye | Abs max (nm) |
Em max (nm) |
Extinction coefficient1 (M−1cm−1) |
F/P | Qr | Brightness (CV)2 |
|---|---|---|---|---|---|---|
| ALEXA 750 | 749 | 775 | 260,000 | 2.8 | nd | 150,354 (17%) |
| IRDye800 | 774 | 789 | 300,000 | 2.5 | 2.4 | 85,333 (15%) |
| DyLight 800 | 777 | 794 | 270,000 | 1.5 | 0.5 | 56,046 (8%) |
| Cy7.5 | 788 | 808 | 223,000 | 0.1 | 0.6 | 66,895 (15%) |
| ALEXA 790 | 785 | 810 | 260,000 | 0.4 | 1.2 | 77,805 (21%) |
| NIR797 | 795 | 817 | 94,100 | 2.7 | 0.6 | 153,402 (19%) |
| Dylight 830 | 730 | 830 | 220,000 | nd | nd | 25,452 (16%) |
Provided by manufacturer.
Median integrated emission.
nd, not determined
Figure 7.
Spectral flow cytometry of NIR fluorophores. A) Average spectra and B) integrated emission intensity histograms of biotinylated microspheres stained with one each of seven different NIR streptavidin/neutravidin conjugates. (C) Resolution of particles stained with one each of three different NIR fluorochromes using CLS spectral unmixing.
DISCUSSION
Since the earliest days of flow cytometry the notion of measuring complete fluorescence emission spectra has inspired many instrument development efforts (1–5, 7, 8). Recently, with the availability of improved optics, detectors and electronics, the promise of single cell flow spectroscopy is starting to be realized. We have developed spectral flow cytometers that employ high efficiency gratings and sensitive CCDs, as well as a data acquisition system and analysis software specifically designed to support high speed single cell spectroscopy. Here we demonstrate the performance of this system for the analysis of visible and NIR fluorescence in single cells.
As for conventional flow cytometry, fluorescent microspheres play an important role in characterizing and benchmarking system performance. Multifluorophore beads are useful as a reference sample to characterize performance from day to day, while beads bearing a specific fluorochrome that have been calibrated against a fluorophore solution allow absolute calibration of the instrument, which shows sensitivity comparable to conventional flow cytometers.
A key element in our system is the high speed CCDs available for spectral detection. These sensitive detectors, with quantum efficiencies well over 90 percent for much of the spectral range of interest, and provide performance comparable to conventional flow cytometers as evaluated using calibration beads. While the spectrograph grating disperses the light across many pixels of the CCD array, the capabilities of modern scientific CCD detectors enable on chip binning to “pool” detected photons into superpixels prior to chip readout, enhancing signal and minimizing the introduction of read noise. The CCDs used here were binned in the spectral dimension by factor of 5 (from 1600 to 320) or 4 (from 1024 to 256) for the visible and NIR CCDs, respectively, which maximized the photons detected per pixel without sacrificing spectral resolution, which was limited by the diameter of the optical fiber used and estimated to be 11.33 nm for the visible system and 3.23 nm for the NIR system.
With the on-chip binning in the fastest readout mode (full vertical binning, FVB) each event required 5.12 msec for readout, allowing a maximum event rate of 195 events per second. This is much longer than the sample integration time (~25 µsec), and could be reduced by use of a faster CCD detector, enabling analysis rates of thousands of events per second. Analysis speed may also be increased by the use of a multi-anode PMT as others have shown (9), but with a compromise of spectral resolution.
Spectral data presents new challenges and opportunities for flow cytometry. To accommodate this new data type we have developed a file format in which the conventional flow cytometer data in FCS format is stored together with the text format spectral data in a zip file. We developed a customized version of FCS Express 4 that can read this file format and that enables display and analysis of the spectral data. As shown in Figures 2 and 3, one can display the spectra from individual events, or the average spectra for all events within a gate. In addition, one can sum the spectral values within specified spectral ranges to create new parameters corresponding to the integrated signal in specific wavelength bands. This can be thought of as the application of virtual bandpass filters to the spectral data, providing significant flexibility for post-acquisition data analysis. Spectra can also be exported for more sophisticated spectral analysis in external programs.
For example, spectral data allows for more options for determining the contributions of multiple fluorophores than the conventional approach of bandpass filters combined with compensation to account for spectral overlap (or “bleed through”) between fluorophores. A commonly used and straightforward spectral analysis approach is CLS spectral unmixing, in which a set of known reference spectra are fit to the sample mixture spectra using a least squares routine to estimate the contribution of each component to the spectrum of the unknown sample. For spectral flow cytometry we developed a program in MatLab to use this approach to determine the amount of each fluorophore bound to a cell and return these results in a format that could be read into FCS Express 4 for display and further analysis. This CLS approach is well suited for cases where the component spectra are known and do not change, and performed well for as many as six different fluorescent labels (Figure 4) and in cases where both very bright and very dim labels were present on the same cell (Figure 6). In cases where the individual spectra are not known, or change, or when such assumptions are undesirable, a range of other unsupervised spectral analysis approaches can be employed, including principal component analysis (PCA), as has been described previously for Raman (13) and fluorescence (9) spectral flow cytometry.
Fluorophores with NIR emission present an interesting challenge and opportunity. Because of the fairly poor sensitivity of PMTs in the far red, this region of the optical spectrum is not heavily used, and fluorophore options are somewhat limited. Previous work explored the use of avalanche photodiodes for NIR detection in flow cytometry (23, 24). As we show here, the significantly better quantum efficiency of CCDs (~60–90%) in the NIR compared to PMTs (2–8%), coupled with spectral detection and unmixing, present the possibility of making more use of this spectral region. Of the seven different NIR excitable/emitting fluorophores we investigated here, at least three were shown to be bright enough and with sufficiently different spectral emission to be resolved by spectral flow cytometry and CLS spectral unmixing. With appropriate probe development, the NIR region of the optical spectrum may prove to be a source of significant expansion for the capabilities of multiparameter flow cytometry.
For fluorescence emission in the visible range, spectral flow cytometry using a high efficiency grating and high quantum efficiency CCD detector offers performance comparable to conventional flow cytometers that utilize high speed and high gain photomultiplier tubes, but with a significantly simplified optical path. Moreover, the nature of the digital CCD readout coupled with CLS unmixing allows the quantitative aspects of the fluorescence measurement to be accessed in a straightforward manner. PMTs have intrinsically faster response times compared to CCDs, however the readout speed of array detectors are increasing to the point where particle analysis rates of thousands per second can be achieved. Finally, spectral flow cytometry in the NIR provides some clear additional advantages in terms of increasing the numbers of optical parameters that can be measured simultaneously on single cells, and in a format that is compatible with conventional flow cytometry and cell sorting.
Supplementary Material
Acknowledgments
Supported by NIH/NIBIB Bioengineering Research Partnership EB003824
LITERATURE CITED
- 1.Asbury CL, Esposito R, Farmer C, van den Engh G. Fluorescence spectra of DNA dyes measured in a flow cytometer. Cytometry. 1996;24:234–242. doi: 10.1002/(SICI)1097-0320(19960701)24:3<234::AID-CYTO6>3.0.CO;2-H. [DOI] [PubMed] [Google Scholar]
- 2.Buican TN. Real-time Fourier transform spectrometry for fluorescence imaging and flow cytometry. 1990:126. [Google Scholar]
- 3.Dubelaar GBJ, Gerritzen PL, Beeker AER, Jonker RR, Tangen K. Design and first results of CytoBuoy: A wireless flow cytometer for in situ analysis of marine and fresh waters. Cytometry. 1999;37:247–254. [PubMed] [Google Scholar]
- 4.Fuller RR, Sweedler JV. Characterizing submicron vesicles with wavelength?resolved fluorescence in flow cytometry. Cytometry. 1996;25:144–155. doi: 10.1002/(SICI)1097-0320(19961001)25:2<144::AID-CYTO3>3.0.CO;2-H. [DOI] [PubMed] [Google Scholar]
- 5.Gauci M, Vesey G, Narai J, Veal D, Williams K, Piper J. Observation of single?cell fluorescence spectra in laser flow cytometry. Cytometry. 1996;25:388–393. doi: 10.1002/(SICI)1097-0320(19961201)25:4<388::AID-CYTO11>3.0.CO;2-R. [DOI] [PubMed] [Google Scholar]
- 6.Isailovic D, Li HW, Phillips GJ, Yeung ES. High-throughput single-cell fluorescence spectroscopy. Applied spectroscopy. 2005;59:221–226. doi: 10.1366/0003702053085124. [DOI] [PubMed] [Google Scholar]
- 7.Steen HB, Stokke T. Fluorescence spectra of cells stained with a DNA-specific dye, measured by flow cytometry. Cytometry. 1986;7:104–106. doi: 10.1002/cyto.990070117. [DOI] [PubMed] [Google Scholar]
- 8.Wade C, Rhyne R, Woodruff W, Bloch D, Bartholomew J. Spectra of cells in flow cytometry using a vidicon detector. Journal of Histochemistry & Cytochemistry. 1979;27:1049. doi: 10.1177/27.6.110874. [DOI] [PubMed] [Google Scholar]
- 9.Grégori G, Patsekin V, Rajwa B, Jones J, Ragheb K, Holdman C, Robinson JP. Hyperspectral cytometry at the single-cell level using a 32-channel photodetector. Cytometry Part A. 2011;81A:35–44. doi: 10.1002/cyto.a.21120. [DOI] [PubMed] [Google Scholar]
- 10.Robinson J, Patsekin V, Gregori G, Rajwa B, Jones J. Multispectral flow cytometry: Next generation tools for automated classification. Microscopy and Microanalysis. 2005;11:2–3. [Google Scholar]
- 11.Goddard G, Martin JC, Naivar M, Goodwin PM, Graves SW, Habbersett R, Nolan JP, Jett JH. Single particle high resolution spectral analysis flow cytometry. Cytometry Part A. 2006;69A:842–851. doi: 10.1002/cyto.a.20320. [DOI] [PubMed] [Google Scholar]
- 12.Sebba DS, Watson DA, Nolan JP. High throughput single nanoparticle spectroscopy. ACS Nano. 2009;3:1477–1484. doi: 10.1021/nn9003346. [DOI] [PMC free article] [PubMed] [Google Scholar]
- 13.Watson DA, Brown LO, Gaskill DF, Naivar M, Graves SW, Doorn SK, Nolan JP. A flow cytometer for the measurement of Raman spectra. Cytometry Part A. 2008;73A:119–128. doi: 10.1002/cyto.a.20520. [DOI] [PubMed] [Google Scholar]
- 14.Watson DA, Gaskill DF, Brown LO, Doorn SK, Nolan JP. Spectral measurements of large particles by flow cytometry. Cytometry Part A. 2009;75A:460–464. doi: 10.1002/cyto.a.20706. [DOI] [PMC free article] [PubMed] [Google Scholar]
- 15.Nolan JP, Duggan E, Liu E, Condello D, Dave I, Stoner SA. Single cell analysis using surface enhanced Raman scattering (SERS) tags. Methods. 2012;57:272–279. doi: 10.1016/j.ymeth.2012.03.024. [DOI] [PMC free article] [PubMed] [Google Scholar]
- 16.Nolan JP, Sebba DS. Surface-Enhanced Raman Scattering (SERS) Cytometry. In: Paul M, editor. Methods in Cell Biology. Volume 102. Academic Press; 2011. pp. 515–532. [DOI] [PMC free article] [PubMed] [Google Scholar]
- 17.Chase ES, Hoffman RA. Resolution of dimly fluorescent particles: A practical measure of fluorescence sensitivity. Cytometry. 1998;33:267–279. [PubMed] [Google Scholar]
- 18.Hoffman RA, Wood J. Characterization of flow cytometer instrument sensitivity. Current Protocols in Cytometry. 2007 doi: 10.1002/0471142956.cy0120s40. [DOI] [PubMed] [Google Scholar]
- 19.Wood JCS, Hoffman RA. Evaluating fluorescence sensitivity on flow cytometers: An overview. Cytometry. 1998;33:256–259. [PubMed] [Google Scholar]
- 20.Krutzik PO, Nolan GP. Fluorescent cell barcoding in flow cytometry allows high-throughput drug screening and signaling profiling. Nature Methods. 2006;3:361–368. doi: 10.1038/nmeth872. [DOI] [PubMed] [Google Scholar]
- 21.Hadrup SR, Bakker AH, Shu CJ, Andersen RS, van Veluw J, Hombrink P, Castermans E, Thor Straten P, Blank C, Haanen JB. Parallel detection of antigen-specific T-cell responses by multidimensional encoding of MHC multimers. Nature methods. 2009;6:520–526. doi: 10.1038/nmeth.1345. [DOI] [PubMed] [Google Scholar]
- 22.Newell EW, Klein LO, Yu W, Davis MM. Simultaneous detection of many T-cell specificities using combinatorial tetramer staining. Nature Methods. 2009;6:497–499. doi: 10.1038/nmeth.1344. [DOI] [PMC free article] [PubMed] [Google Scholar]
- 23.Lawrence WG, Varadi G, Entine G, Podniesinski E, Wallace PK. Enhanced red and near infrared detection in flow cytometry using avalanche photodiodes. Cytometry Part A. 2008;73A:767–776. doi: 10.1002/cyto.a.20595. [DOI] [PMC free article] [PubMed] [Google Scholar]
- 24.Stewart CC, Woodring ML, Podniesinski E, Gray B. Flow cytometer in the infrared: Inexpensive modifications to a commercial instrument. Cytometry Part A. 2005;67A:104–111. doi: 10.1002/cyto.a.20166. [DOI] [PubMed] [Google Scholar]
Associated Data
This section collects any data citations, data availability statements, or supplementary materials included in this article.


