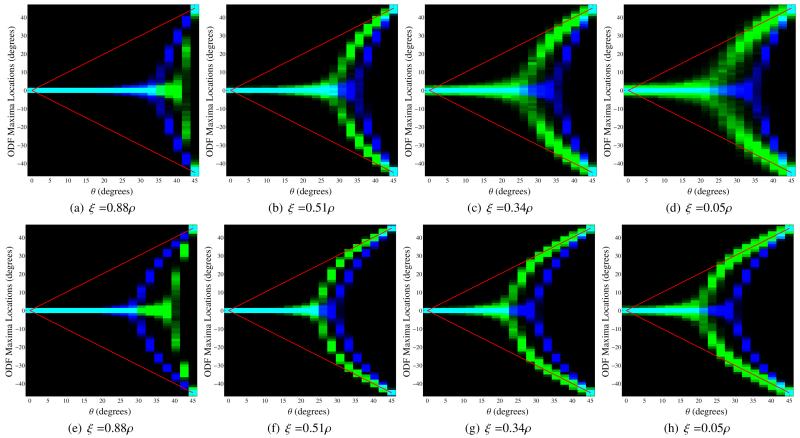
Figure 10.
Histograms for the locations of local maxima extracted from the FRT profiles (in blue) and the FRACT profiles (in green) for two simulated tensors in the x-y plane with orientation angles of −θ and +θ in polar coordinates. The color scale is set to saturate at 250 counts in a single histogram bin for improved visualization. The true orientations of the two tensors are also indicated using red lines. All simulations used SNR=80, N = 256, and L = 8. The images from left to right show results for different values of the FRACT parameter ξ. Results are shown for (a)-(d) a b-value of 1000 s/mm2 and (e)-(h) a b-value of 2000 s/mm2.

