Abstract
Toxoplasma gondii is an obligate intracellular parasite of the phylum Apicomplexa, which includes a number of species of medical and veterinary importance. Inhibitors of lysine deacetylases (KDACs) exhibit potent antiparasitic activity, suggesting that interference with lysine acetylation pathways hold promise for future drug targeting. Using high resolution LC-MS/MS to identify parasite peptides enriched by immunopurification with acetyl-lysine antibody, we recently produced an acetylome of the proliferative intracellular stage of Toxoplasma. In this study, we used similar approaches to greatly expand the Toxoplasma acetylome by identifying acetylated proteins in non-replicating extracellular tachyzoites. The functional breakdown of acetylated proteins in extracellular parasites is similar to intracellular parasites, with an enrichment of proteins involved in metabolism, translation, and chromatin biology. Altogether, we have now detected over 700 acetylation sites on a wide variety of parasite proteins of diverse function in multiple subcellular compartments. We found 96 proteins uniquely acetylated in intracellular parasites, 216 uniquely acetylated in extracellular parasites, and 177 proteins acetylated in both states. Our findings suggest that dramatic changes occur at the proteomic level as tachyzoites transition from the intracellular to extracellular environment, similar to reports documenting significant changes in gene expression during this transition. The expanded dataset also allowed a thorough analysis of the degree of protein intrinsic disorder surrounding lysine residues targeted for this post-translational modification. These analyses indicate that acetylated lysines in proteins from extracellular and intracellular tachyzoites are largely located within similar local environments, and that lysine acetylation preferentially occurs in intrinsically disordered or flexible regions.
Keywords: parasite, proteomics, acetylation, lysine, Apicomplexa, tachyzoite
Introduction
Toxoplasma gondii is an obligate, intracellular parasite of the phylum Apicomplexa, of which a number of medically important human pathogens are members. This protozoan parasite displays remarkable distribution throughout the world with estimates that it has chronically infected up to 30% of the human population.1 Toxoplasma has attained this cosmopolitan distribution largely due to its ability to convert into a latent tissue cyst known as the bradyzoite. Chronic infection with latent bradyzoite cysts is asymptomatic in immunocompetent individuals; however, upon host immunosuppression (due to chemotherapy, organ transplantation, or HIV infection) the parasite reconverts into its proliferative tachyzoite form, which causes severe tissue damage that can result in organ failure and death.2 While an important human pathogen in its own right, its ease of in vitro culture and genetic tractability also make Toxoplasma an attractive model for other apicomplexan parasites such as Plasmodium.
Traditionally studied in the context of histone modification and epigenetic gene regulation, lysine acetylation has recently emerged as a widespread post-translational modification (PTM) found on proteins involved in almost every cellular function.3 Recent studies have clearly illustrated that lysine acetylation is detected on many non-histone substrates, including other nuclear proteins as well as proteins located in the cytoplasm and mitochondria.4, 5 Acetylated proteins have functions in metabolism, mRNA translation, protein folding, DNA packaging, and the cytoskeletal system. The development of specific acetyl-lysine antibodies has allowed analyses of acetylation at the whole-proteome level, and the resulting “acetylomes” have been described for prokaryotes,6–8 plants,9, 10 Drosophila melanogaster,11 human cells,3, 12, 13 and most recently for the intracellular Toxoplasma tachyzoite.14
Acetylation is a reversible PTM that may affect protein stability, localization, activity, or protein-protein interactions. How the modification affects an individual protein is dependent on the function of the protein, as well as the context of the modified lysine with respect to other PTMs.15 The abundance of reversible Nε-acetylation on very different proteins underscores the regulatory potential of this modification, which has led to the idea that acetylation may rival phosphorylation as a signaling modality.4, 16 In this context, it is not surprising that dysregulation of lysine acetylation has been linked to cancer, aging, and neurological disease.17–19
PTMs extend the range of amino acid structures and properties, thereby diversifying protein structure and function.20 DNA encodes for 20 primary amino acids, yet proteins contain more than 140 different residues due to various PTMs. All amino acid side chains are known to undergo chemical diversification due to various PTMs and altogether there are more than 300 different PTM types described in literature.21 PTMs are generally catalyzed by specialized enzymes that recognize specific target sequences within a protein. Some PTMs (e.g., phosphorylation and acetylation) are reversible through the action of specific deconjugating enzymes. The interplay between modifying and demodifying enzymes allows for rapid and economical control of protein function. In higher eukaryotes, as much as 5% of the genome is expected to encode enzymes related to the post-translational modification of the proteome.20
It has been proposed that PTMs can be classified by taking into account the conformational state of the site where the modification takes place.22, 23 Bioinformatics analysis has revealed that many PTMs are located within intrinsically disordered regions. Among this group of PTMs are phosphorylation, acetylation, acylation, adenylylation, ADP ribosylation, amidation, carboxylation, formylation, glycosylation, methylation, sulfation, prenylation, ubiquitination, and Ubl-conjugation (i.e., covalent attachment of ubiquitin-like proteins, including SUMO, ISG15, Nedd8, Atg8, etc.).22, 23 This observation is in line with the notion that intrinsic disorder (i.e., lack of ordered structure in a functional protein or a protein region) is crucial for biological functions. In fact, it is clear now that intrinsically disordered proteins (IDPs) and intrinsically disordered protein regions (IDPRs) are abundantly involved in numerous biological processes,22, 24–67 where they are found to play different roles in regulation of the function of their binding partners and in promotion of the assembly of supra-molecular complexes. The conformational plasticity associated with intrinsic disorder provides IDPs/IDPRs with a wide spectrum of exceptional functional advantages over the functional modes of ordered proteins and domains.24, 26, 28–30, 37–39, 45–47, 49, 53 For example, the high accessibility of sites within the disordered proteins simplifies their post-translational modifications, such as phosphorylation, acetylation, lipidation, ubiquitination, sumoylation, etc., allowing for a simple mean of the modulation of their biological functions.53 Many IDPRs contain specific identification regions via which they are involved in various regulation, recognition, signalingand control pathways.37, 39 Conformational plasticity confers numerous advantages to the intrinsic disorder-based protein interactions.24, 26, 45, 68–71 Some of these advantages are: (i) Decoupled specificity and strength of binding resulting in high-specificity-low-affinity interactions; (ii) Increased speed of interaction due to greater capture radius and the ability to spatially search through interaction space; (iii) The ability for fast formation of encounter complexes that relaxes spatial orientation requirements; (iv) Increased interaction surfaces; (v) The ability to fold to different conformations according to the templates provided by binding partners; (vi) The existence of multiple linear binding epitopes; (vii) The existence of overlapping binding sites due to extended linear conformation; (viii) The ability of a single disordered region to bind to several structurally diverse partners; (ix) The ability of many different proteins to bind to a single partner. The combination of high specificity with low affinity defines the broad utilization of intrinsic disorder in regulatory interactions where turning a signal off is as important as turning it on.26
Furthermore, many IDPs/IDPRs possess complex “anatomy” (they contain multiple, relatively short functional elements), which contributes to their unique “physiology” (an ability to be involved in interaction with, regulation of, and control by multiple structurally unrelated partners). Given the existence of multiple functions in a single disordered protein, and given that each functional element is typically relatively short, alternative splicing could readily generate a set of protein isoforms with a highly diverse set of regulatory elements.72 The complexity of the disorder-based interactomes is further increased due to the ability of a single IDPR to bind to multiple partners gaining very different structures in the bound state.49
IDPs can form highly stable complexes, or be involved in signaling interactions where they undergo constant “bound-unbound” transitions, thus acting as dynamic and sensitive “on-off” switches. The ability of these proteins to return to the highly flexible conformations after the completion of a particular function, and their predisposition to gain different conformations depending on the environmental peculiarities, are unique physiological properties of IDPs which allow them to exert different functions in different cellular contests according to a specific conformational state.53
The ability to be modulated by various PTMs is a key functional advantage of IDPs/IDPRs. The importance of intrinsic disorder as it pertains to the catalysis of different PTMs is well illustrated by kinases. It is estimated that the function of one-third of eukaryotic proteins is controlled via phosphorylation/dephosphorylation cycles that originate from carefully regulated protein kinase and phosphatase activities.73 Eukaryotic protein kinases constitute one of the largest gene families, e.g., yeast kinome includes 119 kinases, Arabidopsis thaliana contains 1019 kinase- and 300 phosphatase-coding genes, the mouse kinome includes 540 kinases, and the human genome contains ~520 genes encoding kinases and more than 150 genes encoding phosphatases.23 However, in any given proteome, the number of kinases and phosphatases is noticeably smaller than the number of potential substrates. On average, each eukaryotic protein kinase serves ~20 substrates, whereas each human phosphatase is expected to dephosphorylate ~65 clients. Although phosphorylation by each kinase is a highly specific process, kinase substrates typically bind to the enzyme with weak affinity. A combination of high specificity and low affinity is characteristic of intrinsic disorder-based signaling interactions.74–79
As with many reversible PTMs catalyzed by specific enzymes, acetylation is expected to predominantly occur in intrinsically disordered regions. We addressed this hypothesis by performing a comprehensive bioinformatics analysis of the Toxoplasma acetylome. We have previously reported the acetylome of the actively replicating, intracellular Toxoplasma tachyzoite.14 To further elucidate functional roles that may exist for protein acetylation in Toxoplasma, and to investigate if the protein acetylation landscape changes as the tachyzoites transition from one environment to another, we carried out an acetylome analysis on recently egressed tachyzoites. Using extracellular parasites, we detected novel protein lysine acetylation sites across an additional 267 proteins. The expanded dataset including all acetylated lysines detected in Toxoplasma to date was used to analyze the characteristics of the amino acid sequences flanking the targeted lysine residue. We want to emphasize here that the major focus of our study is at the disorder status of acetylated and non-acetylated lysines in Toxoplasma, and that this work should not be understood as a quantitative analysis of differences between intra- and extracellular parasites.
Methods
Preparation of parasites for acetylome analysis
Immortalized human foreskin fibroblasts (hTERT) host cells were grown to confluency in DMEM supplemented with 10% heat-inactivated fetal bovine serum, maintained at 37°C in 5% CO2 in a humidified incubator. Toxoplasma RH strain was allowed to infect hTERT monolayers in DMEM supplemented with 1% fetal bovine serum (Invitrogen). Extracellular tachyzoites were harvested 1–2 hours post-egress, when approximately 95% of the host cell monolayer had been lysed. The preparation of the parasite lysate, acetyl-peptide immunopurification, and analysis by LC-MS/MS was performed as described previously.14 The mzXML, Dtas and Out files associated with this manuscript may be downloaded from ProteomeCommons.org Tranche using the following hash: “7a4RlqaXAxoPSLW/iJ0fxYON0FPw5X3a93rpHqUco2fTovcvKtfj6G6kB0PGs6tMUj6YEJW+NPCWkk0DxLbb39vi2uQAAAAAAAAJIw==”.
Data analysis and bioinformatics
Acetylated proteins were classified according to Gene Ontology (GO) annotations as listed on the Toxoplasma sequence database (ToxoDB 7.0, www.toxodb.org) and Uniprot (http://www.ebi.ac.uk/uniprot/). When a single peptide could be matched to two or more different proteins, manual inspection of gene expression and proteomics data from ToxoDB 7.0 usually allowed determination of the likely protein from which the peptide was derived. If such an inference was not possible, the peptide was omitted from the rest of the analysis.
Analysis of disordered regions
Predictions of intrinsic disorder in proteins were performed using a PONDR® VLXT predictor, access to which was provided by Molecular Kinetics, Inc. (http://www.pondr.com). PONDR® (Predictor Of Natural Disordered Regions) is a set of neural network predictors of disordered regions on the basis of local amino acid composition, flexibility, hydropathy and other factors. These predictors classify each residue within a sequence as either ordered or disordered. PONDR® VLXT integrates three feed forward neural networks: the Variously characterized Long, version 1 (VL1) predictor, which predicts non-terminal residues.70, and the X-ray characterized N- and C- terminal predictors (XT), which predicts terminal residues.80 Output for the VL1 predictor starts and ends 11 amino acids from the termini. The XT predictors output provides predictions up to 14 amino acids from their respective ends. A simple average is taken for the overlapping predictions; and a sliding window of 9 amino acids is used to smooth the prediction values along the length of the sequence. Unsmoothed prediction values from the XT predictors are used for the first and last 4 sequence positions.
In addition to PONDR® VLXT, intrinsic disorder in intracellular and extracellular Toxoplasma tachyzoites was evaluated by IUPred,81 which predicts intrinsic disorder in protein regions from their amino acid sequences by estimating the total pair-wise inter-residue interaction energy in a protein sequence. This tool is based on the assumption that IDP/IDPR sequences do not fold due to the lack of the sufficient number of stabilizing inter-residue interactions.81
Composition profiling
Compositional profiling is a computational tool for the automated detection of enrichment or depletion patterns of individual amino acids or groups of amino acids classified by several physico-chemical and structural properties in a set of query proteins.82 The calculations were performed using a normalization procedure elaborated for analysis of intrinsically disordered proteins.82 Using this method, compositional profiling is based on the evaluation of the (Cs1 − Cs2)/Cs2 values, where Cs1 is a content of a given residue in a query set of proteins of interest and Cs2 is the corresponding value for the sample set of proteins (e.g., set of ordered proteins from PDB). In this presentation, negative values correspond to residues that are depleted in a given dataset in comparison with a set of ordered proteins, whereas positive values correspond to residues that are overrepresented in the set.
Results and Discussion
Acetylated proteins in extracellular Toxoplasma tachyzoites
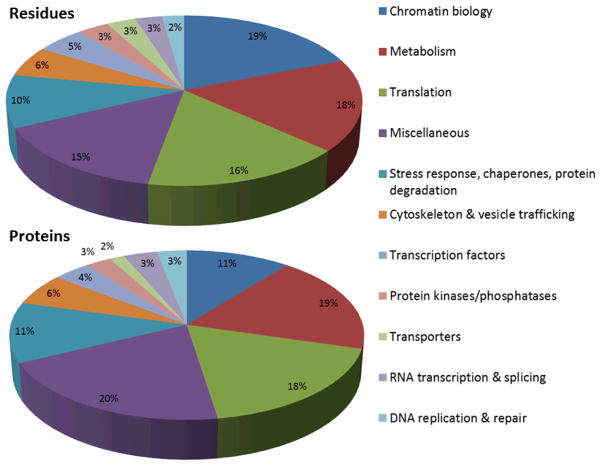
In a previous study, we mapped the acetylome of actively proliferating intracellular tachyzoites, identifying 411 lysine acetylation sites across 274 proteins.14 Using the same techniques, we have now determined an acetylome for non-replicating tachyzoites that have freshly egressed from their human host cells. Proteomic analysis of these extracellular tachyzoites identified 571 acetylated lysines across 386 proteins (Supplemental Table 1). 177 of these acetylation marks on 119 proteins were also detected in intracellular tachyzoites14 (Supplemental Table 1). The functional breakdown of acetylated proteins in extracellular parasites is similar to intracellular parasites, with an enrichment of proteins involved in metabolism, translation, and chromatin biology (Figure 1). However, a number of categories are populated with different proteins between the two states, suggesting a change in acetylation status as the parasite switches from its intracellular to extracellular environment. This is not surprising since tachyzoites are actively replicating only when inside a nutrient-rich host cell; indeed, significant changes in mRNA expression have been documented for parasites transitioning between extracellular and intracellular environments.83 Using metabolic proteins as an example, lactate dehydrogenase (TGME49_032350) was not found to be acetylated in intracellular parasites, but was acetylated on four residues in extracellular parasites. Phosphoglycerate kinase (TGME49_118230) was acetylated on five residues in the intracellular state, although only one of these marks was observed in extracellular parasites. An additional acetylated lysine was observed on a phosphoglycerate kinase paralogue (TGME49_022020) that was not analogous to any of the acetylated lysines found on TGME49_118230.
Figure 1. Overview of the extracellular tachyzoite acetylome.
Lysine acetylation occurs on proteins associated with virtually every cellular process, but the majority of acetylation occurs on proteins involved in metabolism, translation, and chromatin biology. The pie chart on the right shows the functional categorization of the 571 acetylated residues found across the 386 acetylated proteins, which are displayed in the left pie chart. Acetylation of the 172 lysines across 125 hypothetical proteins was omitted in these pie charts.
The most extensively acetylated protein is once again the porin, voltage-dependent anion channel 1 (VDAC1, TGME49_063300). In addition to the 7 sites previously shown to be acetylated in intracellular parasites,14 we detected two additional lysines on porin that are acetylated in extracellular parasites (K55 and K242).
A total of 51 ribosomal acetyl marks were identified in both intra- and extracellular tachyzoites, however, only twelve of these marks were conserved in both states (Supplemental Table 1). The differences in ribosomal protein acetylation suggest that there may be distinct ribosome acetylation profiles associated with active and inactive ribosomes, which could be relevant to the observed global down-regulation of translation in egressed parasites.84 Further experimentation is required to test if ribosomal protein acetylation serves as another level of translational control.
As seen in the intracellular tachyzoite acetylome, there is extensive acetylation of chromatin and chromatin modification machinery in extracellular parasites (Supplemental Table S1). ADA2-A is a transcriptional activator that recruits the lysine acetyltransferase TgGCN5-B to nucleosomes for modulation of gene expression through acetylation of its histone substrates.85 Acetylation of ADA2-A was detected in extracellular parasites on three lysines, two of which (K245 and K250) lie within the TgGCN5-B interaction domain. It is possible that the change in acetylation status of these residues govern ADA2-A and TgGCN5-B association and that TgGCN5-B itself may regulate this interaction by acetylating ADA2-A. Interesting differences in acetylation were also found among the unique lineage of putative transcription factors harboring a plant-like AP2 DNA-binding domain. We found 8 acetylated lysines on 5 AP2 proteins in intracellular tachyzoites, 16 acetylated lysines on 8 AP2 proteins in extracellular parasites, and 4 acetylated lysines on 3 AP2 proteins in both states. For the first time, we also detected a lysine within a predicted AP2 domain (K570 on TGME49_014840). While it remains to be experimentally tested, acetylation of a residue within the AP2 domain may alter DNA-binding properties.
Overall disorder status of acetylated and non-acetylated lysines in extracellular and intracellular tachyzoites
It is recognized now that intrinsic disorder is a highly heterogeneous phenomenon that can manifest itself differently at different levels of proteins structural organization.39, 53 Therefore, the combined analysis of the intrinsic disorder propensity by several computational tools (especially by tools that utilizes different attributes) provides additional advantages,86–88 allowing better visualization of the differences between the various protein groups.59, 89 Based on these premises, the prevalence of intrinsic disorder in regions containing acetylated and non-acetylated lysines in acetylated proteins from intracellular and extracellular Toxoplasma tachyzoites was evaluated by two orthogonal computational tools, PONDR® VLXT and IUPred.
As mentioned above, PONDR® VLXT applies various compositional probabilities and hydrophobic measures of amino acid as the input features of artificial neural networks for the prediction.70 This predictor uses three different neural networks, one for each terminal region and one for the internal region of the sequence. Each neural network is trained by a specific dataset containing only the amino acid residues of that specific region. The final prediction result uses the individual predictors in their respective regions. The transition from one predictor to another is accomplished by computing the average scores of the two predictors for a short region of overlap at the boundary between the two regions. The input features of neural networks include selected compositions and profiles from the primary sequences. PONDR® VLXT may underestimate the occurrence of long disordered regions in proteins. Although it is no longer the most accurate predictor, it is very sensitive to the local compositional biases and therefore it has significant advantages in finding potential binding sites within IDPs/IDPRs.90, 91
IUPred is based on the hypothesis that globular proteins have larger numbers of effective inter-residue interactions (negative free energy) than disordered proteins due to the different types of amino acids involved in possible residue contacts. Based on this idea, a composition-based pair-wise interaction matrix was shown to give values similar to those obtained from a structure-based interaction matrix. Structured and disordered proteins were compared by this approach, with the structured proteins found to have a significantly lower free energy estimate, thus giving a means to predict whether a protein is structured or disordered using amino acid sequence as input.81
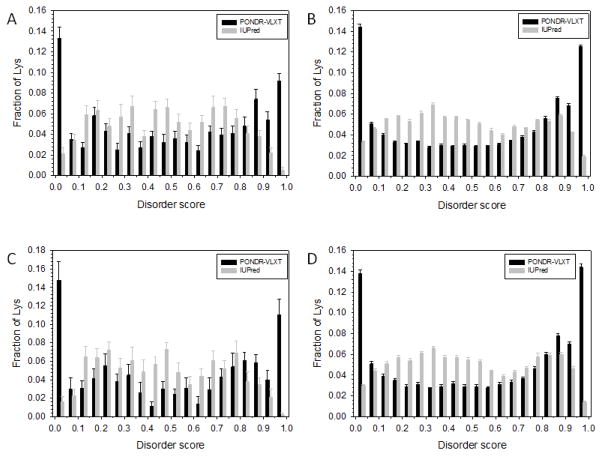
Figure 2 represents the results of the analysis of the prevalence of intrinsic disorder in regions containing acetylated and non-acetylated lysines in acetylated proteins from the extracellular and intracellular tachyzoites. Here, the predisposition for intrinsic disorder in different dataset is shown as fractions of lysines with corresponding intrinsic disorder scores. Figure 2 shows that the disorder statuses of acetylated and non-acetylated lysines are rather different for both extracellular and intracellular tachyzoites, whereas there is a little pair-wise difference between the plots corresponding to the proteins derived from the extracellular and intracellular tachyzoites (i.e., acetylated (non-acetylated) lysines in the extracellular tachyzoite are similar to acetylated (non-acetylated) lysines in the intracellular tachyzoite). Figure S1 provides more detailed analysis of the results of disorder prediction by these two tools and shows that the correlation coefficients between PONDR® VLXT and IUPred predictions for intracellular and extracellular acetylated lysines are 0.70 and 0.72, respectively. Despite the differences in the outputs generated by PONDR® VLXT and IUPred, both predictors generally agreed on the existence of differences between the datasets and showed that non-acetylated lysines were typically characterized by a bit higher disorder scores than acetylated lysines. For example, in the extracellular tachyzoite, the mean disorder scores of acetylated lysines were 0.511±0.301 (PONDR® VLXT) and 0.475±0.217 (IUPred), whereas non-acetylated lysines were characterized by the disorder scores of 0.535±0.321 (PONDR® VLXT) and 0.482±0.237 (IUPred). Similarly for the intracellular tachyzoite, the mean disorder scores of acetylated lysines were 0.499±0.310 (PONDR® VLXT) and 0.471±0.213 (IUPred), whereas non-acetylated lysines were characterized by the disorder scores of 0.541±0.320 (PONDR® VLXT) and 0.488±0.236 (IUPred). Although these differences were not very significant, they were reproducible since both predictors showed somewhat higher disorder score for the non-acetylated lysines.
Figure 2. Comparison of the disorder status of acetylated and non-acetylated lysines in the extracellular and intracellular tachyzoites.
Here, the distributions of lysines over the various ranges of disorder score are shown. Comparison of the outputs of the PONDR® VLXT (black bars) and IUPred (gray bars) for the acetylated (A) and non-acetylated (B) lysines in the extracellular tachyzoites, and for the acetylated (C) and non-acetylated (D) lysines in the intracellular tachyzoites. Here, the distributions of lysines over the various ranges of disorder score are shown for different datasets. Error bars corresponds to the errors evaluated by bootstrapping.
Peculiarities of disorder distribution of acetylated lysines in intracellular tachyzoites
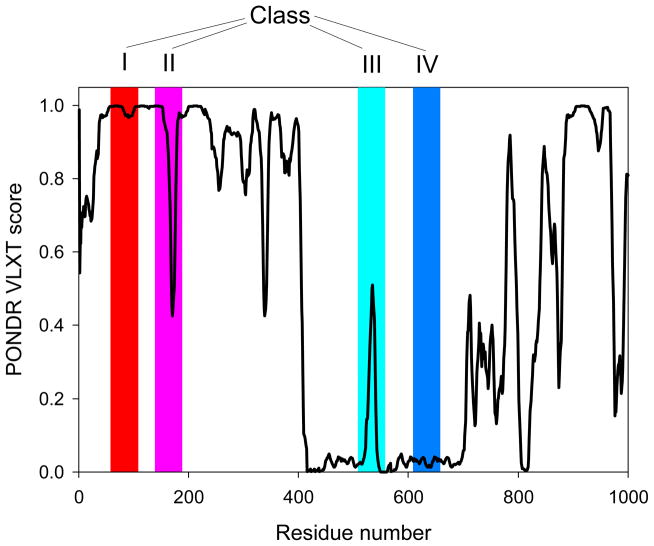
Our analysis revealed that in intracellular Toxoplasma tachyzoites, lysine acetylation preferentially occurs in intrinsically disordered or flexible regions. This conclusion follows from several observations. The application of the PONDR® VLXT predictor to the 274 acetylated proteins from intracellular Toxoplasma tachyzoites14 revealed that there is a strong correlation between acetylation and protein intrinsic disorder, and many of the 411 acetylated lysines were predicted as intrinsically disordered residues (i.e., residues with a disorder score >0.5). To systematically investigate the local environment of the acetylated lysines within the intracellular tachyzoite proteins (i.e., to see whether lysines were located inside disordered or ordered regions), a recently developed computational approach was used.92 There are four potential scenarios for the acetylated lysines and their local environment that were grouped into the following classes (Figure 3): Class I, a disordered acetylated lysine is located inside a disordered region; Class II, an ordered acetylated lysine is located inside a disordered region; Class III, a disordered acetylated lysine is located inside an ordered region; Class IV, an ordered acetylated lysine is located inside an ordered region. These four scenarios can be clearly distinguished in PONDR® VLXT plots (see Figure 3), with peptides from Classes II and III appearing as characteristic “dips” or “spikes”, respectively, in the corresponding disorder curves.92 Therefore, differences across local sequence environments of acetylated lysines can be evaluated computationally by analyzing the disorder scores computed for the target lysine within fragments of increasing length.
Figure 3. Classification of lysines based on their local environment within the sequences of parent proteins.
Class I, a disordered lysine is located inside a disordered region; Class II, an ordered lysine is located inside a disordered region; Class III, a disordered lysine is located inside an ordered region; and Class IV, an ordered lysine is located inside an ordered region. PONDR® VLXT curve of a model protein is shown and positions of mentioned classes are shown as red, pink, cyan, and blue shaded areas. This plot contains a model disorder profile to illustrate principle of analysis.
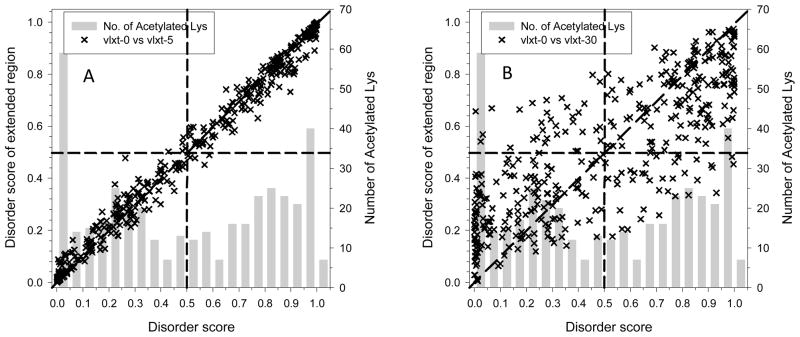
Figure 4 represents the results of this analysis, where the original averaged disorder scores of acetylated lysines in the intracellular tachyzoite were set on the x-axis and the averaged disorder scores for various extensions of regions containing acetylated lysines were projected on the y-axis. Ascending scores on the y-axis indicates a bias for the acetylated lysine to be within long disordered regions, and vice versa. For Classes I and IV, such extensions are not supposed to reveal noticeable changes in the averaged disorder scores. Conversely, Class II acetylated lysines would clearly show decreased disorder scores by such an operation. An increase in averaged disorder score would indicate acetylated lysines assigned to Class III. Averaged disorder scores were computed for sequences comprised of 5 or 30 amino acids flanking the lysine (Figures 4A and 4B, respectively). Disorder scores using amino acid extensions of varying lengths between 5 and 30 residues are shown in Supplementary Figure S2. Figure 4 shows that acetylated lysines with disorder scores <0.5 (i.e., predicted to be ordered) were commonly found within disordered regions (symbols in the lower-left quadrant above the diagonal in Figure 4) or were shown to have much higher flexibility than neighboring amino acids (symbols in the lower-left quadrant below the diagonal in Figure 4).
Figure 4. Disorder scores of acetylated lysines and analysis of their local environment.
The disorder score of each acetylated lysine in the 274 proteins from intracellular tachyzoites was predicted using PONDR® VLXT. The influence of neighboring residues was measured by averaging disorder scores over peptides centered at the target lysine but extended on both sides by a specific number of residues. The length of the extension is 5 (A) or 30 residues (B) and the corresponding scores are labeled as vlxt-5 and vlxt-30; vlxt-0 represents the original prediction score without an extension. Each “x” in the figure is an acetylated lysine. The x-axis displays the original disorder scores for the acetylated lysines and the y-axis displays the average disorder score over the extended regions. The gray bars represent the distribution of the original PONDR® VLXT scores for the acetylated lysines. Similar plots generated for vlxt-10, vlxt-15, vlxt-20, and vlxt-25 are shown in Supplementary Figure S2.
Comparison of acetylated and non-acetylated lysines in intracellular tachyzoites
In addition to 411 acetylated lysines, we also analyzed the 12,883 non-acetylated lysines in the 274 acetylated proteins from the intracellular tachyzoites. Figure 5A represents the distribution of acetylated and non-acetylated lysines with varying ranges of disorder score, showing that acetylated and non-acetylated lysines possess a different predisposition for disorder. The results of the analysis of the local environment of the non-acetylated lysines are shown in Figure 5B, in a form of the distributions of non-acetylated lysines in various ranges of disorder score calculated for the extended regions of varying length from the target lysine. Similar to what we observed for the acetylated lysines, this analysis reveals that the non-acetylated lysines are also frequently located within disordered regions.
Figure 5. Analysis of the intrinsic disorder status of acetylated and non-acetylated lysines in intracellular tachyzoites.
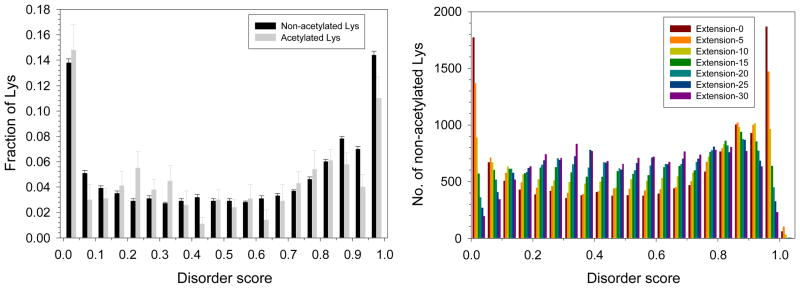
A. Distribution of acetylated (gray bars) and non-acetylated lysines (black bars) over the various ranges of disorder score. Each bar represents the fraction of acetylated or non-acetylated lysines for a given disorder score evaluated by PONDR® VLXT. Error bars corresponds to the errors evaluated by bootstrapping. B. Analysis of the local environment of non-acetylated lysines within the amino acid sequences of 274 tachyzoite proteins represented as changes in the averaged PONDR® VLXT score distribution for the non-acetylated lysines. Extension-0 is from the original PONDR® VLXT score. Extension-N corresponds to the averaged disorder score calculated for a lysine-containing region extended by N amino acids at each termini.
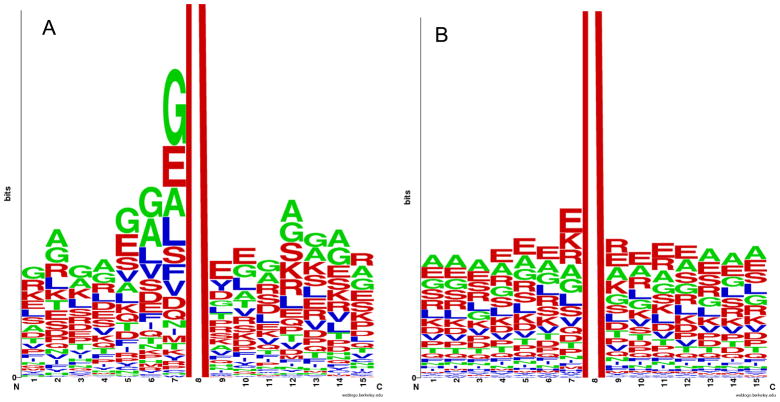
Based on the results of these analyses one might conclude that both types of lysine-containing fragments (acetylated and non-acetylated) are expected to be disordered. However, there is some difference between these two classes of fragments, with acetylated peptides expected to be a bit less prone for disorder. This observation is supported by Figure 6, which represents the logo profiles of acetylated and non-acetylated peptides (15-mers) in which lysine is located at the middle position. Neighboring residues are colored according to their disorder propensities, with disorder-promoting in red, order-promoting in blue, and neutral in green. Comparison of these plots shows that acetylated peptides have noticeable bias in the residues surrounding the target lysine, whereas residues in the non-acetylated peptides are distributed more evenly. Furthermore, Figure 6A shows that the acetylated peptides typically contain hydrophobic/aromatic residues in close proximity to the acetylated lysine, whereas the environment of non-acetylated lysines is typically much less biased (Figure 6B).
Figure 6. Analysis of sequences flanking lysines targeted for acetylation.
Logo representation of the amino acids flanking acetylated (A) and non-acetylated (B) lysines in 274 proteins from intracellular tachyzoites. Residues are colored according to their disorder propensities – disorder-promoting (red), order-promoting (blue), neutral (green).
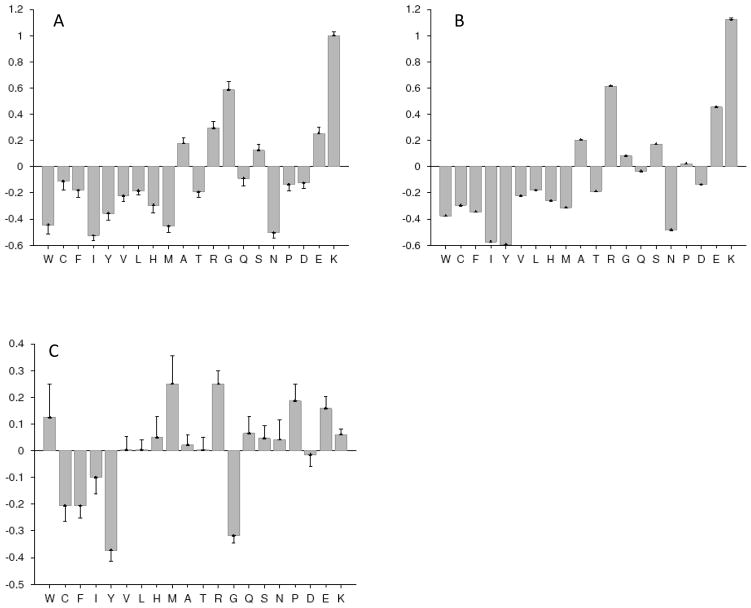
The conclusion on the more disordered nature of the non-acetylated peptides is further supported by the results of compositional profiling of 15mer peptides containing acetylated lysines (Figure 7A) or non-acetylated lysines (Figure 7B) in comparison with the ordered proteins. Analysis of these data show that both types of peptides are clearly disordered but their relative amino acid compositions are rather different. Compositional profiling of peptides containing non-acetylated lysines relative to peptides containing acetylated lysines (Figure 7C) reveal that the acetylated peptides clearly had more C, F, I, Y, and G (statistically significant enrichment for C, F, Y, and G) and less W, M, R, P, and E (statistically significant depletion for R, P, and E).
Figure 7. Composition profiling of 15 residues-long peptides containing acetylated lysines (A) or non-acetylated lysines (B) in comparison with ordered proteins.
Both types of peptides are clearly disordered since they are depleted in major order-promoting residues and are enriched in several disorder-promoting residues. However, the amino acid compositions of these two types of regions are clearly different. In these plots, y-axis represents (Cs1 − Cs2)/Cs2 values calculated for each residue shown in x-axis, where Cs1 is a content of a given residue in a query set of peptides (15 residues-long peptides containing acetylated lysines or non-acetylated lysines), whereas Cs2 is the corresponding value for the sample set of proteins (a set of ordered proteins from PDB). Negative bars correspond to the residues which are under-represented in set S1, whereas positive bars correspond to the over-represented residues. Error bars represent the non-parametric estimations of the confidence intervals for the reported amino acid compositions. These confidence intervals are standard deviations of the pseudo-replicate compositions calculated by bootstrapping (1,000 iterations), where in each iteration step, random samples of the two starting samples are created, relative entropy between the random samples is computed and compared to the observed relative entropy. (C) Compositional profiling of peptides with non-acetylated lysines in comparison with the peptides containing acetylated lysines. Acetylated peptides clearly have more of C, F, I, Y and G (statistically significant enrichment is for C, F, Y and G) and less of W, M, R, P and E (statistically significant depletion is for R, P and E). Here, y-axis represents (Cs1 − Cs2)/Cs2 values calculated for each residue shown in x-axis, where Cs1 is a content of a given residue in a set of peptides containing non-acetylated lysines, whereas Cs2 is the corresponding value for the set of set of peptides containing acetylated lysines proteins.
Finally, visual inspection of plots shown in Figure 2 suggests that there is a bimodal distribution within the disorder score range 0.05–0.95 for all the datasets. Distributions for the acetylated lysines in the extracellular and especially intracellular tachyzoites (Figure 2A and 2C) are characterized by maxima in the vicinity of disorder scores of 0.2 and 0.8, whereas the IUPred-based distributions for the non-acetylated lysines were shifted toward higher disorder scores and had maxima in the vicinity of 0.3 and 0.9. Furthermore, in the extracellular tachyzoites, 49.8±0.7% (PONDR® VLXT) and 44.2±0.6% (IUPred) acetylated lysines had a disorder score above the 0.5 threshold, whereas in the set of non-acetylated lysines, these numbers were 54.8±0.1% (PONDR® VLXT) and 45.6±0.1% (IUPred). Similarly, in the intracellular tachyzoites, 46.4±1.1% (PONDR® VLXT) and 40.5±0.8% (IUPred) acetylated lysines had a disorder score above the 0.5 threshold, whereas in the set of non-acetylated lysines, these numbers were 55.6±0.2% (PONDR® VLXT) and 46.3±0.2% (IUPred).
Evaluation of the overall disorder status of the acetylated lysines in extracellular tachyzoites
Disorder analysis of 571 acetylated lysines in 386 proteins from freshly egressed extracellular Toxoplasma tachyzoites supported the major conclusions made for the acetylome of the intracellular tachyzoites. Similar to the acetylome of the intracellular tachyzoites, more than 50% of non-acetylated lysines are predicted to have disorder score above 0.5; i.e., predicted to be intrinsically disordered residues. Furthermore, acetylated lysines in proteins from the extracellular and intracellular tachyzoites are largely located within similar local environments. Figure 8 displays the results of the analysis of the local environment of acetylated lysines within the amino acid sequences of proteins from extracellular and intracellular tachyzoites. Here, the original averaged disorder scores of acetylated lysines in extracellular (Figure 8A) and intracellular tachyzoites (Figure 8B) were used in the x-axis and the averaged disorder scores for sequences comprising of 15 amino acids flanking the lysine at both sides were used in the y-axis. Striking similarity is seen for these two plots indicating that there is no significant difference between the local environments of acetylated lysines in extracellular and intracellular tachyzoites. Figure 8 shows that for both acetylomes, the acetylated lysines predicted to be ordered (i.e., with the disorder score of <0.5) were more commonly found within disordered regions rather than within the ordered regions. In other words, ordered acetylated lysines preferentially belonged to Class II rather than to Class IV, as evidenced by high populations of symbols in the lower-left quadrants above the diagonal in Figure 8. Furthermore, many of these ordered acetylated lysines are expected to possess much higher flexibility than their neighboring amino acids (symbols in the lower-left quadrant below the diagonal in Figure 8).
Figure 8. Comparison of the local environments of acetylated sites in extracellular (A) and intracellular tachyzoites (B).
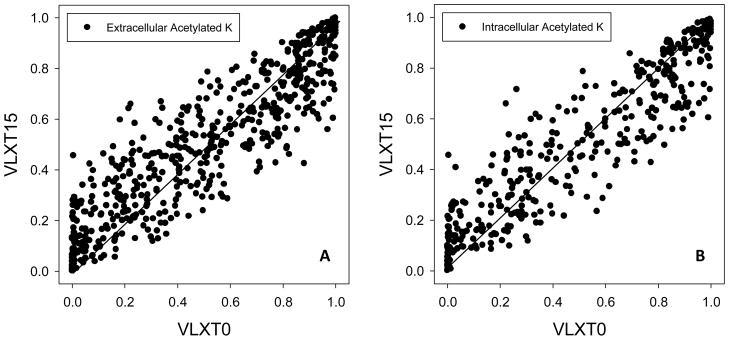
Similar to the data shown in Figure 4, the influence of neighboring residues was measured by averaging disorder scores over peptides centered at the target lysine but extended on both sides by a specific number of residues. The length of the extension is 15 and the corresponding score is labeled as vlxt-15; vlxt-0 represents the original prediction score without an extension. Each symbol in the figure is an acetylated lysine. The x-axis displays the original disorder scores for the acetylated lysines and the y-axis displays the average disorder score over the extended regions.
Peculiarities of intrinsic disorder in acetylation sites
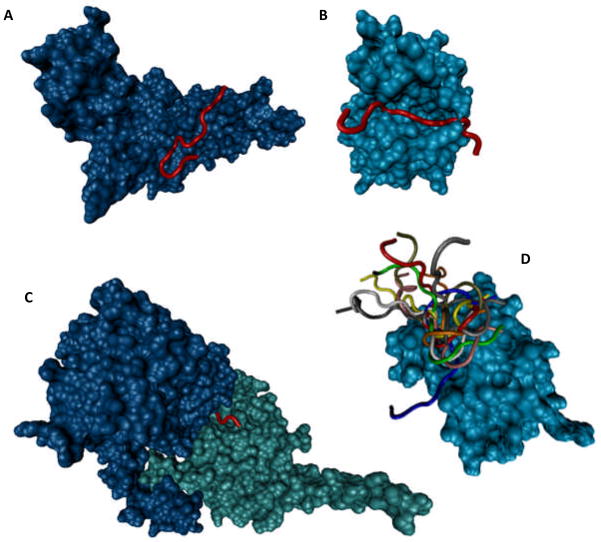
Comparison of the local environment of the acetylated and non-acetylated lysines in the Toxoplasma acetylome revealed that both lysine types are predominantly located in intrinsically disordered regions. Although no structural information is currently available for the target peptides bound to the Toxoplasma acetyltransferase, analysis of the structures deposited to PDB revealed the existence of several complexes between the various acetyltransferases from different sources and their acetylatable targets (mostly fragments of different histones). Figure 9 illustrates some of the peculiarities of signaling interactions between acetyltransferases and their targets by presenting several structures of corresponding complexes. Figure 9A shows a crystal structure of the complex between a 15-amino acid peptide derived from the human histone H4 and the catalytic subunit of the human histone acetyltransferase 1 (HAT1, PDB ID: 2P0W). Figure 9B represents a crystal structure of the complex between a 19-amino acid peptide derived from histone H3 and histone acetyltransferase GCN5 from Tetrahymena thermophila (PDB ID: 1PU9). Figure 9C shows a crystal structure of a complex between the Saccharomyces cerevisiae histone acetyltransferase RTT109, histone chaperone (vacuolar protein sorting-associated protein 75, Vps75), and a 14-amino acid peptide from histone H3 (PDB ID: 3Q33). Finally, Figure 9D represents an NMR solution structure of a complex between a bromodomain of the human acetyltransferase PCAF and 14-amino acid peptide from histone H3 (PDB ID: 2RNW). Analysis of the structures shown in this figure clearly demonstrates that the acetyltransferase targets are in highly extended conformations that do not have any intramolecular hydrogen bonds. Furthermore, out of 14 residues of the histone H3 co-crystallized with RTT109 and Vps75, only 4 residues were resolved (Figure 9C), whereas 10 residues were missing in the electron density map, clearly indicating their highly dynamic nature. Finally, the highly flexible nature of the acetylatable target is illustrated by Figure 9D, which represents an NMR solution structure of an acetyltransferase-target complex and clearly shows that the bound 14-amino acid peptide from histone H3 exists as a highly dynamic structural ensemble, with the structure of the entire complex resembling a “can of worms”.
Figure 9. Disordered nature of the acetylation sites.
A. Crystal structure (PDB ID: 2P0W) of a complex between human histone acetyltransferase 1 (HAT1, shown as a cyan cloud) and a 15-amino acid peptide derived from the human histone H4 (depicted in red). B. Crystal structure (PDB ID: 1PU9) of a complex between the Tetrahymena thermophila histone acetyltransferase GCN5 (cyan cloud) and a 19-amino acid peptide derived from the histone H3 (red). C. Crystal structure (PDB ID: 3Q33) of a complex between the histone acetyltransferase RTT109 from Saccharomyces cerevisiae (blue cloud), a 14-amino acid peptide from histone H3 (red, note that only 4 residues were resolved, whereas 10 residues were missing in the electron density map) and a histone chaperone from Saccharomyces cerevisiae (vacuolar protein sorting-associated protein 75, shown as a cyan cloud). D. NMR solution structure (PDB ID: 2RNW) of a complex between a bromodomain of the human acetyltransferase PCAF (cyan cloud shows one member of the conformational ensemble) and 14-amino acid peptide from histone H3 (10 members of the structural ensemble are shown by strands of different color).
Overall, Figure 9 illustrates that irrespectively of their origin acetylatable regions that are recognized by the various acetyltransferases are predominantly disordered. This observation provides strong support to the idea that intrinsic disorder is a general feature of the protein regions subjected to acetylation, and is not limited to the 411 lysine acetylation sites across 274 proteins in the intracellular tachyzoites or the 571 acetylated lysines across 386 proteins in the extracellular tachyzoites described in our study.
On the other hand, data shown in Figures 5–7 suggest that the overall local environment of the acetylated lysines is slightly less disordered than that of the non-acetylated lysines and is clearly characterized by noticeable biases with hydrophobic and aromatic residues being frequently seen in the close proximity of acetylated lysines (Figure 6). These observations suggest that in addition to the overall flexibility of regions surrounding the acetylated lysines, acetylation sites might have some specific signals that facilitate recognition by lysine acetyltransferases (KATs). Typically, such recognition sites should have some hydrophobic/aromatic residues, which can explain why acetylated peptides are less disordered.
Supplementary Material
Acknowledgments
Support for this research was made possible through grants from the National Institutes of Health (AI077502 to WJS) and from the Program of the Russian Academy of Sciences for the “Molecular and cellular biology” (VNU). The authors thank Jeffery Silva (Cell Signaling Technology) for assistance with the mass spectrometry analysis.
Abbreviations
- GO
Gene Ontology
- HAT1
histone acetyltransferase 1
- IDP
intrinsically disordered protein
- IDPR
intrinsically disordered protein region
- KDACs
lysine deacetylases
- PTM
post-translational modification
- Ubl
ubiquitin-like
- Vps75
vacuolar protein sorting-associated protein 75
References
- 1.Tenter AM, Heckeroth AR, Weiss LM. Int J Parasitol. 2000;30:1217–1258. doi: 10.1016/s0020-7519(00)00124-7. [DOI] [PMC free article] [PubMed] [Google Scholar]
- 2.Sullivan WJ, Jr, Jeffers V. FEMS Microbiol Rev. 2012;36:717–733. doi: 10.1111/j.1574-6976.2011.00305.x. [DOI] [PMC free article] [PubMed] [Google Scholar]
- 3.Choudhary C, Kumar C, Gnad F, Nielsen ML, Rehman M, Walther TC, Olsen JV, Mann M. Science. 2009;325:834–840. doi: 10.1126/science.1175371. [DOI] [PubMed] [Google Scholar]
- 4.Kouzarides T. Embo J. 2000;19:1176–1179. doi: 10.1093/emboj/19.6.1176. [DOI] [PMC free article] [PubMed] [Google Scholar]
- 5.Sadoul K, Wang J, Diagouraga B, Khochbin S. J Biomed Biotechnol. 2011;2011:970382. doi: 10.1155/2011/970382. [DOI] [PMC free article] [PubMed] [Google Scholar]
- 6.Zhang J, Sprung R, Pei J, Tan X, Kim S, Zhu H, Liu CF, Grishin NV, Zhao Y. Mol Cell Proteomics. 2009;8:215–225. doi: 10.1074/mcp.M800187-MCP200. [DOI] [PMC free article] [PubMed] [Google Scholar]
- 7.Hu LI, Lima BP, Wolfe AJ. Mol Microbiol. 2010;77:15–21. doi: 10.1111/j.1365-2958.2010.07204.x. [DOI] [PMC free article] [PubMed] [Google Scholar]
- 8.Wang Q, Zhang Y, Yang C, Xiong H, Lin Y, Yao J, Li H, Xie L, Zhao W, Yao Y, Ning ZB, Zeng R, Xiong Y, Guan KL, Zhao S, Zhao GP. Science. 2010;327:1004–1007. doi: 10.1126/science.1179687. [DOI] [PMC free article] [PubMed] [Google Scholar]
- 9.Finkemeier I, Laxa M, Miguet L, Howden AJ, Sweetlove LJ. Plant Physiol. 2011;155:1779–1790. doi: 10.1104/pp.110.171595. [DOI] [PMC free article] [PubMed] [Google Scholar]
- 10.Wu X, Oh MH, Schwarz EM, Larue CT, Sivaguru M, Imai BS, Yau PM, Ort DR, Huber SC. Plant Physiol. 2011;155:1769–1778. doi: 10.1104/pp.110.165852. [DOI] [PMC free article] [PubMed] [Google Scholar]
- 11.Weinert BT, Wagner SA, Horn H, Henriksen P, Liu WR, Olsen JV, Jensen LJ, Choudhary C. Sci Signal. 2011;4:ra48. doi: 10.1126/scisignal.2001902. [DOI] [PubMed] [Google Scholar]
- 12.Kim SC, Sprung R, Chen Y, Xu Y, Ball H, Pei J, Cheng T, Kho Y, Xiao H, Xiao L, Grishin NV, White M, Yang XJ, Zhao Y. Molecular cell. 2006;23:607–618. doi: 10.1016/j.molcel.2006.06.026. [DOI] [PubMed] [Google Scholar]
- 13.Zhao S, Xu W, Jiang W, Yu W, Lin Y, Zhang T, Yao J, Zhou L, Zeng Y, Li H, Li Y, Shi J, An W, Hancock SM, He F, Qin L, Chin J, Yang P, Chen X, Lei Q, Xiong Y, Guan KL. Science. 2010;327:1000–1004. doi: 10.1126/science.1179689. [DOI] [PMC free article] [PubMed] [Google Scholar]
- 14.Jeffers V, Sullivan WJ., Jr Eukaryot Cell. 2012;11:735–742. doi: 10.1128/EC.00088-12. [DOI] [PMC free article] [PubMed] [Google Scholar]
- 15.Lu Z, Cheng Z, Zhao Y, Volchenboum SL. PLoS One. 2011;6:e28228. doi: 10.1371/journal.pone.0028228. [DOI] [PMC free article] [PubMed] [Google Scholar]
- 16.Norris KL, Lee JY, Yao TP. Sci Signal. 2009;2:pe76. doi: 10.1126/scisignal.297pe76. [DOI] [PMC free article] [PubMed] [Google Scholar]
- 17.Haigis MC, Mostoslavsky R, Haigis KM, Fahie K, Christodoulou DC, Murphy AJ, Valenzuela DM, Yancopoulos GD, Karow M, Blander G, Wolberger C, Prolla TA, Weindruch R, Alt FW, Guarente L. Cell. 2006;126:941–954. doi: 10.1016/j.cell.2006.06.057. [DOI] [PubMed] [Google Scholar]
- 18.Arif M, Senapati P, Shandilya J, Kundu TK. Biochim Biophys Acta. 2010;1799:702–716. doi: 10.1016/j.bbagrm.2010.10.002. [DOI] [PubMed] [Google Scholar]
- 19.Yang XJ. Nucleic Acids Res. 2004;32:959–976. doi: 10.1093/nar/gkh252. [DOI] [PMC free article] [PubMed] [Google Scholar]
- 20.Walsh CT, Garneau-Tsodikova S, Gatto GJ., Jr Angew Chem Int Ed Engl. 2005;44:7342–7372. doi: 10.1002/anie.200501023. [DOI] [PubMed] [Google Scholar]
- 21.Witze ES, Old WM, Resing KA, Ahn NG. Nat Methods. 2007;4:798–806. doi: 10.1038/nmeth1100. [DOI] [PubMed] [Google Scholar]
- 22.Xie H, Vucetic S, Iakoucheva LM, Oldfield CJ, Dunker AK, Obradovic Z, Uversky VN. J Proteome Res. 2007;6:1917–1932. doi: 10.1021/pr060394e. [DOI] [PMC free article] [PubMed] [Google Scholar]
- 23.Uversky VN. Current Pharmaceutical Design. 2012 doi: 10.2174/1381612811319230005. In press. [DOI] [PubMed] [Google Scholar]
- 24.Wright PE, Dyson HJ. J Mol Biol. 1999;293:321–331. doi: 10.1006/jmbi.1999.3110. [DOI] [PubMed] [Google Scholar]
- 25.Uversky VN, Gillespie JR, Fink AL. Proteins. 2000;41:415–427. doi: 10.1002/1097-0134(20001115)41:3<415::aid-prot130>3.0.co;2-7. [DOI] [PubMed] [Google Scholar]
- 26.Dunker AK, Lawson JD, Brown CJ, Williams RM, Romero P, Oh JS, Oldfield CJ, Campen AM, Ratliff CM, Hipps KW, Ausio J, Nissen MS, Reeves R, Kang C, Kissinger CR, Bailey RW, Griswold MD, Chiu W, Garner EC, Obradovic Z. J Mol Graph Model. 2001;19:26–59. doi: 10.1016/s1093-3263(00)00138-8. [DOI] [PubMed] [Google Scholar]
- 27.Dunker AK, Obradovic Z. Nat Biotechnol. 2001;19:805–806. doi: 10.1038/nbt0901-805. [DOI] [PubMed] [Google Scholar]
- 28.Dyson HJ, Wright PE. Curr Opin Struct Biol. 2002;12:54–60. doi: 10.1016/s0959-440x(02)00289-0. [DOI] [PubMed] [Google Scholar]
- 29.Dunker AK, Brown CJ, Lawson JD, Iakoucheva LM, Obradovic Z. Biochemistry. 2002;41:6573–6582. doi: 10.1021/bi012159+. [DOI] [PubMed] [Google Scholar]
- 30.Dunker AK, Brown CJ, Obradovic Z. Adv Protein Chem. 2002;62:25–49. doi: 10.1016/s0065-3233(02)62004-2. [DOI] [PubMed] [Google Scholar]
- 31.Tompa P. Trends Biochem Sci. 2002;27:527–533. doi: 10.1016/s0968-0004(02)02169-2. [DOI] [PubMed] [Google Scholar]
- 32.Uversky VN. Protein Sci. 2002;11:739–756. doi: 10.1110/ps.4210102. [DOI] [PMC free article] [PubMed] [Google Scholar]
- 33.Uversky VN. Eur J Biochem. 2002;269:2–12. doi: 10.1046/j.0014-2956.2001.02649.x. [DOI] [PubMed] [Google Scholar]
- 34.Uversky VN. Cell Mol Life Sci. 2003;60:1852–1871. doi: 10.1007/s00018-003-3096-6. [DOI] [PMC free article] [PubMed] [Google Scholar]
- 35.Tompa P, Csermely P. Faseb J. 2004;18:1169–1175. doi: 10.1096/fj.04-1584rev. [DOI] [PubMed] [Google Scholar]
- 36.Daughdrill GW, Pielak GJ, Uversky VN, Cortese MS, Dunker AK. In: Handbook of Protein Folding. Buchner J, Kiefhaber T, editors. Wiley-VCH, Verlag GmbH & Co; Weinheim, Germany: 2005. pp. 271–353. [Google Scholar]
- 37.Dunker AK, Cortese MS, Romero P, Iakoucheva LM, Uversky VN. FEBS Journal. 2005;272:5129–5148. doi: 10.1111/j.1742-4658.2005.04948.x. [DOI] [PubMed] [Google Scholar]
- 38.Dyson HJ, Wright PE. Nat Rev Mol Cell Biol. 2005;6:197–208. doi: 10.1038/nrm1589. [DOI] [PubMed] [Google Scholar]
- 39.Uversky VN, Oldfield CJ, Dunker AK. J Mol Recognit. 2005;18:343–384. doi: 10.1002/jmr.747. [DOI] [PubMed] [Google Scholar]
- 40.Tompa P. FEBS Lett. 2005;579:3346–3354. doi: 10.1016/j.febslet.2005.03.072. [DOI] [PubMed] [Google Scholar]
- 41.Tompa P, Szasz C, Buday L. Trends Biochem Sci. 2005;30:484–489. doi: 10.1016/j.tibs.2005.07.008. [DOI] [PubMed] [Google Scholar]
- 42.Radivojac P, Iakoucheva LM, Oldfield CJ, Obradovic Z, Uversky VN, Dunker AK. Biophys J. 2007;92:1439–1456. doi: 10.1529/biophysj.106.094045. [DOI] [PMC free article] [PubMed] [Google Scholar]
- 43.Vucetic S, Xie H, Iakoucheva LM, Oldfield CJ, Dunker AK, Obradovic Z, Uversky VN. J Proteome Res. 2007;6:1899–1916. doi: 10.1021/pr060393m. [DOI] [PMC free article] [PubMed] [Google Scholar]
- 44.Xie H, Vucetic S, Iakoucheva LM, Oldfield CJ, Dunker AK, Uversky VN, Obradovic Z. J Proteome Res. 2007;6:1882–1898. doi: 10.1021/pr060392u. [DOI] [PMC free article] [PubMed] [Google Scholar]
- 45.Cortese MS, Uversky VN, Dunker AK. Prog Biophys Mol Biol. 2008;98:85–106. doi: 10.1016/j.pbiomolbio.2008.05.007. [DOI] [PMC free article] [PubMed] [Google Scholar]
- 46.Dunker AK, Silman I, Uversky VN, Sussman JL. Curr Opin Struct Biol. 2008;18:756–764. doi: 10.1016/j.sbi.2008.10.002. [DOI] [PubMed] [Google Scholar]
- 47.Dunker AK, Oldfield CJ, Meng J, Romero P, Yang JY, Chen JW, Vacic V, Obradovic Z, Uversky VN. BMC Genomics. 2008;9(Suppl 2):S1. doi: 10.1186/1471-2164-9-S2-S1. [DOI] [PMC free article] [PubMed] [Google Scholar]
- 48.Dunker AK, Uversky VN. Nat Chem Biol. 2008;4:229–230. doi: 10.1038/nchembio0408-229. [DOI] [PubMed] [Google Scholar]
- 49.Oldfield CJ, Meng J, Yang JY, Yang MQ, Uversky VN, Dunker AK. BMC Genomics. 2008;9(Suppl 1):S1. doi: 10.1186/1471-2164-9-S1-S1. [DOI] [PMC free article] [PubMed] [Google Scholar]
- 50.Russell RB, Gibson TJ. FEBS Lett. 2008;582:1271–1275. doi: 10.1016/j.febslet.2008.02.027. [DOI] [PubMed] [Google Scholar]
- 51.Tompa P, Fuxreiter M. Trends Biochem Sci. 2008;33:2–8. doi: 10.1016/j.tibs.2007.10.003. [DOI] [PubMed] [Google Scholar]
- 52.Uversky VN, Dunker AK. Science. 2008;322:1340–1341. doi: 10.1126/science.1167453. [DOI] [PubMed] [Google Scholar]
- 53.Uversky VN, Dunker AK. Biochim Biophys Acta. 2010;1804:1231–1264. doi: 10.1016/j.bbapap.2010.01.017. [DOI] [PMC free article] [PubMed] [Google Scholar]
- 54.Tompa P, Fuxreiter M, Oldfield CJ, Simon I, Dunker AK, Uversky VN. Bioessays. 2009;31:328–335. doi: 10.1002/bies.200800151. [DOI] [PubMed] [Google Scholar]
- 55.Wright PE, Dyson HJ. Curr Opin Struct Biol. 2009;19:31–38. doi: 10.1016/j.sbi.2008.12.003. [DOI] [PMC free article] [PubMed] [Google Scholar]
- 56.Uversky VN. Int J Biochem Cell Biol. 2011;43:1090–1103. doi: 10.1016/j.biocel.2011.04.001. [DOI] [PubMed] [Google Scholar]
- 57.Xue B, Dunker AK, Uversky VN. J Biomol Struct Dyn. 2012;30:137–149. doi: 10.1080/07391102.2012.675145. [DOI] [PubMed] [Google Scholar]
- 58.Uversky VN. Expert Opin Drug Discov. 2012;7:475–488. doi: 10.1517/17460441.2012.686489. [DOI] [PubMed] [Google Scholar]
- 59.Peng Z, Mizianty MJ, Xue B, Kurgan L, Uversky VN. Mol Biosyst. 2012;8:1886–1901. doi: 10.1039/c2mb25102g. [DOI] [PubMed] [Google Scholar]
- 60.Xue B, Dunker AK, Uversky VN. J Biomol Struct Dyn. 2012;29:843–861. doi: 10.1080/073911012010525024. [DOI] [PubMed] [Google Scholar]
- 61.Uversky VN, Dunker AK. Anal Chem. 2012;84:2096–2104. doi: 10.1021/ac203096k. [DOI] [PubMed] [Google Scholar]
- 62.Ahmad A, Burns CS, Fink AL, Uversky VN. J Biomol Struct Dyn. 2012;29:825–842. doi: 10.1080/073911012010525023. [DOI] [PubMed] [Google Scholar]
- 63.Huang F, Oldfield C, Meng J, Hsu WL, Xue B, Uversky VN, Romero P, Dunker AK. Pac Symp Biocomput. 2012:128–139. [PubMed] [Google Scholar]
- 64.Hsu WL, Oldfield C, Meng J, Huang F, Xue B, Uversky VN, Romero P, Dunker AK. Pac Symp Biocomput. 2012:116–127. [PubMed] [Google Scholar]
- 65.Westerheide SD, Raynes R, Powell C, Xue B, Uversky VN. Curr Protein Pept Sci. 2012;13:86–103. doi: 10.2174/138920312799277956. [DOI] [PubMed] [Google Scholar]
- 66.Xue B, Mizianty MJ, Kurgan L, Uversky VN. Cell Mol Life Sci. 2012;69:1211–1259. doi: 10.1007/s00018-011-0859-3. [DOI] [PMC free article] [PubMed] [Google Scholar]
- 67.Xue B, Oldfield CJ, Van YY, Dunker AK, Uversky VN. Mol Biosyst. 2012;8:134–150. doi: 10.1039/c1mb05163f. [DOI] [PubMed] [Google Scholar]
- 68.Dunker AK, Obradovic Z, Romero P, Kissinger C, Villafranca E. PDB Newsletter. 1997;81:3–5. [Google Scholar]
- 69.Dunker AK, Garner E, Guilliot S, Romero P, Albrecht K, Hart J, Obradovic Z, Kissinger C, Villafranca JE. Pac Symp Biocomput. 1998:473–484. [PubMed] [Google Scholar]
- 70.Romero P, Obradovic Z, Li X, Garner EC, Brown CJ, Dunker AK. Proteins. 2001;42:38–48. doi: 10.1002/1097-0134(20010101)42:1<38::aid-prot50>3.0.co;2-3. [DOI] [PubMed] [Google Scholar]
- 71.Brown CJ, Takayama S, Campen AM, Vise P, Marshall TW, Oldfield CJ, Williams CJ, Dunker AK. J Mol Evol. 2002;55:104–110. doi: 10.1007/s00239-001-2309-6. [DOI] [PubMed] [Google Scholar]
- 72.Romero PR, Zaidi S, Fang YY, Uversky VN, Radivojac P, Oldfield CJ, Cortese MS, Sickmeier M, LeGall T, Obradovic Z, Dunker AK. Proc Natl Acad Sci U S A. 2006;103:8390–8395. doi: 10.1073/pnas.0507916103. [DOI] [PMC free article] [PubMed] [Google Scholar]
- 73.Marks F. Protein Phosphorylation. VCH Weinheim; New York, Basel, Cambridge, Tokyo: 1996. [Google Scholar]
- 74.Bossemeyer D, Engh RA, Kinzel V, Ponstingl H, Huber R. EMBO J. 1993;12:849–859. doi: 10.1002/j.1460-2075.1993.tb05725.x. [DOI] [PMC free article] [PubMed] [Google Scholar]
- 75.Narayana N, Cox S, Shaltiel S, Taylor SS, Xuong N. Biochemistry. 1997;36:4438–4448. doi: 10.1021/bi961947+. [DOI] [PubMed] [Google Scholar]
- 76.Lowe ED, Noble ME, Skamnaki VT, Oikonomakos NG, Owen DJ, Johnson LN. Embo J. 1997;16:6646–6658. doi: 10.1093/emboj/16.22.6646. [DOI] [PMC free article] [PubMed] [Google Scholar]
- 77.ter Haar E, Coll JT, Austen DA, Hsiao HM, Swenson L, Jain J. Nat Struct Biol. 2001;8:593–596. doi: 10.1038/89624. [DOI] [PubMed] [Google Scholar]
- 78.Hubbard SR. Embo J. 1997;16:5572–5581. doi: 10.1093/emboj/16.18.5572. [DOI] [PMC free article] [PubMed] [Google Scholar]
- 79.McDonald IK, Thornton JM. J Mol Biol. 1994;238:777–793. doi: 10.1006/jmbi.1994.1334. [DOI] [PubMed] [Google Scholar]
- 80.Li X, Romero P, Rani M, Dunker AK, Obradovic Z. Genome Inform Ser Workshop Genome Inform. 1999;10:30–40. [PubMed] [Google Scholar]
- 81.Dosztanyi Z, Csizmok V, Tompa P, Simon I. Bioinformatics. 2005;21:3433–3434. doi: 10.1093/bioinformatics/bti541. [DOI] [PubMed] [Google Scholar]
- 82.Vacic V, Uversky VN, Dunker AK, Lonardi S. BMC Bioinformatics. 2007;8:211. doi: 10.1186/1471-2105-8-211. [DOI] [PMC free article] [PubMed] [Google Scholar]
- 83.Gaji RY, Behnke MS, Lehmann MM, White MW, Carruthers VB. Mol Microbiol. 2011;79:192–204. doi: 10.1111/j.1365-2958.2010.07441.x. [DOI] [PMC free article] [PubMed] [Google Scholar]
- 84.Joyce BR, Queener SF, Wek RC, Sullivan WJ., Jr Proc Natl Acad Sci U S A. 2010;107:17200–17205. doi: 10.1073/pnas.1007610107. [DOI] [PMC free article] [PubMed] [Google Scholar]
- 85.Bhatti MM, Livingston M, Mullapudi N, Sullivan WJ., Jr Eukaryot Cell. 2006;5:62–76. doi: 10.1128/EC.5.1.62-76.2006. [DOI] [PMC free article] [PubMed] [Google Scholar]
- 86.He B, Wang K, Liu Y, Xue B, Uversky VN, Dunker AK. Cell Res. 2009;19:929–949. doi: 10.1038/cr.2009.87. [DOI] [PubMed] [Google Scholar]
- 87.Ferron F, Longhi S, Canard B, Karlin D. Proteins. 2006;65:1–14. doi: 10.1002/prot.21075. [DOI] [PubMed] [Google Scholar]
- 88.Bourhis JM, Canard B, Longhi S. Curr Protein Pept Sci. 2007;8:135–149. doi: 10.2174/138920307780363451. [DOI] [PubMed] [Google Scholar]
- 89.Uversky VN, Roman A, Oldfield CJ, Dunker AK. J Proteome Res. 2006;5:1829–1842. doi: 10.1021/pr0602388. [DOI] [PubMed] [Google Scholar]
- 90.Oldfield CJ, Cheng Y, Cortese MS, Romero P, Uversky VN, Dunker AK. Biochemistry. 2005;44:12454–12470. doi: 10.1021/bi050736e. [DOI] [PubMed] [Google Scholar]
- 91.Cheng Y, Oldfield CJ, Meng J, Romero P, Uversky VN, Dunker AK. Biochemistry. 2007;46:13468–13477. doi: 10.1021/bi7012273. [DOI] [PMC free article] [PubMed] [Google Scholar]
- 92.Xue B, Soeria-Atmadja D, Gustafsson MG, Hammerling U, Dunker AK, Uversky VN. Proteins. 2011;79:2595–2606. doi: 10.1002/prot.23077. [DOI] [PubMed] [Google Scholar]
Associated Data
This section collects any data citations, data availability statements, or supplementary materials included in this article.


