

Abstract
We demonstrate a compact and cost-effective imaging cytometry platform installed on a cell-phone for the measurement of the density of red and white blood cells as well as hemoglobin concentration in human blood samples. Fluorescent and bright-field images of blood samples are captured using separate optical attachments to the cell-phone and are rapidly processed through a custom-developed smart application running on the phone for counting of blood cells and determining hemoglobin density. We evaluated the performance of this cell-phone based blood analysis platform using anonymous human blood samples and achieved comparable results to a standard bench-top hematology analyser. Test results can either be stored on the cell-phone memory or be transmitted to a central server, providing remote diagnosis opportunities even in field settings.
1. Introduction
Blood analysis, including density measurements of white blood cells (WBCs), red blood cells (RBCs), and hemoglobin, is one of the most ordered clinical tests. It can provide valuable information for evaluating the overall health condition as well as helping diagnosis of various diseases1, such as anemia and infections. Typically a blood test requires at least a millilitre of blood sample and the cells can be manually counted using a hemocytometer with light microscopy or automatically counted using a hematology analyzer or a flow cytometer in a centralized laboratory2. Manual counting is tedious and subject to errors and bias. Automated counting using e.g., a flow cytometer is highly accurate but requires bulky and expensive instruments, making them less effective for point-of-care diagnostics, especially in resource limited settings. Therefore, a cost-effective, compact and accurate automated blood analyzer that can be used at the point-of-care is highly desirable.
Cell-phone based microscopy and diagnostics have been emerging fields in recent years 3–15. The massive volume of cell-phone users (~ 6 billion in 201216), the advanced status of the embedded digital components in cell-phones (e.g., image sensors, graphics processing units etc.) as well as the wide-spread connectivity of the existing wireless telecommunication infrastructure make the cell-phone a ubiquitous platform to develop various diagnostics platforms especially for point-of-care and telemedicine applications. Towards this end, here we demonstrate a compact and cost-effective imaging cytometry platform installed on a cell-phone to perform rapid blood analysis measuring the density of WBCs, RBCs and hemoglobin with minimum sample volume (e.g., ~ 10 μL of whole blood per test from venous or finger prick) and rather simple sample preparation steps. In this imaging cytometry platform attached to a cell-phone, captured microscopic images of blood samples are quickly processed on the cell-phone using a custom developed application to provide the cell or hemoglobin concentration information in less than 10 seconds for each processed image. These test results can either be stored on the cell-phone memory or sent to healthcare providers for remote diagnosis through a wireless network. We evaluated the performance of this cell-phone based blood analyser by measuring WBC and RBC counts as well as hemoglobin concentrations of anonymous human blood samples, yielding comparable results to a standard bench-top hematology analyser. This field-portable cell-phone based blood analyzer could be used e.g., at point-of-care offices or even in field settings to perform rapid blood analysis, which can facilitate remote disease diagnosis as well as patient follow up.
2. Methods
Opto-mechanical Hardware Design
In our design, we chose Samsung Galaxy SII as the starting base cell-phone for our automated blood analyzer prototype. This Android phone has an 8 MPixel color camera module and its built-in lens has a focal length of f ~ 4 mm. We should emphasise that our blood analyzer design described below can also be implemented on different types of camera phones with small modifications on its base attachment. Our design (see Figure 1(A-1) and (A-2)) consists of: (i) A cell-phone base attachment fixed on top of the cell-phone camera unit, which includes two AA batteries and a universal port for three different add-on components; and (ii) Three separate add-on components for WBC imaging/counting, RBC imaging/counting and hemoglobin density measurements, respectively. Each add-on includes an inexpensive plano-convex lens installed at its bottom facet and light-emitted-diodes (LEDs) for sample illumination. When the add-on component is attached on the cell-phone base, its lens gets directly in contact with the existing camera lens on the phone to form an imaging system. LEDs are powered using the two AA batteries on the cell-phone base attachment. All these opto-mechanical attachments to the cell-phone are built through a 3-D printer which uses ABSplus™ modelling thermoplastic material.
Figure 1.

(A-1) and (A-2) Illustration and picture of our cell-phone based blood analysis platform. It includes a base attachment with two AA batteries and a universal port for adapting three different add-on components for white blood cell counting, red blood cell counting and hemoglobin measurements respectively. (B-1) and (B-2) Illustration and picture of the white blood cell counting device. (C-1) and (C-2) Illustration and picture of the red blood cell counting device. (D-1) and (D-2) Illustration and picture of hemoglobin measurement device.
Our WBC attachment, see Figures 1(B-1) and (B-2), images fluorescently labeled WBCs in whole blood using an opto-fluidic illumination scheme5,6,17. In this design, as shown in Figure 1(B-1), fluorescently labeled WBCs in diluted whole blood are loaded into a non-grid cell counting chamber, which has a channel depth of ~100 μm to provide a well-defined sample volume. Eight excitation LEDs (~ 470 nm) are directly butt-coupled to this counting chamber to illuminate the sample volume from its two sides symmetrically. The counting chamber that is filled with blood acts as a multimode opto-fluidic waveguide, uniformly exciting the fluorescent labeled cells inside the counting chamber. The fluorescent emission from each cell is then collected perpendicular to the excitation light path, where an inexpensive plastic filter is used to reject the scattered excitation light. The fluorescent labeled WBCs are imaged by the cell-phone camera unit through a plano-convex lens that is inserted between the sample and the camera lens. This lens used in our WBC add-on has a focal length of f2 = 15 mm, which provides an overall system demagnification of M = f2/f = 3.75. This optical imaging geometry has a modest spatial resolution5; however, within a single image it enables counting of labeled WBCs over a large field-of-view (FOV) of e.g., ~0.2–1 cm2. In terms of cell overlap probability within this imaging FOV,18 for N = 2,000 WBCs (assuming a mean diameter of e.g., ~12 μm), a FOV that is > 0.2 cm2 ensures that the fraction of cells that do not overlap with others on the sample plane is > 95%.
RBC counter attachment, on the other hand, is designed to image unlabelled RBCs in diluted whole blood samples using bright field illumination/imaging as illustrated in Figures 1(C-1) and 1(C-2). The lens used in RBC counter has a focal length of f2 = 4 mm, which provides a system demagnification factor of M = f2/f = 4/4 = 1 and a FOV of ~ 14 mm2. Therefore we are able to use a single white light LED, which is ~ 4 cm away from the counting chamber, to uniformly illuminate the sample (see Figure 1(C-1)) generating bright-field images of RBCs. Due to spatial aberrations, only the central region of this image (e.g., ~ 1.2–2 mm2) is used for cell counting purposes. This, however, does not pause a statistical issue since the density of RBCs is rather high, giving us a sufficiently large number of cells per field-of-view. In terms of RBC overlap probability within the imaging FOV, for N = 1,000 RBCs (assuming a mean diameter of ~7 μm), a FOV that is ≥ 1.2 mm2 ensures that the fraction of cells that do not overlap with others on the sample plane is ≥ 88%.18 This implies that if at the worst case none of these overlapping cells can be resolved from each other using digital segmentation and deconvolution algorithms, an approximate counting error of ≤ 6% will be achieved due to spatial overlapping of RBCs within the FOV.
On the same cell-phone based blood analysis platform, hemoglobin concentration of blood samples is determined based on the measurement of light absorbance through a standard 1 cm. cuvette containing lysed blood. According to Beer-Lambert law, the absorbance of hemoglobin solution is proportional to its concentration. Therefore, to calculate the absorbance due to hemoglobin only, we follow a differential measurement scheme using disposable cuvettes, where we first measure the transmission intensity of water sample (as reference), and then of the blood sample of interest. Since hemoglobin has a peak absorption at around 400 – 450 nm range19 we used a single blue LED (~ 430 nm) as the light source in our cell-phone attachment for hemoglobin density measurements. For each test, a disposable plastic cuvette (~ $0.2 per piece) is filled with the liquid sample and is inserted into the sample holder (see Figures 1(D-1) and (D-2)). A 1 mm diameter pinhole aligned with the central region of the cuvette is then placed on the sample holder. The LED is in direct contact with this pinhole so that it only illuminates the central region of the cuvette and avoids any scattering from the edges. This sample holder is then slid into the hemoglobin add-on unit, which has an external lens (f2 = 8 mm) installed at the bottom. Then the add-on component with the sample holder is clicked onto the cell-phone base attachment and the transmission light intensity is recorded by the cell-phone camera, which is used to calculate the absorbance of the blood sample, revealing the hemoglobin concentration, details of which will be presented in the next sub-section.
Software - Smart Application Design
In parallel to the above discussed opto-mechanical hardware installed on the cell-phone, a customized cell-phone application is also created to directly process the captured images and generate test results on the cell-phone. The overall work-flow of this “blood analysis” application can be described as follows:
When the “blood analysis” application starts to run (see Figure 2(A)), the log-in interface pops up and the user can choose to start a new test (see Figure 2(B)).
If a new test is selected, there will be three options for the user to choose from (see Figure 2(C)): white blood cell, red blood cell, and hemoglobin measurements. Note that each type of test will use its corresponding add-on component on the cell-phone as shown in Figure 1.
When a specific test type is chosen, the cell-phone camera is powered on to request the user to take a picture of the sample of interest using the corresponding attachment unit (see Figure 2(D)).
A raw image (see Figure 2(E)) is displayed on the cell-phone screen. In order to process the raw image and compute the selected sample concentration, the following information is used by the smart application (which can also be dynamically changed by the user if needed): 1) Region of interest (ROI) for analysis. For example, to count WBCs 1000 × 1000 pixels would be sufficient; 2) Image pixel size, which is dependent on the magnification of the optical imaging system; 3) Sample dilution factor; and 4) Sample channel height. This information can also be manually adjusted as needed so that different samples with various cuvettes and dilution factors can also be analysed on the same platform. Finally, the user clicks “Analyze” button to start the image analysis on the phone.
The test results calculated on the phone are displayed as shown in Figure 2(F). The cell count is reported as number (#) of cells per μL and hemoglobin concentration is reported as gram (g) per dL. These test results can then be uploaded to a central database/server or be sent to healthcare professionals.
Figure 2.

(A) “Blood analysis” icon on the cell phone home screen. (B) Once the user clicks on the “blood analysis” icon, the login screen pops up and the user can choose to start a new test. (C) When a new test is initiated, a test menu is shown and the user can choose the test type: white blood cell counting, red blood cell counting or hemoglobin measurement. (D) After the user chooses the test type, she/he can take the picture of the sample using the camera installed on the cell-phone. (E) The application displays a raw image of the test and the user can dynamically change the default values for the region of interest such as image pixel size, sample dilution factor and sample chamber depth. (F) After clicking the “Analyze” button, test results are displayed on the phone within a processing time of ~10 sec per test. The test results can then be stored at the cell-phone memory or be uploaded to a central database/server.
Cell counting algorithm
An important part of our blood analysis application is the automated cell counting algorithm, which can reduce the counting errors compared to manual counting as well as greatly shorten the analysis time. As shown in Figure 3 for WBC measurements, first the raw image is captured by the cell-phone camera. Then the region of interest (ROI) (e.g., central 1000 × 1000 pixels for WBC counting) is cropped from the whole field-of-view. This cropped region is further converted from RGB (red, green, blue) channel to HSV (hue, saturation, value) space, and the saturation channel is extracted, which provides us the maximum intensity contrast between the fluorescent labelled WBCs and the background. We then apply an intensity threshold to generate a binary image, on which we can locate and count the labelled cells by using their size and connectivity on the binary image. The image volume of the selected ROI is calculated based on the number of pixels, pixel size and the counting chamber height. Then the cell density within the sample can be computed as: C = (N × F)/V, where C is the cell concentration, N is cell count within our ROI, F is the sample dilution factor, and V is the sample volume within the ROI. The same image processing algorithm is also applied to compute RBC concentrations as detailed in Figure 4. Instead of extracting the saturation channel as we do in WBC measurements, here the “value” channel is extracted for RBC counting because it provides a better image contrast for bright-field images. The other parts of the RBC counting algorithm (Fig. 4) are the same as in WBC concentration measurements.
Figure 3.

Block diagram of the digital processing steps that run on our cell-phone for white blood cell concentration measurements.
Figure 4.

Block diagram of the digital processing steps that run on our cell-phone for red blood cell concentration measurements.
Hemoglobin measurement algorithm
Figure 5 shows the block diagram of hemoglobin density measurement process. First the camera records the transmission light intensity through a water sample (for reference) and then through the lysed blood sample of interest. Then the same ROI is cropped from these two images and is converted from RGB to grayscale. These grayscale images are then processed to extract their mean values from all the pixels that lie within the selected ROI. Then the hemoglobin absorbance value (A) is computed as A = log (I/I0), where I0 denotes the water transmission value, and I denotes the blood sample transmission value. The final step is to calculate the hemoglobin concentration (g/dL) using A based on an internal device calibration curve, which will be detailed in the next section, Measurement Results
Figure 5.
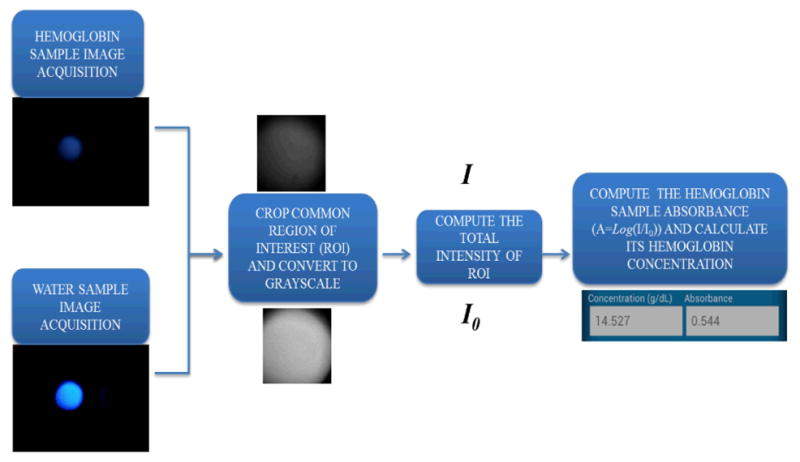
Block diagram of the digital processing steps that run on our cell-phone for hemoglobin concentration measurements.
3. Results and Discussion
We evaluated the performance of our cell-phone based blood analysis platform by measuring the total white blood cell, red blood cell and hemoglobin concentrations of anonymous human whole blood samples obtained from UCLA Blood and Platelet Center, where the gold standard measurement results for each sample were provided using a commercially available hematology analyser (Sysmex KN21).
White blood cell density measurements
We tested whole blood samples with WBC concentrations ranging from 3,000/μL up to 12,000/μL. In our sample preparation for each test, 10 μL of whole blood sample was mixed with 85 μL phosphate buffered saline (PBS) buffer and 5 μL of nucleic acid staining (SYTO16) at room temperature for ~ 20 minutes in dark. Since the quantum yield of SYTO16 is very low when it is not bound to DNA or RNA, there is no extra washing or separation step needed after cell labelling. 10 μL of this diluted and labelled whole blood sample was then loaded into the cell counting chamber (channel height of 100 μm). The counting chamber was placed flat for 2 minutes for the cells to sediment. Then the cell-phone took the microscopic image of the labelled WBCs using the optical attachment shown in Figure 1(B-1). The images were digitally processed with our cell-phone application using the algorithm detailed in Figure 3. We counted the number of labelled WBCs within a FOV of ~21 mm2, and we typically counted 600 to 2500 cells per image/test. We compared the cell-phone counted WBCs results with the standard test results obtained with Sysmex KN21 hematology analyzer. Using 30 different blood samples, we obtained a correlation coefficient of ~ 0.98 between the two methods as shown in Figure 6. The cell-phone blood analyzer generated an absolute error within 7% of the standard test. We also performed Bland–Altman analysis on our results (see Figure 6(B)), which shows a bias of 230 cells μL−1 with 95% limits of agreement of 955 and −495 cells μL−1 for a wide range of WBC concentrations spanning 3,000/μL up to 12,000/μL.
Figure 6.
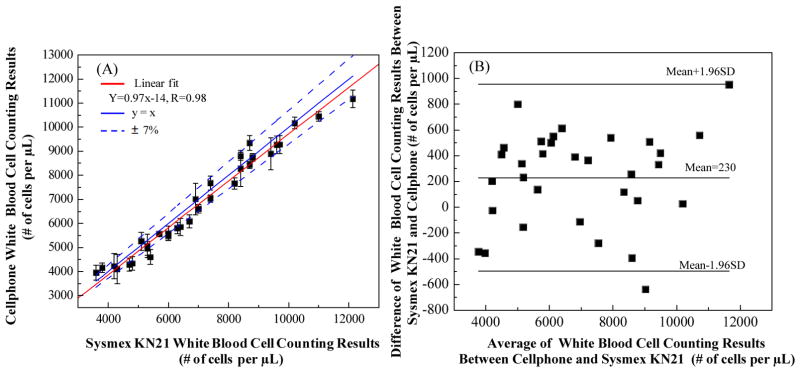
Automated WBC density measurement accuracy of our cell-phone based blood analyzer. (A) Comparison of cell-phone based WBC counting results with the standard test results obtained from SysmexKN21 for 30 different blood samples. A linear regression of the experimental data (n = 30; red line) with WBC concentrations ranging from ~ 3,000/μL to 12,000/μL demonstrates a good agreement between the two modalities with a correlation coefficient of ~ 0.98. The cell-phone based blood analyzer provides an absolute counting error that is less than 7%. (B) The Bland-Altman analysis results, evaluating the accuracy of the cell-phone blood analyzer for WBC concentration measurements vs. the standard hematology analyzer. The black solid lines show a bias of 230 cells/μL and 95%limits of agreement: 955 cells/μL (upper limit) and −495 cells/μL (lower limit).
We should note here that the same device can potentially be used for differential WBC measurements as well. For example, white blood cells can be fluorescently labelled with quantum dots conjugated with different markers and can be efficiently excited with UV LEDs simultaneously to get their multi-colour images. Based on this colour coding scheme, white blood cell sub-types can possibly be differentiated from each other.
Red blood cell density measurements
We tested whole blood samples with RBC concentrations ranging from ~ 3 × 10⁶ to 6 × 10⁶ cells per μL. To prepare the diluted blood sample to be imaged, 1 μL of whole blood was mixed with 999 μL PBS buffer directly. Then 10 μL of diluted whole blood sample was loaded into the same counting chamber, same as the one used for WBC counting experiments. Then we used the optical attachment shown in Figure 1(C-1) to take bright-field images of the RBCs after cell sedimentation. The RBC images were further processed as detailed in Figure 4. We only counted the number of RBCs within a field-of-view ~ 1.2 mm2, and typically counted ~ 400 to 700 cells per image/test. The cell-phone counted RBC results (n=12) were compared with the standard test results obtained using Sysmex KN21 hematology analyser. As shown in Figure 7(A), the two methods showed a good correlation coefficient of ~ 0.98. The cell-phone blood analyzer generated an absolute error of 5% compared to the standard test results. We further performed Bland–Altman analysis on our results (see Figure 7(B)), which shows a bias of −2.9 × 10⁴ cells/μL with 95% limits of agreement of ~2.5 × 10⁵ cells/μL and −3.2 × 10⁵ cells/μL.
Figure 7.
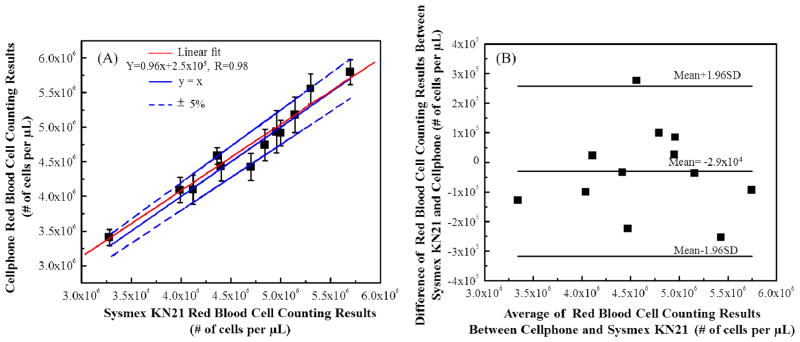
Automated RBC counting accuracy of our cell-phone based blood analyzer. (A) Comparison of cell-phone based RBC counting results with the standard test results obtained from Sysmex KN21 for 12 different blood samples. A linear regression of the experimental data (n= 12; red line) with RBC concentrations ranging from ~ 3 × 10⁶/μL to 5.5 × 10⁶/μL demonstrates a good agreement between the two modalities with a correlation coefficient of ~ 0.98. The cell-phone blood analyzer counting provides an absolute counting error of less than 5%. (B) The Bland-Altman analysis results, evaluating the accuracy of the cell-phone blood analyzer for RBC concentration measurements vs. the standard hematology analyzer. The black solid lines show a bias of −2.9×10⁴ cells/μL and the 95% limits of agreement of: ~2.5×10⁵ cells/μL (upper limit) and −3.2×10⁵ cells/μL (lower limit).
Hemoglobin density measurements
To measure hemoglobin density of blood samples in g/dL we first generated an internal “calibration curve” for our cell-phone attachment. For this end, we filled the test cuvette with DI water and measured its transmission light intensity over 9 mm2 (1000 × 1000 pixels) yielding I0. Then we added 10 μL of whole blood sample to 90 μL RBC lysing buffer solution (Hybri-Max™, Sigma-Ardrich) to lyse the RBCs. The blood sample was then mixed with lysing buffer for 5 minutes using a tube rotator. After RBCs were lysed completely, another 900 μL of PBS buffer was added to further dilute the lysed blood sample. Then the diluted blood sample was loaded into another cuvette and the transmission light intensity was measured over the same area yielding I. We then computed the absorbance value (A) for each lysed blood sample. This way we measured the absorbance values for 60 different samples with known hemoglobin concentrations (measured by Sysmex KN21) ranging from 11 g/dL to 16 g/dL and generated a linear calibration curve:
where A is the absorbance value and X is the hemoglobin density of the sample (g/dL). To test a given blood sample, the smart application on the phone computes its absorbance value (A) first and then further calculates its hemoglobin density based on this calibration equation.
To evaluate the accuracy of our cell-phone based hemoglobin measurement platform, we performed blind tests with 37 blood samples using the same approach described above. We compared the hemoglobin concentrations obtained from the cell-phone blood analyzer with the standard test results obtained with Sysmex KN21. Figure 8(A) shows the comparison of these two methods, achieving a correlation coefficient of 0.92. The absolute error of our cell-phone measurements is less than 5%. Figure 8(B) shows the Bland-Altman analysis for these two methods, revealing a bias of 0.036 g/dL with 95% limits of agreement of 0.63g/dL and −0.54g/dL.
Figure 8.

Automated hemoglobin measurement accuracy of our cell-phone based blood analyzer. (A) Comparison of cell-phone based hemoglobin measurement results with the standard test results obtained by using Sysmex KN21 for 37 different blood samples. A linear regression of the experimental data (n = 37; red line) with hemoglobin concentrations ranging from ~ 11 g/dL to 17 g/μL demonstrates a good agreement between the two modalities with a correlation coefficient of ~ 0.92. The cell-phone blood analyzer provides an absolute measurement error of less than 5%. (B) The Bland-Altman analysis results, evaluating the accuracy of the cell-phone blood analyzer for hemoglobin concentration measurements vs. the standard hematology analyzer. The black solid lines show a bias of 0.036 g/dL and the 95% limits of agreement: ~ 0.63 g/dL (upper limit) and −0.54g/dL (lower limit).
4. Conclusions
We demonstrated a compact and cost-effective cell-phone based blood analyzer that can rapidly perform WBC, RBC and hemoglobin density measurements. A universal base is attached to the cell-phone camera unit and three different add-on components can be clicked into the same port on the base attachment to perform different blood tests. The captured images are directly processed on the cell-phone using a custom-developed smart application installed on the cell-phone. The performance of this cell-phone based blood analyzer was evaluated by measuring WBC and RBC counts as well as hemoglobin concentrations of anonymous human blood samples, yielding comparable results to a standard bench-top hematology analyser. The test results can either be stored on the cell-phone memory or be transmitted to a central server, providing remote diagnosis opportunities toward telemedicine applications. With its simple sample preparation combined with a small sample volume of ~10 μL, this cell-phone based blood analysis platform is especially appealing for field settings.
Acknowledgments
A. Ozcan gratefully acknowledges the support of the von Liebig Center at UCSD through the Regional Health Care Innovation Challenge Award, Presidential Early Career Award for Scientists and Engineers (PECASE), Army Research Office Young Investigator Award, National Science Foundation CAREER Award, Office of Naval Research Young Investigator Award and National Institutes of Health Director’s New Innovator Award DP2OD006427 from the Office of the Director, National Institutes of Health.
References
- 1.Beck N. Diagnostic Hematology. Springer; 2009. [Google Scholar]
- 2.Hillman R, Ault K, Rinder H. Hematology in Clinical Application. 4. McGraw Hill Professional; 2005. [Google Scholar]
- 3.Breslauer DN, Maamari RN, Switz NA, Lam WA, Fletcher DA. PLoS One. 2009;4:e6320. doi: 10.1371/journal.pone.0006320. [DOI] [PMC free article] [PubMed] [Google Scholar]
- 4.Tseng T, Mudanyali O, Oztoprak C, Isikman SO, Sencan I, Yaglidere O, Ozcan A. Lab Chip. 2010;10:1787–1792. doi: 10.1039/c003477k. [DOI] [PMC free article] [PubMed] [Google Scholar]
- 5.Zhu H, Yaglidere O, Su T, Tseng D, Ozcan A. Lab Chip. 2010;11:315–322. doi: 10.1039/c0lc00358a. [DOI] [PMC free article] [PubMed] [Google Scholar]
- 6.Zhu H, Mavandadi S, Coskun AF, Yaglidere O, Ozcan A. Anal Chem. 2011;83:6641–6647. doi: 10.1021/ac201587a. [DOI] [PMC free article] [PubMed] [Google Scholar]
- 7.Smith ZJ, Chu K, Espenson AF, Rahimzadeh M, Gryshuk A, Molinaro M, Dwyre DM, Lane S, Mattews D, Wachsmann-Hogiu S. PlosOne. 2011;6:e17150. doi: 10.1371/journal.pone.0017150. [DOI] [PMC free article] [PubMed] [Google Scholar]
- 8.Lu Y, Shi W, Qin J, Lin B. Electrophoresis. 2009;30:579–582. doi: 10.1002/elps.200800586. [DOI] [PubMed] [Google Scholar]
- 9.Martinez AW, Philips ST, Carrilho E, Thomas SW, Sindi H, Whitesides GW. Anal Chem. 2008;80:3699–3707. doi: 10.1021/ac800112r. [DOI] [PMC free article] [PubMed] [Google Scholar]
- 10.Zhu H, Sikora U, Ozcan A. Analyst. 2012;137:2541–2544. doi: 10.1039/c2an35071h. [DOI] [PMC free article] [PubMed] [Google Scholar]
- 11.Mudanyali O, Dimitrov S, Sikora U, Padmanabhan S, Navruz I, Ozcan A. Lab Chip. 2012;12:2678–2686. doi: 10.1039/c2lc40235a. [DOI] [PMC free article] [PubMed] [Google Scholar]
- 12.Preechaburana P, Gonzalez MC, Suska A, Flippini D. Angew Chem Int Ed. 2012;12:11585–11588. doi: 10.1002/anie.201206804. [DOI] [PubMed] [Google Scholar]
- 13.Coskun A, Wong J, Khodadah D, Nagi R, Tey A, Ozcan A. Lab Chip. 2012 doi: 10.1039/C2LC41152K. [DOI] [Google Scholar]
- 14.You DJ, Park TS, Yoon J. Biosensens Bioelecron. 2013;40:180–185. [Google Scholar]
- 15.Shen L, Hagen JA, Papautsky I. Lab Chip. 2012;12:4240–4243. doi: 10.1039/c2lc40741h. [DOI] [PubMed] [Google Scholar]
- 16.International Telecommunication Union. Market information and statistics. 2012 http://www.itu.int/ITU-D/ict/statistics/index.html.
- 17.Kiesel P, Bassler M, Beck M, Johnson N. Appl Phys Lett. 2009;94:041107–3. [Google Scholar]
- 18.Ozcan A, Demirci U. Lab Chip. 2008;8:98–106. doi: 10.1039/b713695a. [DOI] [PubMed] [Google Scholar]
- 19.Scott Prahl. Available at: http://omlc.ogi.edu/spectra/hemoglobin.