

Abstract
Emotion regulation strategies can alter behavioral and physiological responses to emotional stimuli and the neural correlates of those responses in regions such as the amygdala or striatum. The current study investigates the brain systems engaged when using an emotion regulation technique during financial decisions. In decision making, regulating emotion with reappraisal-focused strategies that encourage taking a different perspective has been shown to reduce loss aversion as observed both in choices and in the relative arousal responses to actual loss and gain outcomes. In the current study, we find using fMRI that behavioral loss aversion correlates with amygdala activity in response to losses relative to gains. Success in regulating loss aversion also correlates with the reduction in amygdala responses to losses but not to gains. Furthermore, across both decisions and outcomes, we find the reappraisal strategy increases baseline activity in dorsolateral and ventromedial prefrontal cortex and the striatum. The similarity of the neural circuitry observed to that seen in emotion regulation, despite divergent tasks, serves as further evidence for a role of emotion in decision making, and for the power of reappraisal to change assessments of value and thereby choices.
Keywords: emotion, reappraisal, emotion regulation, decision making, loss aversion
INTRODUCTION
Decision making is not dispassionate but is instead fundamentally supported by emotions (Loewenstein, 1996; Frank et al., 2009; Phelps, 2009). Evidence of this comes from two sources. First, decision-making studies, measuring components of emotion such as arousal, have shown that physiological responses correlate with information like imminent losses (Bechara et al., 1997), volatility (Lo and Repin, 2002), anger during interpersonal interactions (van't Wout et al., 2006) and deception (Wang et al., 2010). The second source of evidence for the involvement of emotion in decision making comes from studies manipulating emotion during choices, demonstrating the causality of the relationship (Lerner et al., 2004; Winkielman et al., 2005; Harlé and Sanfey, 2007; Andrade and Ariely, 2009). The neural mechanisms of decision making also include regions like the amygdala and insula (Bechara et al., 1997; Gottfried et al., 2003; Paulus et al., 2003; Hsu et al., 2005; Shiv et al., 2005; Murray, 2007; Clark et al., 2008), traditionally associated with emotion and physiological responses (Morris et al., 1996; Whalen et al., 1998; LeDoux, 2000; Critchley et al., 2004). This connection between emotion and choices is further supported by studies of patients with damage to those same regions (Shiv et al., 2005; De Martino et al., 2010), providing compelling evidence that the mechanisms underlying emotions and choice overlap.
Emotions are also known to be actively generated in part by our thoughts or appraisals (Schachter and Singer, 1962), suggesting that by changing appraisals, we can change emotions. This concept led to a large body of research on regulating emotions with reappraisal (Gross, 1998), demonstrating its power to alter emotional responses (Ochsner et al., 2002; Eippert et al., 2007; Delgado et al., 2008a). Neurally, dorsolateral and ventromedial prefrontal cortex (DLPFC and VMPFC) are consistently identified in the regulation of emotion, and the amygdala and striatum in representing value and processing emotion (Ochsner and Gross, 2008; Hartley and Phelps, 2010).
The behavioral and physiological consequences of the reappraisal of decision making were demonstrated in a recent study (Sokol-Hessner et al., 2009). Participants showed greater skin conductance responses to losses compared to gains in a baseline condition, and this differential arousal correlated with behavioral estimates of loss aversion (the relative decision weight of losses to gains). In a second condition, participants reappraised choices from a broader perspective, reducing loss aversion behaviorally and eliminating over-arousal to losses relative to gains by decreasing loss responses.
Studies of the neural correlates of loss aversion have implicated both the striatum and the amygdala. One functional magnetic resonance imaging (fMRI) study found striatal activity at decision reflected the overall expected utility of the choice, including loss aversion (Tom et al. 2007). However, others linked amygdala activity to the endowment effect (Weber et al., 2007), often interpreted as a behavioral consequence of loss aversion (Tversky and Kahneman, 1991). Similarly, patients with amygdala damage show reduced loss aversion (De Martino et al., 2010). Though these latter findings linking the amygdala to loss aversion conflict with the quantitative fMRI exploration of loss aversion with functional imaging, we note that Tom et al. (2007) had only decisions and no outcomes. Consequently, one possible model is that the amygdala may mediate loss aversion in responses to outcomes, accounting for Weber et al. (2007) and De Martino et al. (2010), and that the weights in those outcome responses may be passed on to the striatum, leading it to represent loss aversion at the time of decision as in Tom et al. (2007). As reappraisal modulates loss aversion behaviorally, we would therefore expect to see changes in the striatum and amygdala as a result of regulation.
In the present study, we ask whether the neural mechanisms underlying reappraisal in decision making are similar to those known to support intentional emotion regulation. Such similarity would suggest a central role for emotions and their regulation in decision making. It would also close the distance between emotions and valuation, and emotion regulation and reappraisal in choice, arguing that they are simply instantiations of the same processes and mechanisms in different contexts.
In a within-subjects design, participants were scanned while making risky monetary choices in each of two conditions. In the ‘Attend’ condition, participants considered each choice on its own merit, as if it was the only choice they were making. In the ‘Regulate’ condition, participants took a broader perspective and considered each choice in its greater context, as one of many. We estimated participants’ loss aversion, risk attitudes and consistency over choices in each condition. Analyses of the fMRI data focused on correlates of loss aversion and its reduction, as well as the application of the ‘Regulate’ intentional strategy.
EXPERIMENTAL PROCEDURES
Participants
Sixty-three participants (34 female, mean age 19.8 ± 3.1 years) took part in the study. Of those, nine were removed for excess motion, and seven were excluded for other reasons (See ‘Detailed Participant Exclusions’ in Supplementary Data for more details). The remaining 47 participants (27 female, mean age 20.1 ± 1.7 years) were entered into the decision analysis. For analysis of outcomes, seven participants were excluded for not having enough outcome trials [exclusion criterion: fewer than 10 trials in 2 or more outcome categories (e.g. ‘Attend’ win, ‘Regulate’ loss)]. The outcomes analyses include the remaining 40 participants (24 female, mean age 20.2 ± 1.7 years). One participant was excluded from the loss aversion coefficient (represented by λ) correlational analyses for having an ‘Attend’ log(λ) value greater than three standard deviations above the mean. All correlations with λ were performed on the remaining 39 participants. All participants gave informed consent as approved by the University Committee on Activities Involving Human Subjects at New York University, and in accordance with the Declaration of Helsinki.
Behavioral procedure
Participants were thoroughly instructed in all details and contingencies of the task, successfully completed a brief quiz assessing comprehension of the instructions, practiced use of the strategies with the experimenter and did a practice block of trials before scanning.
Immediately after giving informed consent, participants were endowed with $30, told the money was theirs to risk during the study, and asked to place it in their wallets or purses. After the task, 10% of all the trials in which feedback was presented (30 out of 300 trials) were randomly selected. Participants were paid the $30 plus the sum of their actual outcomes in those trials. Participants could lose up to the entire $30 endowment, and could gain up to a theoretical maximum of an additional $662. All participants also received a $75 ($25/h) subject fee upon completion of the study.
Participants completed two identical sets of choices (Figure 1) with different intentional cognitive strategies. For the ‘Attend’ strategy, participants were asked to consider each choice in isolation from any context, as if it was the only choice in the entire study. For the ‘Regulate’ strategy, participants were asked to consider each choice in a greater context, remembering that each choice was one of many or part of a portfolio. The conceptual nature of these strategies was emphasized by asking participants not to keep a running tally of their previous outcomes or overall earnings. Similar to typical studies of emotion regulation (e.g. Ochsner et al., 2002), detailed strategy instructions were read aloud, and participants were given a chance to ask questions about the strategies. They were then encouraged to repeat the strategies back to the experimenter in their own words. After a brief set of practice trials completed with the experimenter, participants completed a longer set of practice trials alone, after which they could again ask questions about the strategies. The full text of the strategies is in the Supplementary Data.
Fig. 1.

A schematic of the sequence of events for a full trial. Participants made a series of forced monetary choices between gambles (winning or losing with equal P = 0.5) and a guaranteed alternative (P = 1), with outcome screens following each choice. Symbols of ‘+’ and ‘−’ stand in for actual monetary amounts presented on each trial. After initial presentation of the gamble and the guaranteed amount (2 s; 1TR), the appearance of button cues indicated a response period (2 s) during which participants could either accept the gamble or reject it for the guaranteed alternative. After a poisson-distributed variable interstimulus interval (ISI; 2–8 s, mean 4.1 s), the outcome screen was presented (2 s) consisting of a win or lose screen with equal probability if the gamble had been accepted, otherwise the guaranteed alternative if the gamble had been rejected. Finally, a poisson-distributed variable intertrial interval (ITI; 4–12 s, mean 6.4 s) separated each trial from the next.
The choices presented to participants were identical for the two instructed strategies, but the win/loss outcomes varied randomly across trials. Each ‘set’ of 150 choices was designed to allow the dissociation of several aspects of behavior (see below, ‘Behavioral Model’ section). Out of the 150 choices, 120 were between a mixed gamble (positive and negative possible outcomes) and a guaranteed amount of zero, and 30 were between gain-only gambles (positive and zero possible outcomes) and positive guaranteed amounts (see Supplementary Data for exact monetary amounts). Participants had to either accept the gamble, in which case they won or lost with equal probability, or reject it for the guaranteed amount. Each decision was immediately followed by its outcome, prior to the next trial beginning. See Figure 1 for trial details and timing. In addition to the 300 ‘full’ trials (consisting of choice, inter-stimulus interval (ISI), outcome, and inter-trial interval (ITI); 150 in each ‘Attend’ and ‘Regulate’), there were 64 partial trials (consisting only of choice, partial trial indicator and ITI; 32 in each ‘Attend’ and ‘Regulate’) to allow accurate separation of decision and outcome blood oxygenation level-dependent (BOLD) activity (Ollinger et al., 2001a, 2001b). The partial trial indicator following the response period consisted of 1s of normal (white) fixation and 1s of a red fixation cross.
Each block was completed using one of the two strategies (14 blocks each for ‘Attend’ and ‘Regulate’, for 28 blocks total; 4 blocks per functional run). Blocks were preceded by a cue (4s; followed by 2s fixation) indicating which strategy to use for the following trials. There were no gaps between blocks, other than the ITI following the last trial of the block, after which the cue for the next block was displayed. Blocks were pseudorandomly ordered such that no strategy occurred more than four times in a row at any point (including across runs). Participants completed one of four counterbalanced task orders which were independently randomized along the following dimensions: order of condition blocks (‘Attend’, ‘Regulate’), gamble outcomes (‘win’, ‘lose’), and gamble order within each condition block.
Behavioral model
Choice behavior was estimated with a prospect theory-inspired (Kahneman and Tversky, 1979) three parameter model (Sokol-Hessner et al., 2009). Gains and losses were modeled with Equations (1) and (2), respectively. The resulting subjective utility estimates were used in the softmax function in Equation (3), translating the subjective difference between the gamble and the guaranteed amount into a probability of gamble acceptance.
| (1) |
| (2) |
| (3) |
Lambda (λ, the loss aversion coefficient) appears only in the utility function for losses [Equation (2)]. It represents the multiplicative weighting of the subjective value of losses relative to gains. When λ > 1, losses are overvalued relative to gains of the same size (‘loss averse’). When λ = 1, gains and losses are valued equally (‘gain-loss neutral’). When λ < 1, gains are overvalued relative to losses (‘gain-seeking’). Rho (ρ, the curvature of the function) represents risk attitudes and diminishing sensitivity to changes in value as the absolute value increases. Mu (µ, the logit sensitivity) represents the consistency of participants’ decisions across multiple choices.
The model was estimated for each individual participant separately in the ‘Attend’ and ‘Regulate’ conditions with a Nelder–Mead simplex maximum likelihood procedure in Mathematica (Wolfram Research, Champaign, IL, USA). Overall model significance for each participant in each condition was evaluated against a random-choice model with a likelihood ratio test, determining whether the probability of the data observed was significantly higher given the estimated parameters. Within-subject changes in parameters were similarly evaluated with likelihood ratio tests of the full model (containing all ‘Attend’ and ‘Regulate’ parameters) against reduced models which restricted parameter values to be identical in ‘Attend’ and ‘Regulate’.
Scanning parameters
Scanning was performed at NYU's Center for Brain Imaging with a 3T Siemens Allegra head-only scanner and a Nova Medical head coil (model NM011). High-resolution anatomical images were acquired using a T1-weighted protocol (Field of view (FOV) = 256, 176 slices, 1 × 1 × 1 mm). Functional imaging used a single-shot gradient echo echo-planar imaging (EPI) sequence (TR = 2000 ms, TE = 30 ms, FOV = 192, flip angle = 90°), acquiring 7 functional runs of 421 volumes, each with 36 contiguous 3 mm isovoxel oblique axial slices aligned parallel to the AC–PC plane. Data were preprocessed with BrainVoyager software (Brain Innovation, Maastricht, The Netherlands), including motion correction, slice-time correction and spatial smoothing (4 mm FWHM Gaussian kernel). Functional runs were coregistered to the high-resolution anatomical after which all scans were transformed to Talairach space (Talairach and Tournoux, 1988). Data used in general linear models (GLMs) were temporally high-pass filtered (period = 128 s) with SPM8's filtering tool (Statistical Parametric Mapping 8, http://www.fil.ion.ucl.ac.uk/spm/) prior to analysis. Trial-triggered averages were taken from data that had not been temporally high-pass filtered. Analysis was performed with BrainVoyager and custom Matlab scripts (Mathworks, Natick, MA, USA).
GLMs were estimated on a fixed-effects level for each participant. The results were then subjected to random effects group-level contrasts in order to functionally define regions of interest (ROIs) for use in other analyses.
Analyses of decisions included all 47 participants. The GLM used for these analyses included, separately for ‘Attend’ and ‘Regulate’, a main effect (indicator) regressor for mixed valence decisions and a parametric regressor with the subjective expected utility of the decision (calculated using the participant's estimated value functions) at the time of gamble presentation in the mixed-valence trials. For completeness, the GLM also included main effect regressors (separately for ‘Attend’ and ‘Regulate’) for mixed-valence win outcomes, mixed-valence loss outcomes, mixed-valence guaranteed outcomes, gain-only decisions, gain-only outcomes and block cues.
Analyses of outcomes were performed with the 40 participants with enough trials to support estimation (see Experimental Procedures: Participants). In order to eliminate statistical issues associated with having few trials of a given type in a single functional run, participants’ functional runs were temporally concatenated to form one long run. The GLM used for these analyses included, separately for ‘Attend’ and ‘Regulate’, a main effect (indicator) regressor for mixed-valence win outcomes, another for mixed-valence loss outcomes and parametric regressors with the win amount in dollars, and similarly with the loss amount. For completeness, the GLM also included main effect regressors (separately for ‘Attend’ and ‘Regulate’) for mixed valence decisions, mixed-valence guaranteed outcomes, gain-only decisions, gain-only outcomes and block cues. Additional parametric regressors included the subjective expected utility of the decision (calculated using the participant's estimated value functions) at the time of gamble presentation, and the prediction error associated with an outcome at the time of outcome presentation, calculated as the difference between the subjective utility of the outcome and the subjective expected utility of the gamble.
All parametric outcome predictors were orthogonalized against the relevant main effect regressors, and the prediction error regressors were subsequently orthogonalized against the main effect and parametric regressors.
In all GLMs, nuisance predictors included indicators for the decision and outcome periods when participants failed to respond in time, the occurrence of partial trial indicators, and motion estimates (six total: translation and rotation in each of three orthogonal planes). The outcome analyses (performed on the concatenated data) also included a constant factor for each functional run. All predictors except the motion estimates and run constants were convolved with the BrainVoyager hemodynamic response function (HRF).
The blocked nature of our task made it possible for two different patterns to be observed in BOLD activity as a result of the perspective-taking regulation strategy. First, it is possible that transient responses to events (e.g. loss outcomes) were altered by regulation, such that the observed β-values from a general linear model would be different between conditions (‘Attend’ or ‘Regulate’). However, because the conditions occurred in blocks, it is additionally possible that there were longer lasting changes consistent with this perspective shift, independent of individual trial events (e.g. Donaldson et al., 2001; Visscher et al., 2003). That is, regulation in this setting could include not just altering an event-specific response, but also maintaining a perspective across any particular type of event, manifesting in a baseline shift in BOLD activity (in contrast to the transient responses to events). To get at any potential baseline shifts across blocks, we used the technique of trial-triggered averaging (e.g. Buckner et al., 1996), which is not constrained by assumptions about the shape of the hemodynamic response. Beginning with the timepoint at the start of the event of interest (e.g. decision), we calculated individuals’ average BOLD signal at each timepoint during that event, and then combined across individuals to produce a group-level average of the mean BOLD signal at each timepoint. We then compared these average BOLD signal time courses across conditions (‘Attend’ or ‘Regulate’). The data used for this analysis was non-high-pass filtered BOLD activity extracted from ROIs.
RESULTS
Behavioral results
Estimates of the behavioral model parameters across 47 participants were consistent with previous results using this choice paradigm (Sokol-Hessner et al., 2009), and in many other paradigms including naturally occurring field data (Camerer et al., 1997; Genesove and Mayer, 2001; Haigh and List, 2005). Mean ‘Attend’ parameter values (with standard errors of the mean) were λ = 1.62 (0.14; loss aversion), ρ = 0.88 (0.04; risk attitudes), and µ = 3.26 (0.61; consistency over choices). Since the distribution of the loss aversion coefficient λ across people is typically right-skewed, taking its log is more conducive to standard statistical testing. The mean log(λ) value in the ‘Attend’ condition was 0.34 (0.08), corresponding to λ = 1.41. In the ‘Regulate’ condition, mean parameter values were λ = 1.33 (0.11), ρ = 0.91 (0.04) and µ = 2.93 (0.38). The mean log(λ) value was 0.17 (0.07), corresponding to λ = 1.19.
To compare estimates between ‘Attend’ and ‘Regulate’ at the group level, we performed two-tailed paired t-tests of participants’ parameter estimates in ‘Attend’ vs those in ‘Regulate’. These tests indicated a significant difference for λ [loss aversion; t(46) = 4.52, P < 5 × 10⁻⁵; using log(λ), t(46) = 4.94, P < 2 × 10⁻⁵], but no difference in either risk-aversion [ρ; t(46) = 0.90, P < 0.38] or consistency [µ; t(46) = 0.77, P < 0.45]. Thus, there is a consistent, selective effect of the ‘Regulate’ strategy in decreasing loss aversion from ‘Attend’ to ‘Regulate’ (λATTEND–λREGULATE, as a percentage of λATTEND) by an average of 14% (Figure 2).
Fig. 2.
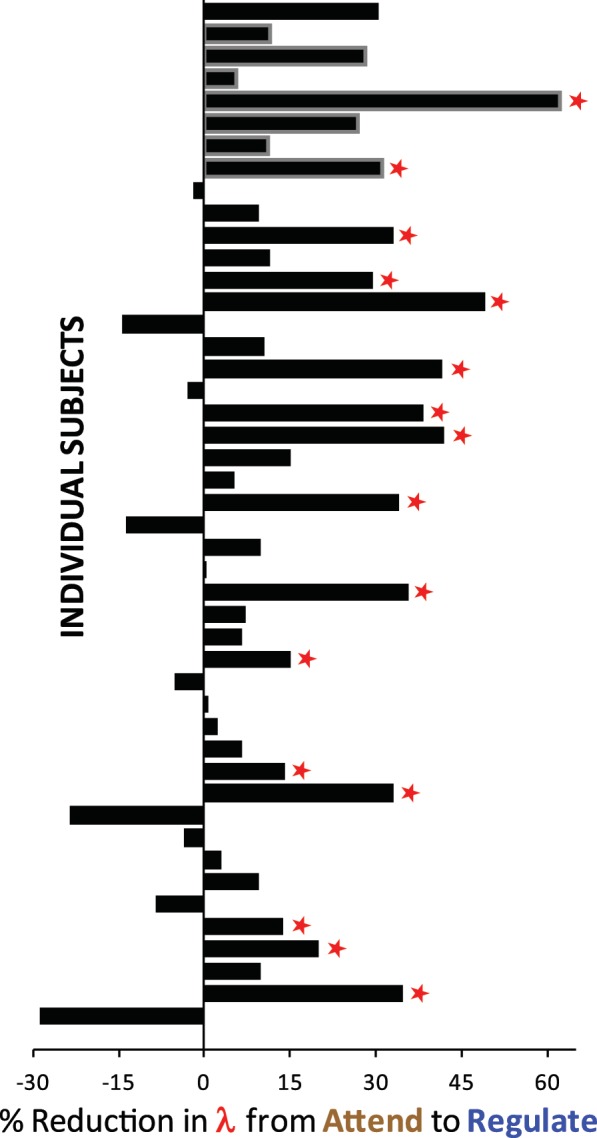
Regulation reduced loss aversion. Percent reduction in behavioral estimates of individuals’ loss aversion from ‘Attend’ to ‘Regulate’ (100 × (λATTEND − λREGULATE)/ λATTEND). A positive number indicates less loss aversion in the ‘Regulate’ condition. Bars outlined in gray were subjects excluded from the analysis of outcomes (see Experimental Procedures: Participants). Red stars indicate individuals whose shift in loss aversion was individually significant at the P < 0.05 level. Participants are descendingly ordered by loss aversion, with the most loss averse at the top, and the least loss averse at the bottom.
We found that 37 individuals (out of 47 participants; 79%) showed some decrease in λ from ‘Attend’ to ‘Regulate’, comparable to previous findings (86% in Sokol-Hessner et al., 2009). Because of the unique, quantitative nature of our task, we were able to characterize individual differences in the strength of that effect. We examined individuals’ behavior for significant differences in value parameters between ‘Attend’ and ‘Regulate’ using likelihood ratio tests (LRTs; see Supplementary Data for more details). Out of 47 participants, 16 had significant shifts in λ (all ‘Regulate’ < ‘Attend’) at a threshold of P < 0.05. We identified these participants as ‘Regulators’. The remaining 31 participants who did not show a significant decrease in loss aversion we identified as ‘Non-Regulators’. LRTs performed on the other parameters found 8 out of 47 significant shifts in ρ (two ‘Regulate’ < ‘Attend’), and 9 out of 47 in µ (6 ‘Regulate’ < ‘Attend’). Since these differences were neither large nor systematic, the remainder of the analysis focuses on λ, the loss aversion coefficient.
LRTs assessing the overall significance of the estimated models in both ‘Attend’ and ‘Regulate’ were overwhelmingly significant (all Ps < 10−6). We also calculated the mean predicted likelihood of participants’ choices given the estimated parameters. Across participants, the average predicted likelihood of a choice given the estimates was 0.75 (s.e. = 0.01) in ‘Attend’ and 0.73 (s.e. = 0.01) in ‘Regulate’, demonstrating that choices were predicted imperfectly, but much better than chance (See Supplementary Data for more details).
Imaging results
We performed two types of analysis on the fMRI data. First, we examined event-specific, transient responses by analyzing parameter estimates (β's) of activity across the brain. Second, because of the blocked nature of the reappraisal task, we thought there might be baseline shifts in activity as a function of condition (i.e. ‘Attend’ or ‘Regulate’), in addition to any event-specific effects. In order to investigate this possibility, we analyzed trial-triggered averages of fMRI BOLD signal to look for baseline shifts in activity across decision and outcome. See Table 1 for detailed contrast results.
Table 1.
Contrast and correlation activations
 |
Correlates of loss aversion at decision and outcome
In our analysis of β's, we looked for correlates of loss aversion separately at decision and outcome. A previous study of loss aversion examined activity at the time of decision and found that activity in the ventral striatum and other regions reflected the overall expected utility (including the estimated degree of loss aversion) of the potential losses and gains being considered (Tom et al., 2007). Since gain and loss values were presented simultaneously at the time of decision and were correlated (see Methods in Supplementary Data), it was not possible to independently analyze the BOLD response to losses or to gains at decision. Instead, we calculated the expected utility of the mixed valence gambles in the baseline ‘Attend’ condition using participants’ individually estimated value functions, including their unique λ estimate. This parametric regressor was then entered into a whole-brain analysis, identifying regions of the brain whose activity correlated with the expected utility (including loss aversion) of the gamble being considered. Among the regions whose activity at decision correlated with this regressor was the bilateral striatum (Table 1; see also Supplementary Data), consistent with previous results suggesting a unified representation in that region of expected utility at decision (e.g. Hsu et al., 2005; Preuschoff et al., 2006).
In analyzing outcome-related activity for correlates of behavioral loss aversion, we were able to separately estimate the BOLD responses to loss outcomes and gain outcomes (since only one outcome occurred at any given time), and then do second-level correlations and contrasts with those estimates. We performed a correlation of the log of individuals’ λ values (loss aversion) in ‘Attend’ with the voxelwise contrast of ‘Attend’ Loss > ‘Attend’ Win across the entire brain (both main effect, or binary predictors). This analysis revealed a region of the left amygdala as the sole neural correlate at outcome of behavioral loss aversion under these conditions [r(37) = 0.58 P < 0.0002; Figure 3A; Figure 3B is a replotting of the correlation for illustrative purposes only; see Table 1 for whole-brain correlation details]. Previous findings related behavioral loss aversion to physiological arousal responses to loss vs gain outcomes in a parallel fashion (Sokol-Hessner et al., 2009). Since the amygdala is known to mediate arousal responses across a variety of contexts (Phelps et al., 1998; Garavan et al., 2001; Williams et al., 2001; Glascher and Adolphs, 2003; McGaugh, 2004), these findings serve as further evidence that the aforementioned arousal–loss aversion relationship may be amygdala mediated. A similar whole-brain correlation of the behavioral loss aversion coefficient from the ‘Regulate’ condition with the contrast of ‘Regulate’ Loss > ‘Regulate’ Win did not identify any of our predefined regions of interest (Table 1). Additionally, estimates of activity extracted from the left amygdala ROI did not show a strong relationship with loss aversion in the ‘Regulate’ condition [r(37) = 0.23 P < 0.16]. Fisher's r-to-z transformation indicated that the ‘Attend’ and ‘Regulate’ correlations were weakly different (z = 1.82, P = 0.07).
Fig. 3.
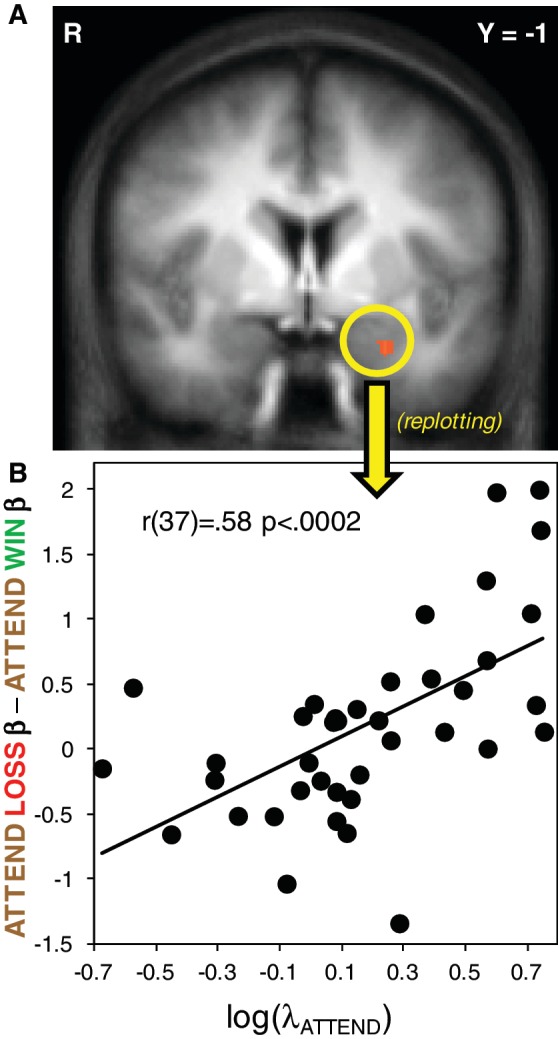
Whole-brain correlation between loss aversion and outcome activity. (A) Whole-brain voxelwise correlation between individuals’ estimated λATTEND and the contrast values for ‘Attend’ Loss − ‘Attend’ Win. Map thresholded at P < 0.005, voxel extent threshold = 81 mm3; (B) Replotting of the correlation for illustration only.
Transient effects of regulation at outcome
In our previous behavioral and physiological study, we found that individuals who successfully reduced their loss aversion with the emotion regulation strategy (‘Regulators’) showed reductions in their physiological arousal responses to loss outcomes (Sokol-Hessner et al., 2009). In the present study, there were two ways to examine changes in outcome responses—on a group level (within and between ‘Regulators’ and ‘Non-Regulators’), and using more continuous tests (correlations with regulation success). In both cases, we analyzed the main-effect parameter estimates of activity extracted from the left amygdala region identified in the correlation with loss aversion (see previous section and Table 1), and analyzed those β's for changes from ‘Attend’ to ‘Regulate’.
Using the first, group-based approach, we looked at changes in activity to losses and to gains for the ‘Regulators’. Similar to our previous study's arousal results, the ‘Regulator’ participants showed a strong reduction in their amygdala responses to losses [mean ‘Regulate’ Loss β − ‘Attend’ Loss β = −0.26; t(13) = 2.21, P < 0.05], while ‘Non-Regulators’ showed no such change (mean ‘Regulate’ Loss β − ‘Attend’ Loss β = −0.01; t(24) = 0.08, P < 0.95), a difference that was significant between groups [one-tailed two-sample unequal variance t-test; t(36.25) = 1.67, P = 0.05]. In the case of win outcomes, both ‘Non-Regulators’ and ‘Regulators’ showed similarly sized increases in their left amygdala responses (‘Regulators’ mean ‘Regulate’ Win β − ‘Attend’ Win β = 0.35; t(13) = 1.62, P < 0.13; ‘Non-Regulators’ mean ‘Regulate’ Win β − ‘Attend’ Win β = 0.34; t(24) = 2.90, P < 0.008) (Figure 4).
Fig. 4.
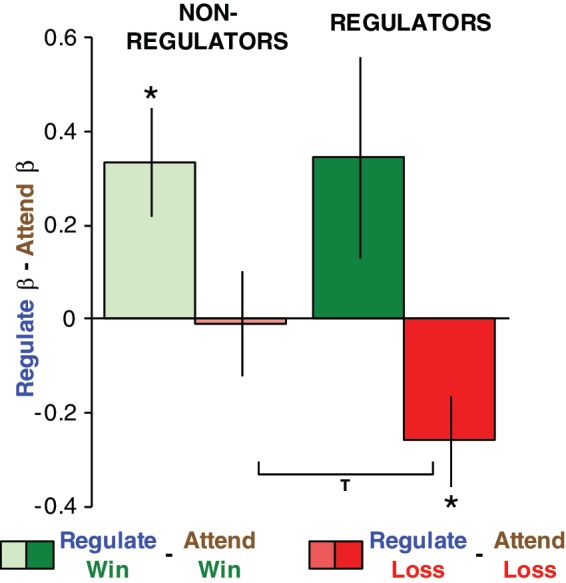
Successful regulators reduce amygdala responses to loss outcomes. β estimates are extracted from the left amygdala region identified in Figure 3 and Table 1. Y-axis is the β estimate in ‘Regulate’ minus that in ‘Attend’ for either wins (greens) or losses (reds). Positive numbers indicate increased activity in ‘Regulate’, negative numbers indicate reduced activity in ‘Regulate’. Asterisks indicate significantly different from zero at P < 0.05. “T” indicates a significant group difference (one-tailed two-sample unequal variance t-test, P = 0.05).
Taking the second, correlational approach to examining the relationship between regulation success and outcome processing, we performed correlations across all participants (both ‘Regulators’ and ‘Non-Regulators’) of individuals’ percent reduction in λ (loss aversion) with the reduction in left amygdala responses to loss outcomes, and to win outcomes. Regulation success was marginally significantly correlated in the left amygdala ROI with reduction in BOLD responses to loss outcomes (Percent reduction in λ correlated with ‘Attend’ Loss β − ‘Regulate’ Loss β; r(37) = 0.26, P < 0.08), but was not correlated with change in responses to gain outcomes (Percent reduction in λ correlated with ‘Attend’ Win β − ‘Regulate’ Winβ; r(37) = −0.11, P < 0.49), though the difference between the Loss β and Gain β correlations was not significant (Fisher's r-to-z transformation, z = 1.6, P = 0.11).
The findings from both group-level and correlational approaches implicate the regulation of loss outcome responses in the successful attenuation of behavioral loss aversion, directly echoing previous results with physiological arousal (Sokol-Hessner et al., 2009).
Baseline effects of regulation across decision and outcome
Two final sets of contrasts were used to examine responses in regions of the brain related to regulation and choice behavior, in keeping with the expectation of regulation-related effects at decision and changes in the processing of outcomes as a consequence of regulation. The regions of interest were defined as follows. First, the contrast of the main effect of a ‘Regulate’ decision vs that of an ‘Attend’ decision (‘Regulate’ Decision > ‘Attend’ Decision) was performed on the ‘Regulators’, identifying a region of the right DLPFC related to the application of the regulation strategy. The DLPFC has been repeatedly implicated in studies of emotion regulation (Ochsner et al., 2002, 2004; Banks et al., 2007; Eippert et al., 2007; Delgado et al., 2008a, 2008b; Ochsner and Gross, 2008; Hartley and Phelps, 2010). Second, areas related to value computation, including the bilateral striatum and VMPFC, were identified by contrasting estimates of BOLD activity to gain outcomes with that to loss outcomes (‘Attend’ Win > ‘Attend’ Lose; see Table 1 for full list of regions identified in both contrasts).
Since the regulation task was blocked (choices were in sets of 25; see Experimental Procedures section), we were able to examine whether any changes might have occurred in baseline levels of BOLD activity as a function of regulation by using trial-triggered averaging (see ‘Methods’ section). In contrast to the previously discussed event-specific transient responses represented by β estimates of activity, we expected to observe baseline increases in activity over the entire time course as a result of the condition (‘Attend’ or ‘Regulate’). For each of the aforementioned regions of interest, trial-triggered averages were calculated for all participants with sufficient data for outcome analyses (n = 40).
As mentioned above, the first contrast (‘Regulate’ Decision > ‘Attend’ Decision) identified voxels in the DLPFC. Confirming the transient-focused contrast of β's used to define this region of DLPFC, the trial-triggered averages across the decision period exhibited greater activity in the ‘Regulate’ condition as opposed to the ‘Attend’ condition [t(6) = 8.2, P < 0.0002]. Interestingly, that increase in baseline activity persisted throughout the outcome phase [during wins, t(6) = 4.9, P < 0.003; during losses, t(6) = 6.2, P < 0.0008].
Trial-triggered averages from the striatum and VMPFC, identified in the second contrast (‘Attend’ Win > ‘Attend’ Lose), exhibited a parallel pattern to DLPFC activity. Separate ANOVAs performed on the left striatum and the VMPFC also showed increased activity in the ‘Regulate’ condition as compared to ‘Attend’ at decision [repeated measures ANOVA, condition (2) x TR (7); Left striatum main effect of condition F(1,39) = 4.1, P < 0.05; VMPFC main effect of condition F(1,39) = 5.1, P < 0.03], as well as outcome [repeated measures ANOVA, condition (2) x outcome type (2) x TR (7); Left striatum main effect of condition F(1,39) = 7.9, P < 0.008; VMPFC main effect of condition F(1,39) = 14.8, P < 0.001] (Right striatum results were similar to the left striatum; See Supplementary Table S2 for full ANOVA results). This result was further confirmed by planned paired t-tests for both the striatum [left striatum at decision t(6) = 4.5, P < 0.004; during wins, t(6) = 14.5, P < 7 × 10⁻⁶; and during losses, t(6) = 6.6, P < 6 × 10⁻⁴], and for the VMPFC [at decision t(6) = 5.5, P < 0.002; during wins, t(6) = 22.6, P < 5 × 10⁻⁷; and during losses, t(6) = 4.5, P < 0.005] (Figure 5). The data from both striatum and VMPFC suggest that baseline shifts, like those observed in DLPFC above, may also extend into regions more generally associated with value representation.
Fig. 5.

Trial-triggered averages for activity in (A) right DLPFC, (B) VMPFC and (C) left striatum. Brown diamonds represent ‘Attend’ activity, and blue circles represent ‘Regulate’ activity. Decision activity is indicated with filled-in markers, outcome activity with outlined markers, and wins and losses with solid and dotted lines, respectively. The contrasts used to define the ROIs are indicated on the right, and their respective lines are plotted in gray on the graph. Decision activity is locked to the time of decision presentation (TRs 0 and 1, indicated by gray block on X-axis). Outcome activity is locked to the presentation of the outcome (labeled TR 7 on the graph, indicated by gray block on X-axis). Error bars are standard error of the mean
DISCUSSION
In the present study, we examine the BOLD correlates of loss aversion during a risky decision-making task and the effect of intentionally reappraising the meaning of the choice on decisions and brain activity. We find striking similarities both to previous studies directly assessing emotional responses in decision making, as well as to studies of emotion regulation in non-choice domains. Our three main results are: (i) amygdala activity to losses vs gains correlates with estimates of behavioral loss aversion; (ii) individuals’ degree of success in regulating their choices is correlated with changes in amygdala responses to losses only—a pattern that directly echoes previous findings with physiological emotional responses (Sokol-Hessner et al., 2009); and (iii) baseline increases in BOLD activity during reappraisal in regions of the brain, including DLPFC, VMPFC and striatum, that mirror regulation-related activity found in other studies of emotion regulation (Ochsner et al., 2002, 2004; Banks et al., 2007; Eippert et al., 2007; Delgado et al., 2008a, 2008b). Together, these results suggest that the observed BOLD correlates of reappraisal during decision-making overlap with those from emotion regulation. As perspective taking, by definition, alters appraisals, a component of emotion (Scherer, 2005) and emotion regulation (Gross, 1998), these findings confirm the importance of emotion regulation in decision making. Specifically, they suggest value computation includes emotional components that can be intentionally shifted, just like other emotional responses.
Behaviorally, other studies on emotion regulation differ from the current study in that their quantitative analyses of regulation success focused on the group level (Ochsner et al., 2002, 2004; Banks et al., 2007; Eippert et al., 2007; Delgado et al., 2008a, 2008b; Wager et al., 2008; Urry et al., 2009). While we performed group-level analyses, the nature of our task also enabled a second level of analysis, in which we were able to quantitatively investigate the strength or significance of our effect on an individual–participant basis. This approach was as unique to the study of emotion regulation as it was critical in characterizing some of our effects.
In addition to this study, we are aware of two others that have quantitatively estimated individuals’ loss aversion, and examined the relationship to neural function. First, Tom et al. (2007), found a unified representation of expected utility (which included loss aversion) in VMPFC and striatal responses (among other regions; but not the amygdala) at the time of decision over mixed valence gambles. We also found bilateral striatal activity at decision representing expected utility, implicating the striatum in loss aversion. The second study, De Martino et al. (2010), observed two patients with bilateral amygdala lesions as they made choices in a task nearly identical to that in Tom et al. (2007), and found that neither patient was loss averse (λ's of 0.76 and 1.06; both less than matched controls). In our study, amygdala responses to loss outcomes relative to gain outcomes correlated with loss aversion, implicating the amygdala in its representation. Despite the fact that these findings indicate different regions of the brain in loss aversion (the striatum, Tom et al., 2007; the amygdala, De Martino et al., 2010), we believe our findings and those of the previous two studies can be accounted for in a unified model, proposed below.
The current study, in combination with Sokol-Hessner et al. (2009), links responses (neurally and physiologically) to outcomes with estimates of behavior from decisions. It is possible that responses at outcome may be incidentally linked to decisions, without influencing them. Alternatively, and we think more likely, our findings are consistent with a model in which anticipated responses to outcomes might guide behavior at decision. This latter model, in line with extant theories (LeDoux and Gorman, 2001; Delgado et al., 2008c; Seymour and Dolan, 2008; Talmi et al., 2008; De Martino et al., 2010), suggests that amygdala responses to outcomes may signal emotional salience. These signals modulate activity in regions including the striatum and VMPFC, which have well documented connections with the amygdala (Amaral et al., 1992). This modulation would lead activity in those regions at decision to reflect loss aversion.
Though further testing of this model will clearly be necessary, it can account for the conclusions of previous studies. As Tom et al. (2007) had decisions without outcomes, BOLD activity could have reflected stored values or weights, perhaps from previous experience. De Martino et al. (2010) might then have observed no loss aversion in patients in the same task because of a complete absence of an amygdala signal, during or prior to the study. By imaging decisions and outcomes in the present study, we could confirm Tom et al. (2007), and observe the hypothesized amygdala signal from De Martino et al. (2010) both in baseline behavior and as it changed during reappraisal.
It is additionally notable that the proposed model is similar to modulatory models of the role of emotion and the amygdala in capturing attention (Taylor and Fragopanagos, 2005; Pourtois and Vuilleumier, 2006; Stanley et al., 2009), altering memory (Phelps et al., 1998; McGaugh, 2004; Kensinger and Schacter, 2008), and learning contingencies (Phelps et al., 2004; Schiller et al., 2008). The present study suggests a similar modulatory role in decision making.
Further supporting this hypothesis that affective salience plays a role in loss aversion, the pattern of amygdala responses to outcomes exhibits striking similarities to the pattern previously found for arousal responses (Sokol-Hessner et al., 2009). In that study, skin conductance responses to losses (relative to gains) correlated with loss aversion. Individuals who reduced their loss aversion reduced their arousal responses to losses relative to gains, driven by a reduction in the response to losses. The present study showed a similar correlation between loss aversion and the response to losses vs gains in the amygdala, and linked the reduction in loss aversion with reduction in amygdala activity to losses. Though neural data are not evidence of emotion (Phelps, 2009), it is compelling that amygdala activity exhibits the same pattern observed in research with emotional responses (Sokol-Hessner et al., 2009), consistent with amygdala mediation of physiological arousal responses (Garavan et al., 2001; Glascher and Adolphs, 2003). These parallels suggest that relative emotional responses to outcomes may support loss aversion and its regulation.
In addition to the effects discussed above of reappraisal on participants’ responses to events, like winning or losing money, our blocked design also allowed us to observe consequences of reappraisal on longer timescales. The shifts we found in baseline BOLD activity using trial-triggered averaging suggest that taking a different perspective may also involve maintaining a tonic mindset over the course of a block. Such shifts indicate that perspective taking might be similar to regulatory fit (Higgins, 2005; Avnet and Higgins, 2006) or manipulations of mood (Lerner et al., 2004; Harlé and Sanfey, 2007; Andrade and Ariely, 2009).
That the DLPFC showed a baseline shift is consistent with a putative role in strategic representation and control (Miller and Cohen, 2001; Badre and D'Esposito, 2007), the (non-intentional) regulation of value and decision making (Knoch et al., 2006a, 2006b; Hare et al., 2009; Bhatt et al., 2010; Figner et al., 2010), and the neural mechanisms supporting emotion regulation (Ochsner and Gross, 2008; Hartley and Phelps, 2010). This suggests that similar neural mechanisms may support regulation in financial situations. Of course, DLPFC localization varies (Ochsner and Gross, 2008; Hartley and Phelps, 2010), and there is currently no consensus on its functional organization (Miller and Cohen, 2001; Badre and D'Esposito, 2007; for more discussion, see Supplementary Data).
Baseline shifts were also found in other brain regions. These include the VMPFC, associated with expected utility (Hampton et al., 2006; Tom et al., 2007; Weber et al., 2007; Hare et al., 2008, 2009), extinction of conditioned stimuli (Phelps et al., 2004; Kalisch et al., 2006; Schiller et al., 2008) and emotion regulation (Ochsner et al., 2004; Delgado et al., 2008b), as well as the striatum, strongly linked with value representation (Hsu et al., 2005; Hampton et al., 2006; Kable and Glimcher, 2007; Tom et al., 2007; Delgado et al., 2008c; Hare et al., 2008). Our findings would, therefore, argue that the conceptualization of these regions’ function should include a degree of mutability in response to intentional control.
The present study provides BOLD evidence for the similarities between perspective taking and emotion regulation, and the overlap between emotion and value. We connect loss aversion with amygdala activity, and show that as in emotion regulation, taking a perspective that reduces loss aversion also reduces amygdala responses, and increases prefrontal activity. In combination with previous work, these findings suggest emotional responses are part of value computation, and that those responses, and therefore value itself, can be intentionally controlled. Decision making and valuation are neither as dispassionate as some may have hoped, nor as far outside our conscious control as others may have feared. Instead, the act of choice, much like attention, perception and learning, is multiply determined and perhaps most importantly, within our control.
SUPPLEMENTARY DATA
Supplementary data are available at SCAN online.
Conflict of Interest
None declared.
Supplementary Material
Acknowledgments
The authors thank M. Delgado for helpful comments. This work was supported by the James S. McDonnell Foundation to EAP; the National Institutes of Health (MH080756 and AG039283) to EAP; and the Gordon and Betty Moore Foundation and Human Frontiers Science Program to CFC.
REFERENCES
- Amaral DB, Price JL, Pitkanen A, Carmichael ST. Anatomical organization of the primate amygdaloid complex. In: Aggleton JP, editor. The Amygdala: Neurobiological Aspects of Emotion, Memory, and Mental Dysfunction. New York: Wiley-Liss; 1992. pp. 1–66. [Google Scholar]
- Andrade EB, Ariely D. The enduring impact of transient emotions on decision making. Organizational Behavior And Human Decision Processes. 2009;109(1):1–8. [Google Scholar]
- Avnet T, Higgins ET. How regulatory fit affects value in consumer choices and opinions. Journal of Marketing Research. 2006;43(1):1–10. [Google Scholar]
- Badre D, D'Esposito M. Functional magnetic resonance imaging evidence for a hierarchical organization of the prefrontal cortex. Journal of Cognitive Neuroscience. 2007;19(12):2082–99. doi: 10.1162/jocn.2007.19.12.2082. [DOI] [PubMed] [Google Scholar]
- Banks SJ, Eddy KT, Angstadt M, Nathan PJ, Phan KL. Amygdala-frontal connectivity during emotion regulation. Social Cognitive and Affective Neuroscience. 2007;2(4):303–12. doi: 10.1093/scan/nsm029. [DOI] [PMC free article] [PubMed] [Google Scholar]
- Bechara A, Damasio H, Tranel D, Damasio AR. Deciding advantageously before knowing the advantageous strategy. Science. 1997;275(5304):1293–5. doi: 10.1126/science.275.5304.1293. [DOI] [PubMed] [Google Scholar]
- Bhatt M, Lohrenz T, Camerer CF, Montague PR. Neural signatures of strategic type in a two-person bargaining game. PNAS. 2010;107(46):19720–5. doi: 10.1073/pnas.1009625107. [DOI] [PMC free article] [PubMed] [Google Scholar]
- Buckner R, Bandettini P, O'Craven K, et al. Detection of cortical activation during averaged single trials of a cognitive task using functional magnetic resonance imaging. PNAS. 1996;93:14878–83. doi: 10.1073/pnas.93.25.14878. [DOI] [PMC free article] [PubMed] [Google Scholar]
- Camerer C, Babcock L, Loewenstein G, Thaler RH. Labor supply of new york city cabdrivers: one day at a time. Quarterly Journal of Economics. 1997;112(2):407–441. [Google Scholar]
- Clark L, Bechara A, Damasio H, Aitken MRF, Sahakian BJ, Robbins TW. Differential effects of insular and ventromedial prefrontal cortex lesions on risky decision-making. Brain. 2008;131(5):1311–22. doi: 10.1093/brain/awn066. [DOI] [PMC free article] [PubMed] [Google Scholar]
- Critchley HD, Wiens S, Rotshtein P, Ohman A, Dolan RJ. Neural systems supporting interoceptive awareness. Nature Neuroscience. 2004;7(2):189–95. doi: 10.1038/nn1176. [DOI] [PubMed] [Google Scholar]
- De Martino B, Camerer CF, Adolphs R. Amygdala damage eliminates monetary loss aversion. PNAS. 2010;107:3788–92. doi: 10.1073/pnas.0910230107. [DOI] [PMC free article] [PubMed] [Google Scholar]
- Delgado MR, Gillis M, Phelps EA. Regulating the expectation of reward via cognitive strategies. Nature Neuroscience. 2008a;11(8):880–1. doi: 10.1038/nn.2141. [DOI] [PMC free article] [PubMed] [Google Scholar]
- Delgado MR, Nearing KI, Ledoux JE, Phelps EA. Neural circuitry underlying the regulation of conditioned fear and its relation to extinction. Neuron. 2008b;59:829–38. doi: 10.1016/j.neuron.2008.06.029. [DOI] [PMC free article] [PubMed] [Google Scholar]
- Delgado MR, Schotter A, Ozbay E, Phelps EA. Understanding overbidding: using the neural circuitry of reward to design economic auctions. Science. 2008c;321(5897):1849–52. doi: 10.1126/science.1158860. [DOI] [PMC free article] [PubMed] [Google Scholar]
- Donaldson D, Petersen S, Ollinger J, Buckner R. Dissociating state and item components of recognition memory using fmri. Neuroimage. 2001;13(1):129–42. doi: 10.1006/nimg.2000.0664. [DOI] [PubMed] [Google Scholar]
- Eippert F, Veit R, Weiskopf N, Erb M, Birbaumer N, Anders S. Regulation of emotional responses elicited by threat-related stimuli. Human Brain Mapping. 2007;28(5):409–23. doi: 10.1002/hbm.20291. [DOI] [PMC free article] [PubMed] [Google Scholar]
- Figner B, Knoch D, Johnson EJ, et al. Lateral prefrontal cortex and self-control in intertemporal choice. Nature Neuroscience. 2010;13(5):538–9. doi: 10.1038/nn.2516. [DOI] [PubMed] [Google Scholar]
- Frank MJ, Cohen MX, Sanfey AG. Multiple systems in decision making: a neurocomputational perspective. Current Directions in Psychological Science. 2009;18(2):73–7. [Google Scholar]
- Garavan H, Pendergrass JC, Ross TJ, Stein EA, Risinger RC. Amygdala response to both positively and negatively valenced stimuli. Neuroreport. 2001;12(12):2779–83. doi: 10.1097/00001756-200108280-00036. [DOI] [PubMed] [Google Scholar]
- Genesove D, Mayer C. Loss aversion and seller behavior: evidence from the housing market. Quarterly Journal of Economics. 2001;116(4):1233–60. [Google Scholar]
- Glascher J, Adolphs R. Processing of the arousal of subliminal and supraliminal emotional stimuli by the human amygdala. The Journal Of Neuroscience. 2003;23(32):10274–82. doi: 10.1523/JNEUROSCI.23-32-10274.2003. [DOI] [PMC free article] [PubMed] [Google Scholar]
- Gottfried JA, O'Doherty J, Dolan RJ. Encoding predictive reward value in human amygdala and orbitofrontal cortex. Science. 2003;301(5636):1104–7. doi: 10.1126/science.1087919. [DOI] [PubMed] [Google Scholar]
- Gross JJ. Antecedent- and response-focused emotion regulation: divergent consequences for experience, expression, and physiology. Journal of Personality and Social Psychology. 1998;74:224–37. doi: 10.1037//0022-3514.74.1.224. [DOI] [PubMed] [Google Scholar]
- Haigh MS, List JA. Do professional traders exhibit myopic loss aversion? An experimental analysis. Journal of Finance. 2005;60(1):523–34. [Google Scholar]
- Hampton AN, Bossaerts P, O'Doherty JP. The role of the ventromedial prefrontal cortex in abstract state-based inference during decision making in humans. Journal of Neuroscience. 2006;26(32):8360–7. doi: 10.1523/JNEUROSCI.1010-06.2006. [DOI] [PMC free article] [PubMed] [Google Scholar]
- Hare TA, Camerer CF, Rangel A. Self-control in decision-making involves modulation of the vmpfc valuation system. Science. 2009;324(5927):646–8. doi: 10.1126/science.1168450. [DOI] [PubMed] [Google Scholar]
- Hare TA, O'Doherty JP, Camerer CF, Schultz W, Rangel A. Dissociating the role of the orbitofrontal cortex and the striatum in the computation of goal values and prediction errors. Journal of Neuroscience. 2008;28(22):5623–30. doi: 10.1523/JNEUROSCI.1309-08.2008. [DOI] [PMC free article] [PubMed] [Google Scholar]
- Harlé K, Sanfey AG. Incidental sadness biases social economic decisions in the ultimatum game. Emotion. 2007;7(4):876–81. doi: 10.1037/1528-3542.7.4.876. [DOI] [PubMed] [Google Scholar]
- Hartley CA, Phelps EA. Changing fear: the neurocircuitry of emotion regulation. Neuropsychopharmacology. 2010;35(1):136–46. doi: 10.1038/npp.2009.121. [DOI] [PMC free article] [PubMed] [Google Scholar]
- Higgins ET. Value from regulatory fit. Current Directions in Psychological Science. 2005;14(4):209–13. [Google Scholar]
- Hsu M, Bhatt M, Adolphs R, Tranel D, Camerer CF. Neural systems responding to degrees of uncertainty in human decision-making. Science. 2005;310(5754):1680–3. doi: 10.1126/science.1115327. [DOI] [PubMed] [Google Scholar]
- Kable JW, Glimcher PW. The neural correlates of subjective value during intertemporal choice. Nature Neuroscience. 2007;10(12):1625–33. doi: 10.1038/nn2007. [DOI] [PMC free article] [PubMed] [Google Scholar]
- Kahneman D, Tversky A. Prospect theory - analysis of decision under risk. Econometrica. 1979;47(2):263–91. [Google Scholar]
- Kalisch R, Korenfeld E, Stephan KE, Weiskopf N, Seymour B, Dolan RJ. Context-dependent human extinction memory is mediated by a ventromedial prefrontal and hippocampal network. The Journal of Neuroscience. 2006;26(37):9503–11. doi: 10.1523/JNEUROSCI.2021-06.2006. [DOI] [PMC free article] [PubMed] [Google Scholar]
- Kensinger EA, Schacter DL. Memory and emotion. In: Lewis M, Haviland-Jones JM, Barrett LF, editors. Handbook of Emotions. Guilford Press; 2008. pp. 601–17. [Google Scholar]
- Knoch D, Gianotti LRR, Pascual-Leone A, et al. Disruption of right prefrontal cortex by low-frequency repetitive transcranial magnetic stimulation induces risk-taking behavior. Journal of Neuroscience. 2006a;26(24):6469–72. doi: 10.1523/JNEUROSCI.0804-06.2006. [DOI] [PMC free article] [PubMed] [Google Scholar]
- Knoch D, Pascual-Leone A, Meyer K, Treyer V, Fehr E. Diminishing reciprocal fairness by disrupting the right prefrontal cortex. Science. 2006b;314:829–32. doi: 10.1126/science.1129156. [DOI] [PubMed] [Google Scholar]
- Ledoux JE. Emotion circuits in the brain. Annual Review of Neuroscience. 2000;23:155–84. doi: 10.1146/annurev.neuro.23.1.155. [DOI] [PubMed] [Google Scholar]
- Ledoux JE, Gorman JM. A call to action: overcoming anxiety through active coping. American Journal of Psychiatry. 2001;158(12):1953–5. doi: 10.1176/appi.ajp.158.12.1953. [DOI] [PubMed] [Google Scholar]
- Lerner JS, Small DA, Loewenstein GF. Heart strings and purse strings: carryover effects of emotions on economic decisions. Psychological Science. 2004;15(5):337–41. doi: 10.1111/j.0956-7976.2004.00679.x. [DOI] [PubMed] [Google Scholar]
- Lo AW, Repin DV. The psychophysiology of real-time financial risk processing. Journal of Cognitive Neuroscience. 2002;14(3):323–39. doi: 10.1162/089892902317361877. [DOI] [PubMed] [Google Scholar]
- Loewenstein G. Out of control: visceral influences on behavior. Organizational Behavior and Human Decision Processes. 1996;65(3):272–92. [Google Scholar]
- Mcgaugh JL. The amygdala modulates the consolidation of memories of emotionally arousing experiences. Annual Review of Neuroscience. 2004;27:1–28. doi: 10.1146/annurev.neuro.27.070203.144157. [DOI] [PubMed] [Google Scholar]
- Miller EK, Cohen JD. An integrative theory of prefrontal cortex function. Annual Review of Neuroscience. 2001;24:167–202. doi: 10.1146/annurev.neuro.24.1.167. [DOI] [PubMed] [Google Scholar]
- Morris JS, Frith CD, Perrett DIJ, et al. A differential neural response in the human amygdala to fearful and happy facial expressions. Nature. 1996;383(6603):812–5. doi: 10.1038/383812a0. [DOI] [PubMed] [Google Scholar]
- Murray EA. The amygdala, reward and emotion. Trends in Cognitive Science. 2007;11(11):489–97. doi: 10.1016/j.tics.2007.08.013. [DOI] [PubMed] [Google Scholar]
- Ochsner KN, Bunge SA, Gross JJ, Gabrieli JDE. Rethinking feelings: an fmri study of the cognitive regulation of emotion. Journal of Cognitive Neuroscience. 2002;14(8):1215–29. doi: 10.1162/089892902760807212. [DOI] [PubMed] [Google Scholar]
- Ochsner KN, Gross JJ. Cognitive emotion regulation: insights from social cognitive and affective neuroscience. Current Directions in Psychological Science. 2008;17(2):153–8. doi: 10.1111/j.1467-8721.2008.00566.x. [DOI] [PMC free article] [PubMed] [Google Scholar]
- Ochsner KN, Ray RD, Cooper JC, et al. For better or for worse: neural systems supporting the cognitive down- and up-regulation of negative emotion. Neuroimage. 2004;23(2):483–99. doi: 10.1016/j.neuroimage.2004.06.030. [DOI] [PubMed] [Google Scholar]
- Ollinger JM, Corbetta M, Shulman GL. Separating processes within a trial in event-related functional MRI - II. Analysis. Neuroimage. 2001a;13(1):218–29. doi: 10.1006/nimg.2000.0711. [DOI] [PubMed] [Google Scholar]
- Ollinger JM, Shulman GL, Corbetta M. Separating processes within a trial in event-related functional MRI - I. The method. Neuroimage. 2001b;13(1):210–7. doi: 10.1006/nimg.2000.0710. [DOI] [PubMed] [Google Scholar]
- Paulus MP, Rogalsky C, Simmons A, Feinstein JS, Stein MB. Increased activation in the right insula during risk-taking decision making is related to harm avoidance and neuroticism. Neuroimage. 2003;19(4):1439–48. doi: 10.1016/s1053-8119(03)00251-9. [DOI] [PubMed] [Google Scholar]
- Phelps EA. The study of emotion in neuroeconomics. In: Glimcher PW, Camerer CF, Fehr E, Poldrack RA, editors. Neuroeconomics: Decision Making And The Brain. London, UK: Academic Press; 2009. pp. 233–50. [Google Scholar]
- Phelps EA, Delgado MR, Nearing KI, Ledoux JE. Extinction learning in humans: role of the amygdala and VMPFC. Neuron. 2004;43:897–905. doi: 10.1016/j.neuron.2004.08.042. [DOI] [PubMed] [Google Scholar]
- Phelps EA, Labar KS, Anderson AK, O'Connor KJ, Fulbright RK, Spencer DD. Specifying the contributions of the human amygdala to emotional memory: a case study. Neurocase. 1998;4(6):527–40. [Google Scholar]
- Pourtois G, Vuilleumier P. Dynamics of emotional effects on spatial attention in the human visual cortex. Progress in Brain Research. 2006;156:67–91. doi: 10.1016/S0079-6123(06)56004-2. [DOI] [PubMed] [Google Scholar]
- Preuschoff K, Bossaerts P, Quartz SR. Neural differentiation of expected reward and risk in human subcortical structures. Neuron. 2006;51(3):381–90. doi: 10.1016/j.neuron.2006.06.024. [DOI] [PubMed] [Google Scholar]
- Schachter S, Singer JE. Cognitive, social and phsyiological determinants of emotional state. Psychological Review. 1962;69(5):379–99. doi: 10.1037/h0046234. [DOI] [PubMed] [Google Scholar]
- Scherer KR. What are emotions? And how can they be measured? Social Science Information. 2005;44(4):695–729. [Google Scholar]
- Schiller D, Levy I, Niv Y, Ledoux JE, Phelps EA. From fear to safety and back: reversal of fear in the human brain. Journal of Neuroscience. 2008;28(45):11517–25. doi: 10.1523/JNEUROSCI.2265-08.2008. [DOI] [PMC free article] [PubMed] [Google Scholar]
- Seymour B, Dolan RJ. Emotion, decision making, and the amygdala. Neuron. 2008;58(5):662–71. doi: 10.1016/j.neuron.2008.05.020. [DOI] [PubMed] [Google Scholar]
- Shiv B, Loewenstein GF, Bechara A, Damasio H, Damasio AR. Investment behavior and the negative side of emotion. Psychological Science. 2005;16(6):435–9. doi: 10.1111/j.0956-7976.2005.01553.x. [DOI] [PubMed] [Google Scholar]
- Sokol-Hessner P, Hsu M, Curley NG, Delgado MR, Camerer CF, Phelps EA. Thinking like a trader selectively reduces individuals' loss aversion. PNAS. 2009;106(13):5035–40. doi: 10.1073/pnas.0806761106. [DOI] [PMC free article] [PubMed] [Google Scholar]
- Stanley D, Ferneyhough E, Phelps EA. Neural perspectives on emotion: impact on perception, attention, and memory. In: Berntson GG, Cacioppo JT, editors. Handbook of Neuroscience for the Behavioral Sciences. Hoboken, New Jersey: John Wiley & Sons; 2009. p. 2. [Google Scholar]
- Talairach J, Tournoux P. Co-Planar Stereotaxis Atlas of the Human Brain: An Approach to Medical Cerebral Imaging. Stuttgart, New York: Thieme Medical Publishers; 1988. [Google Scholar]
- Talmi D, Seymour B, Dayan P, Dolan RJ. Human pavlovian instrumental transfer. Journal of Neuroscience. 2008;28(2):360–8. doi: 10.1523/JNEUROSCI.4028-07.2008. [DOI] [PMC free article] [PubMed] [Google Scholar]
- Taylor JG, Fragopanagos NF. The interaction of attention and emotion. Neural Networks. 2005;18:353–69. doi: 10.1016/j.neunet.2005.03.005. [DOI] [PubMed] [Google Scholar]
- Tom SM, Fox CR, Trepel C, Poldrack RA. The neural basis of loss aversion in decision-making under risk. Science. 2007;315:515–8. doi: 10.1126/science.1134239. [DOI] [PubMed] [Google Scholar]
- Tversky A, Kahneman D. Loss aversion in riskless choice: a reference-dependent model. Quarterly Journal of Economics. 1991;106(4):1039–61. [Google Scholar]
- Urry HL, Van Reekum CM, Johnstone T, Davidson RJ. Individual differences in some (but not all) medial prefrontal regions reflect cognitive demand while regulating unpleasant emotion. Neuroimage. 2009;47(3):852–63. doi: 10.1016/j.neuroimage.2009.05.069. [DOI] [PMC free article] [PubMed] [Google Scholar]
- Van 'T Wout M, Kahn R, Sanfey AG, Aleman A. Affective state and decision-making in the ultimatum game. Experimental Brain Research. 2006;169(4):564–8. doi: 10.1007/s00221-006-0346-5. [DOI] [PubMed] [Google Scholar]
- Visscher K, Miezin F, Kelly J, et al. Mixed blocked/event-related designs separate transient and sustained activity in fMRI. Neuroimage. 2003;19:1694–708. doi: 10.1016/s1053-8119(03)00178-2. [DOI] [PubMed] [Google Scholar]
- Wager TD, Davidson ML, Hughes BL, Lindquist MA, Ochsner KN. prefrontal-subcortical pathways mediating successful emotion regulation. Neuron. 2008;59:1037–50. doi: 10.1016/j.neuron.2008.09.006. [DOI] [PMC free article] [PubMed] [Google Scholar]
- Wang JT, Spezio M, Camerer CF. Pinocchio's pupil: using eyetracking and pupil dilation to understand truth telling and deception in sender-receiver games. American Economic Review. 2010;100(3):984–1007. [Google Scholar]
- Weber B, Aholt A, Neuhaus C, Trautner P, Elger CE, Teichert T. Neural evidence for reference-dependence in real-market-transactions. Neuroimage. 2007;35:441–7. doi: 10.1016/j.neuroimage.2006.11.034. [DOI] [PubMed] [Google Scholar]
- Whalen PJ, Rauch SL, Etcoff NL, Mcinerney SC, Lee MB, Jenike MA. Masked presentations of emotional facial expressions modulate amygdala activity without explicit knowledge. Journal of Neuroscience. 1998;18(1):411–8. doi: 10.1523/JNEUROSCI.18-01-00411.1998. [DOI] [PMC free article] [PubMed] [Google Scholar]
- Williams L, Phillips M, Brammer M, et al. Arousal dissociates amygdala and hippocampal fear responses: evidence from simultaneous fMRI and skin conductance recording. Neuroimage. 2001;14(5):1070–9. doi: 10.1006/nimg.2001.0904. [DOI] [PubMed] [Google Scholar]
- Winkielman P, Berridge KC, Wilbarger JL. Unconscious affective reactions to masked happy versus angry faces influence consumption behavior and judgments of value. Personality and Social Psychology Bulletin. 2005;31(1):121–35. doi: 10.1177/0146167204271309. [DOI] [PubMed] [Google Scholar]
Associated Data
This section collects any data citations, data availability statements, or supplementary materials included in this article.