

Abstract
Purpose
To evaluate by sequential 18F-FDG PET/CT imaging the therapeutic response to a novel monoclonal antibody targeting human EMMPRIN (extracellular matrix metalloproteinase inducer) in combination with gemcitabine in a pancreatic-tumor xenograft murine model.
Procedures
Four groups of SCID mice bearing orthotopic pancreatic tumor xenografts were injected with PBS, gemcitabine (120mg/kg BW), anti-EMMPRIN antibody (0.2mg), or combination, respectively twice weekly for 2 weeks, while 18F-FDG PET/CT imaging was performed weekly for 3 weeks. Changes in mean standardized uptake value (SUVmean) of 18F-FDG and volume of tumors were determined.
Results
The tumor SUVmean change in the group receiving combination therapy was significantly lower than those of the other groups. Tumor-volume changes of groups treated with anti-EMMPRIN monotherapy or combined therapy were significantly lower than that of the control group.
Conclusions
These data provide support for clinical studies of anti-EMMPRIN therapy with gemcitabine for pancreatic cancer treatment.
Keywords: FDG-PET, CT, EMMPRIN, Gemcitabine, Pancreatic cancer
Introduction
Pancreatic cancer is a highly malignant disease and the fourth leading cause of cancer death in the United States [1]. Pancreatic cancer patients present minor symptoms for a medical evaluation [2], and the silent nature of this disease until late in the disease process contributes to the poor survival outcome. For over a decade, gemcitabine has been the first-line treatment in patients with advanced and metastatic pancreatic cancer [3]. While combination therapy with radiation and gemcitabine demonstrated a modestly improved survival benefit for patients with localized unresectable pancreatic cancer over gemcitabine alone [4], no improvement has been presented for additional chemotherapeutic agents such as cisplatin, irinotecan, 5-fluorouracil (5-FU), capecitabine, cisplatin, irinotecan, oxaliplatin, pemetrexed, or exatecan [5-10]. Among the newer approaches, human epidermal growth factor (EGFR) and vascular endothelial growth factor (VEGF) were investigated as biologic therapy for pancreatic cancer. Data from a phase III clinical trial showed statistically significant survival improvement with erlotinib (a small molecule targeting EGFR) and gemcitabine versus gemcitabine alone [11], but the clinical usefulness of this combination remains unclear due to the limited improvement in survival. Monoclonal antibodies targeting EGFR (cetuximab) or VEGF (bevacizumab) alone or in combination with gemcitabine have proven ineffective [12, 13].
A novel therapeutic approach for pancreatic cancer is to target the extracellular matrix metalloproteinase inducer, EMMPRIN, also known as CD147. EMMPRIN is a membrane-bound surface glycoprotein playing a key role in tumor progression [14]. EMMPRIN is implicated in the upregulation of matrix metalloproteinases (MMPs) from surrounding fibroblasts and tumor cells [14, 15]. MMPs have been shown to be associated with the development of the desmoplastic reaction and promotion of tumor cell invasion [16]. Further, EMMPRIN might stimulate tumor angiogenesis by increasing the expression of VEGF and MMP in the neighboring fibroblasts and epithelial cells in a paracrine manner [17]. EMMPRIN stimulates tumor neovascularization through stimulating VEGF isoforms and their receptor VEGFR-2 by stimulating hypoxia-inducible factor (HIF) [18, 19]. Pancreatic cancer expresses one of the highest levels of EMMPRIN in any tumor type, and EMMPRIN is present in 87% of pancreatic adenocarcinomas which is second only to head and neck squamous cell carcinoma [20]. The high level of surface expression in pancreatic cancer cells suggests that EMMPRIN is a good candidate for targeted therapy.
Tumor responsiveness to anti-EMMPRIN antibody can potentially be determined by non-invasive imaging, allowing individualized (ie patient-specific) therapy and thus more favorable therapeutic outcomes. Positron emission tomography (PET) using 18F-labeled fludeoxyglucose (FDG) has been gaining importance in assessing tumor response to anti-cancer drugs with reasonable accuracy [21-23]; 18F-FDG, the most commonly used PET imaging agent, accumulates in cells in relation to the rate of glucose metabolism, which is typically greater in tumor cells than in normal cells. 18F-FDG uptake can be semi-quantified by standardized uptake value (SUV) with reasonable reproducibility, enabling serial 18F-FDG-PET imaging study for evaluation of therapy [21]. 18F-FDG-PET imaging for prognosis of primary pancreatic cancer following radiotherapy or chemotherapy has been validated [24-29].
The goal of the current study was to determine the early therapeutic efficacy of the novel anti-EMMPRIN antibody alone or in combination with gemcitabine using 18F-FDG PET and contrast-enhanced computed tomography (CT) in an orthotopic murine pancreatic cancer model.
Materials and Methods
Reagents and Cell lines
All reagents were from Fisher (Pittsburg, PA) unless otherwise specified. Purified monomeric monoclonal anti-EMMPRIN antibody (mouse origin IgG1 K) was provided by Dr. Tong Zhou (UAB, Birmingham, AL). Purified mouse IgG1 isotype control antibody was bought from Southern Biotech (Birmingham, AL). Fresh Tc-99m pertechnetate was purchased from Birmingham Nuclear Pharmacy (Birmingham, AL). 18F-labeled FDG was purchased from Cardinal Health (Birmingham, AL). The human pancreatic cancer cell line, MIA PaCa-2, was a gift from Dr. M. Hollingsworth (University of Nebraska, Omaha, NE). MIA PaCa-2 cells highly express EMMPRIN [30]. MIA PaCa-2 cells were cultured in DMEM (Mediatech Inc, Herndon, VA) supplemented with 10% fetal bovine serum (Hyclone, Logan, UT). Omnipaque™ (iohexol, 350 mg/ml, GE Healthcare Inc., Princeton, NJ) was purchased from the University of Alabama at Birmingham Hospital Pharmacy.
Cell Viability Assay
In vitro cell viability assays was conducted with anti-EMMPRIN antibody alone or in combination with gemcitabine; a total of 1000 cells was added to each well of 60-well plates (5 rows × 12 columns). The EMMPRIN agonist antibodies were diluted to five different concentrations (0, 10, 100, 1000, 3000 ng/ml) and were added to 12 wells per gemcitabine concentration (same concentration at each row). Thereafter, gemcitabine was added to the 6 columns of cells in the well plate to yield a concentration of 30 nM in each well. After 24 hours of incubation at 37 °C in 5% CO2, the ATP level was determined using the ATP lite assay (Perkin-Elmer, Boston, MA). The light emission from the wells of the plates was measured using an IVIS-100 imaging system (Caliper Life Sciences, Hopkinton, MA) and quantified using the vendor software. The luminescent exposure time was 60 seconds, whereas binning was 8. The field of view was 15 cm and the f stop 1. Regions of interest (ROIs) were drawn manually around the area of each individual well in the well plate, and the intensity of light emitted from each ROI was measured. Data were normalized to light emission of an equal number of untreated cells otherwise incubated under the same conditions as the treated cells.
HYNIC conjugation and radiolabeling
HYNIC conjugation and radiolabeling were conducted for in vivo SPECT imaging and the biodistribution study. A fresh 1.8 mM solution of succinimidyl 6-hydrazinonicoinate (HYNIC; courtesy of Dr. Gary Bridger, AnorMED Inc., Langley, British Columbia) in dimethylformamide was prepared. Forty picomoles was transferred to glass vials, followed by freezing at -90°C, then the solutions were vacuum-dried using Advantage Benchtop Freeze Dryer (Virtis Co. Inc., Gardiner, NY) with the shelf temperature at -75°C and trap at -90°C. The vials were sealed under vacuum, and kept frozen at -80°C until use. Each vial was reconstituted with 1.0 mL of sodium phosphate buffer [0.15 mol/L (pH 7.80)] containing 1 mg of antibody (HYNIC/antibody molar ratio = 6). After a 3-hour incubation at room temperature, the mixture was transferred to Slide-A-Lyzer dialysis cassette having molecular weight cutoff of 10,000 (Pierece, Rockford, IL) and then immersed into 1,000 mL of PBS (pH 7.4) overnight at 4°C. The radiochemical yield was about 60%. The HYNIC-modified antibody was labeled with Tc-99m using SnCl2/tricine as the transfer ligand [31], and the unbound Tc-99m was removed by G-25 Sephadex size exclusion chromatography. The protein concentrations of the collected fractions were measured by Lowry assay [32]. The Tc-99m-labeled anti-EMMPRIN antibody was greater than 95%, as measured by TLC using separate strips developed with saline and methyl ethyl ketone.
Animal Modeling
Animal experiments were reviewed and approved by the Institutional Animal Care and Use Committee. Six groups of female SCID BALB/c mice (NCI-Frederick Animal Production Program, Fredrick, MD, 4∼6 weeks old, n=5 for groups 1 and 2, n=6 for groups 3-6) were used. The procedure for intrapancreatic tumor implantation was the following: a 1-cm incision was made in the left upper quadrant of the abdomen of anesthetized mice, and a suspension of 2.5 × 10⁶ MIA PaCa-2 cells in 40 μL of DMEM was injected into the tail of the pancreas. The skin and peritoneum were closed in 1 layer with 3 interrupted 5-0 Prolene sutures. Dosing of drugs or radiolabeled antibodies and imaging were initiated at 21 days after cell implantation for all groups. To assess specific tumor uptake of anti-EMMPRIN antibody, groups 1 and 2 were injected with Tc-99m labeled isotype control antibody (1.33±0.04 (mean±SE) MBq, 8.83±0.53 μg) and anti-EMMPRIN antibody (3.15±0.18 MBq, 8.31±1.07 μg), respectively at 21 days after the implantation of the tumor cells; SPECT/CT imaging was performed at 4 hours after dosing, while the biodistribution study followed at 24 hours after dosing. Groups 3-6 were intraperitoneally injected with phosphate-buffered saline (PBS; serving as control), gemcitabine (120 mg/kg BW), anti-EMMPRIN antibody (0.2 mg), or a combination of gemcitabine and antibody, respectively. Anti-EMMPRIN antibody was administered on days 21, 23, 28, and 31, while gemcitabine was administered on days 21 and 28. One animal of group 3 was euthanized at day 28 after cell implantation due to excess tumor burden. PET/CT imaging was performed on days 21, 28, and 35 for groups 3-6. At day 35, all tumors of groups 3-6 were collected, and TUNEL and Ki67 staining were performed. All animals were anesthetized using isofluorane gas (1∼2%) during imaging.
SPECT/CT imaging
SPECT/CT imaging was performed using the X-SPECT, a SPECT/CT dual-modality imaging instrument (Gamma Medica, Inc., Northridge, CA), to monitor the distribution of Tc-99m labeled anti-EMMPRIN antibodies in vivo. For SPECT imaging, a total of 64 projections (matrix: 56 × 56 per projection) were acquired with a 50-90 second acquisition time per projection, using a pinhole collimator with a 1-mm tungsten pinhole insert (focal length: 91.3 mm). The field of view was 47.9 mm, while the radius of rotation was 35 mm (magnification: 2.6). Images were reconstructed using an ordered subsets expectation maximization algorithm (8 subsets and 20 iterations). The 4th-order Butterworth digital filter (fc=0.25, fm=0.15) provided with the vendor software were applied for all SPECT images to enhance the image quality. The isotropic spatial resolution (full-width half-maximum) of the reconstructed SPECT images was 1.3 mm. For the CT system, the X-ray tube was operated at a voltage of 50 kVp and an anode current of 0.6 mA. 256 projections were acquired to obtain the CT images, and acquisition time per projection was 0.5 second. The co-registration of SPECT and CT images was performed using vendor-supplied computer software. A 60-W heat lamp warmed the animal bodies while they were under anesthesia. The same color scale was applied to all SPECT images after correction for radioactive decay and the injected activity.
Biodistribution study
Tumor, liver, and blood were collected from each animal of groups 1 and 2 at 24 hours after radioactivity injection. Those samples were weighed and the Tc-99m activity was measured using a calibrated gamma-ray counter (MINAXIγ Auto-gamma® 5000 series Gamma Counter manufactured by Packard Instrument Company, Downers Grove, IL), and corrected for radioactive decay to the time of injection. The administered activity for each mouse was determined by measurements of the dosing syringe before and after injection with an Atomlab 100 dose calibrator (Biodex Medical Systems, Shirley, NY). Tissue activity concentrations (in percent of the injected dose per gram, %ID/g) and tumor-to-blood activity concentration ratios were derived.
PET/CT imaging
PET/CT imaging study was conducted using Triumph, a PET/CT dual-modality imaging system (GE, Northridge, CA), to monitor tumor response following anti-EMMPRIN therapy with/without gemcitabine. For PET, this system provided a 2.2-mm axial spatial resolution and 5.9% sensitivity at the center of field of view, while the axial field of view was 37.5 mm [33]. Animals were fasted overnight (17-21 hours) prior to FDG injection. Three animals were imaged per hour and 12 animals per day, with imaging performed on two consecutive days in a given week. Animals were imaged in a consistent order in each day to minimize the variation of the time of fasting, and the averaged standard error of the time of fasting was 13±2 (mean±SE) minutes. 18F-FDG (3.5-4.4 MBq in 200μl PBS) was administered intravenously, and a 7-minute scan was performed at 100 minutes after injection. Animals were under isoflurane anesthesia during dosing (∼5 minutes) and imaging (∼10 minutes); the animal cages were heated with a heating pad (T/Pump, Gaymar Industries, Inc., Orchard Park, NY) set to 42°C and started at 1 hour before 18F-FDG injection and continued until the imaging of all animals was completed. The temperature of the animal bed in the Triumph scanner was maintained to 37°C during imaging. PET images were reconstructed with maximum likelihood expectation maximization algorithm (5 iterations) in high-resolution mode. For contrast-enhanced CT imaging, 0.2 ml of iohexol was intraperitoneally injected right before PET imaging. The voltage of X-ray tube was 75 kVp and the anode current was 0.11 mA. The axial field of view was set to 78.9 mm, while 256 projections were acquired in fly gantry-motion mode. The CT acquisition time was 1.07 minutes per each animal. The co-registration of PET and CT images was performed using ImageJ version 1.40g (National Institutes of Health, Bethesda, MD). The tumor area was manually segmented from the co-registered contrast-enhanced CT images based on the signal-intensity difference between the region of interest (ROI) and background. In PET images, the standardized uptake value (SUV) was calculated by SUV = (C ×W)/D, where C is tissue activity concentration (MBq/ml), W is animal body weight (g), and D is the administered dose (MBq). On day 21, the averaged tumor SUVmean of groups 3-6 was 2.0±0.2 (mean±SE) g/ml, and the averaged tumor volume was 238±38 (mean±SE) mm3.
Histologic analysis
TUNEL and Ki67 staining of each tumor tissue in groups 3-6 were performed with the same procedure as reported previously [34]. Two digital microphotographs were taken for each tumor slice that had undergone TUNEL or Ki67 (X200) staining, using a SPOT camera on an Olympus 1×70 microscope (Olympus Optical Co., Tokyo, Japan) interfaced with personal computer and SPOT software. The apoptotic (TUNEL) or proliferating (Ki67 expressing) cells were segmented by the signal-intensity difference between the target cells and background in each photograph, while the intensity threshold and minimum particle size were determined manually. Then, the target cells were counted, and the cell density (cell number/mm2) was calculated. The cell densities of the two photographs for each tumor slide were averaged. The image analysis was performed using ImageJ, version 1.40g (National Institute of Heath, Bethesda, MD).
Statistical analysis
One-way ANOVA [35] was carried out using SAS, version 9.2 (SAS Institute Inc., Cary, NC) to compare %ID/g of tumor, blood, and liver together with tumor-to-blood ratio between groups 1 and 2. ANOVA was also used to compare the densities of TUNEL- and of Ki67-staining cells in tumors among groups 3-6, while Bonferroni correction was applied to adjust p values for multiple comparisons [35]. SPSS version 16.0 (SPSS Inc., Chicago, IL) was employed to compare tumor SUVmean and volume changes over 2 weeks of groups 3-6 using two-way repeated measures analysis of variance (RM ANOVA) [36], while the Pearson correlation coefficient was used to analyze the relationships between two variables [37]. p values less than 0.05 were considered significant. Data are presented as means ± SE (standard error).
Results
The in vitro ATP lite assay demonstrated cytotoxicity of anti-EMMPRIN therapy in combination with gemcitabine. Figure 1 shows the in vitro viability of MIA PaCa-2 cells following overnight treatment of anti-EMMPRIN antibody in escalating concentration with/without gemcitabine (30 nM). Anti-EMMPRIN monotherapy presented about 40% killing efficacy at 3000 ng/ml, while gemcitabine induced additive efficacy of 10-20%.
Figure 1.

in vitro ATP lite assay (mean and SE) to measure killing of MIA PaCa-2 pancreatic-cancer cells at increasing concentrations of anti-EMMPRIN antibody alone or in combination with gemcitabine (30 nM).
SPECT imaging and biodistribution analysis confirmed the specific retention of Tc-99m labeled anti-EMMPRIN antibody in the orthotopic pancreatic-tumor xenografts. Figure 2 shows representative in vivo SPECT/CT fused images (coronal view) of two mice bearing orthotopic pancreatic tumor xenografts at 4 hours after injection of (a) Tc-99m-anti-EMMPRIN antibody or (b) Tc-99m-isotype control antibody, respectively with the same color scaling after injected dose and decay corrections, and (c) %ID/g of tumor, liver, and blood of groups 1 and 2. The tumor locations are indicated with white arrows in Figs. 2a and 2b. From the biodistribution study, the %ID/g in tumor, liver, and blood of group 2 were 26.9±3.4, 9.0±1.4, and 5.8±8.1 respectively, while those of group 1 were 6.2±0.4, 7.7±0.7, and 6.1±0.3 respectively. The tumor retention of group 2 was significantly higher than that of group 1 (p<0.001), while no difference was detected for the levels in liver and blood (p>0.05). The tumor-to-blood ratio of group 2 was 2.60±0.62, which was also significantly higher than that of group 1 (0.52±0.10; p=0.01).
Figure 2.
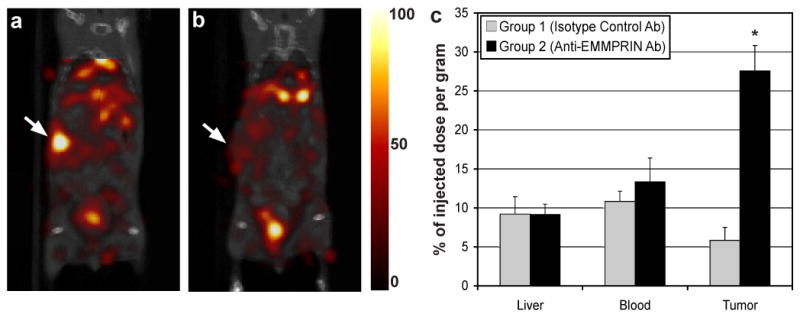
(a,b) In vivo SPECT/CT images (coronal view) at 4 hours after intravenously injecting (a) Tc-99m labeled anti-EMMPRIN antibody or (b) Tc-99m labeled isotype control antibody, while tumor locations are indicated with a white arrow in each subfigure (the same color scale was applied for both the SPECT images after injected dose and radiation-decay correction). (c) The % of injected dose per gram (%ID/g) of liver, blood, and tumor of groups 1 and 2 injected with Tc-99m labeled isotype control antibody or anti-EMMPRIN antibody respectively (asterisks represent statistical difference between the two groups (p<0.05)).
18F-FDG PET and CT imaging corroborated the substantial therapeutic efficacy of anti-EMMPRIN antibody and synergetic efficacy when combined with gemcitabine. Figure 3a shows representative contrast-enhanced CT (CE-CT), 18F-FDG PET, and PET/CT fused images of a mouse bearing an orthotopic pancreatic tumor xenograft. White arrows indicate tumor locations in each subfigure. Figures 3b and 3c show the tumor SUVmean and volume changes, respectively, for 2 weeks after therapy initiation of groups 3-6, normalized to the values on day 21, while groups labeled with different Greek letters are statistically different (p<0.05); that is, group labeled with “α” is statistically different from that with “β”, but not different from that with “α, β”. The tumor SUVmean of group 6 decreased 25±8% for 2 weeks, whereas those of groups 3-5 increased 134±61%, 60±32%, and 43±30%, respectively during the same time; that of group 6 was significantly lower than those of groups 3-5 (p<0.05), but no difference was detected among groups 3-5 (p>0.05). In Fig. 3c, the tumor-volume increase of group 6 was 35±8% for 2 weeks, which was significantly lower than those of groups 3-5 (p<0.05); that of group 5 was 204±34%, which was also significantly lower than that of group 3 (399±53%; p=0.042), but not different from that of group 4 (275±57%; p=0.448). The tumor-volume changes of groups 3 and 4 also were not statistically different (p=0.095). The tumor-volume changes during 2 weeks post therapy start differed among the four groups with the control group increasing the most and the combination therapy group increasing the least. This difference in change is reflected in the significant (p=0.004) interaction term. At day 35, the effect of the combination therapy was greater than the sum of the effects of the other two treatments relative to the control group (decrease of 364% vs. 319%) indicating synergy between the two treatments. Figure 3d shows the tumor volume changes versus tumor SUVmean changes over 2 weeks during therapy, and a significant correlation was detected between the two variables (p=0.002).
Figure 3.
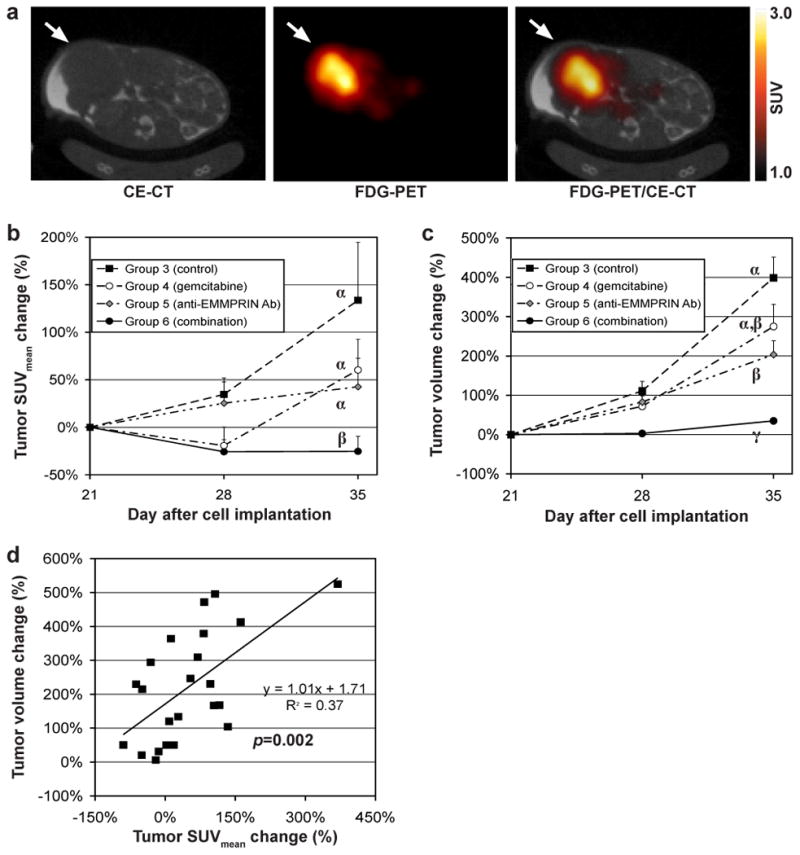
(a) Representative contrast enhanced (CE) CT image, 18F-FDG PET image, and fused PET/CT image of a mouse bearing a MIA PaCa-2 tumor orthotopically (axial view), while tumor location is indicated with a white arrow in each subfigure. (b) Tumor SUVmean and (c) tumor voulme changes of groups 3-6 untreated (served as control) or treated with gemcitabine, anti-EMMPRIN antibody, and combination therapy respectively (different Greek letters represent the statistical significance among the groups 3-6 (p<0.05)). (d) The correlation between tumor SUVmean and tumor volume changes during 2 weeks.
Histologic analysis showed the combination therapy with anti-EMMPRIN antibody and gemcitabine reduced tumor-cell proliferation, but did not increase the level of apoptosis. Figure 4a shows the representative microphotographs of Ki67 stained tumor slices (5-μ thickness) of groups 3-6, while the proliferating (Ki67 stained) cells are indicated with black arrows in each subfigure. Figure 4b shows the averaged Ki67 expressed cell densities (cell number/mm2) of groups 3-6 (n=5 for group 3; n=6 for groups 4-6). The Ki67 expressed cell density of group 6 (1064±147 mm-2) was significantly lower than that of group 3 (560±76 mm-2; p=0.008), but not different from those of groups 4 and 5. The average density of Ki67-expressing cells of groups 4 and 5 were 31% and 21% lower than that of group 3, respectively, but not statistically significant. Figure 4c presents the positive linear relationship between the averaged Ki67-expressing cell densities and the averaged tumor SUVmean changes over 2 weeks, but the correlation was not statistically significant. The averaged apoptotic (TUNEL stained) cell densities of groups 3-6 (microphotographs are not shown) were 18±13, 17±9, 10±6, and 24±14 mm-2, respectively, but no statistical difference was noted among the groups.
Figure 4.
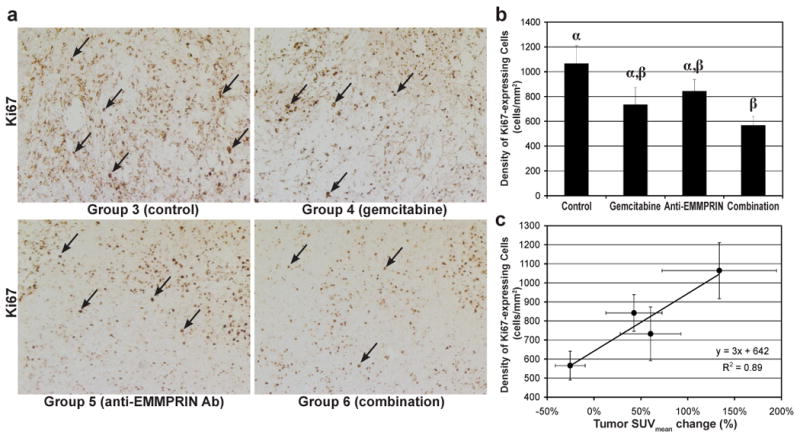
Histologic analysis of tumor response. (a) Representative Ki67 stained (original magnification: ×200) slices of MIA PaCa-2 tumors (collected at day 35) of group 3 (untreated control) and groups 4-6 treated with gemcitabine, anti-EMMPRIN antibody, or combination therapy, respectively. Cells expressing Ki67 are indicated with black arrows in each sub slices. (b) Proliferating (Ki67 expressing) cell density (cell number/mm2) of MIA PaCa-2 tumors of the groups 3-6. Proliferating cell density of the tumors treated with anti-EMMPRIN antibody in combination with gemcitabine (group 6) was significantly lower than that of the control group (group 3), but not different from those of the groups treated with gemcitabine (groups 4) or anti-EMMPRIN antibody (group 5), as different Greek letters represent statistically significant difference among groups. (c) Mean Ki67 expressing cell density versus mean tumor SUVmean changes of groups 3-6 during 2 weeks.
Discussion
Tumor growth was significantly suppressed by anti-EMMPRIN monotherapy compared with the control, and synergy was demonstrated when combined with the current standard of chemotherapy. Administration of two agents having different therapeutic mechanisms may induce additional stress to the tumor cells that are resistant to a monotherapy, leading to the synergistic efficacy. Alternatively, the anti-angiogenic effect of anti-EMMRPIN antibody may induce the normalization of tumor microvasculature, reducing interstitial pressure and thereby improving drug delivery [38]. Because EMMPRIN has very limited expression in normal cell types [20], the adverse side effect of anti-EMMPRIN antibody is likely minimal. In fact, the mean body weight of animals treated with gemcitabine and anti-EMMPRIN antibody was not statistically changed during 2 weeks of therapy (p=0.707). This suggests that anti-EMMPRIN therapy may be combined with other therapeutic modalities with non-overlapping toxicities. The combined therapy significantly reduced tumor-cell proliferation, but the apparent increase in apoptotic-cell density was not statistically significant, which is consistent with the results of the recently published study assessing anti-EMMPRIN antibody for head and neck squamous cell carcinoma [39]. Anti-EMMPRIN therapy is cytostatic and therefore may work better in the adjuvant therapy setting than for the treatment of established tumors.
The mean tumor SUV (SUVmean) for FDG was significantly reduced by combined anti-EMMPRIN antibody and gemcitabine therapy (group 3 versus group 6), with the tumor SUVmeanfor groups 3-6 positively correlated with the densities of Ki67-expressing (ie proliferating) tumor cells. Therefore, 18F-FDG PET and CT combined imaging of pancreatic cancer may yield a more accurate assessment of the anti-EMMPRIN therapy than CT imaging alone. While tumor SUVmean of animals injected with anti-EMMPRIN antibody (group 5) gradually increased over time, gemcitabine monotherapy reduced tumor SUVmean (group 4) about 20% for the first week, but did not maintain the reduction during the second week; this may be due to the proliferation of gemcitabine-resistant cells after most cells sensitive to gemcitabine were killed during the early therapeutic response. The regrowth of tumor resistant to gemcitabine monotherapy might be prevented by additional anti-EMMPRIN therapy, as demonstrated in Fig. 3. SUVmean quantification enabled the sensitive detection of tumor response following gemcitabine during the first week post therapy initiation, but the tumor response but was not demonstrable by CT-based volumetric analysis, suggesting that FDG PET may disclose a metabolic tumor response to therapy earlier than morphological imaging modalities such as CT. However, tumor SUVmean was not reduced by anti-EMMPRIN therapy; anti-EMMPRIN antibody does not directly induce the death of cancer cells, and thereby cell glycolysis might not be changed. Therefore, for accurate cancer prognosis using FDG PET, the pharmacokinetics of administered drugs will need to be considered.
The averaged coefficient of variation (COV) of tumor SUVmean changes at each time point relative to day 0 was 0.47±0.04 (n=8; n=4 per each time point), which was significantly higher than that of tumor volume changes 0.28±0.03 (p=0.003). In one study, the COV of the tumor uptake of18F-FDG was measured as 0.15±0.03 (n=25) [21], which is comparable with the difference between the COVs of tumor volume and SUVmean changes in this study. Multiple factors such as fasting period, room temperature, body movement, and anesthesia duration affect blood-glucose level, and thereby contribute to the variation of quantification of SUV; it was attempted to compensate for this affect on the dose uptake by measuring the blood-glucose concentration, but this was not successful [21]. Also, 18F-FDG is accumulated in glucose-consuming cells, not proliferating cells, and therefore inflammatory cell infiltration into tumor may further reduce the reproducibility.
Conclusions
The therapeutic efficacy of anti-EMMPRIN antibody was demonstrated in an orthotopic pancreatic-tumor murine model using 18F-FDG PET and CT combined imaging, and a synergy was measured when the therapy was combined with gemcitabine. Anti-EMMPRIN therapy with gemcitabine successfully suppressed tumor-cell proliferation without increasing apoptosis, and therefore this approach may be more effective in an adjuvant setting or preventing early tumorigenesis. These data provide support for clinical studies of anti-EMMPRIN therapy with gemcitabine for pancreatic cancer treatment, and the application of PET/CT with 18F-FDG to monitor efficacy.
Acknowledgments
Financial support was provided by an HSF-GEF Scholar Award, AACR-PANCAN Career Development Award, National Cancer Institute (R01CA142637 and 5K08CA102154), the Pancreatic SPORE (CA101955), and the UAB small animal imaging shared facility (5P30CA013148). Authors thank Sharon Samuel, Lee Whitworth, and Amber Martin for assistance with growing cells, in vitro assays, animal monitoring, and imaging. All experiments complied will current regulatory and ethical requirements.
Footnotes
Conflict of Interest. No authors have conflict of interest to report.
References
- 1.Jemal A, Siegel R, Ward E, Hao Y, Xu J, Thun MJ. Cancer statistics, 2009. CA Cancer J Clin. 2009;59:225–249. doi: 10.3322/caac.20006. [DOI] [PubMed] [Google Scholar]
- 2.Klapman J, Malafa MP. Early detection of pancreatic cancer: why, who, and how to screen. Cancer Control. 2008;15:280–287. doi: 10.1177/107327480801500402. [DOI] [PubMed] [Google Scholar]
- 3.Burris HA, Moore MJ, Andersen J, et al. Improvements in survival and clinical benefit with gemcitabine as first-line therapy for patients with advanced pancreas cancer: a randomized trial. J Clin Oncol. 1997;15:2403–2413. doi: 10.1200/JCO.1997.15.6.2403. [DOI] [PubMed] [Google Scholar]
- 4.Cardenes HR, Chiorean EG, Dewitt J, Schmidt M, Loehrer P. Locally advanced pancreatic cancer: current therapeutic approach. Oncologist. 2006;11:612–623. doi: 10.1634/theoncologist.11-6-612. [DOI] [PubMed] [Google Scholar]
- 5.Stathis A, Moore MJ. Advanced pancreatic carcinoma: current treatment and future challenges. Nat Rev Clin Oncol. 2010;7:163–172. doi: 10.1038/nrclinonc.2009.236. [DOI] [PubMed] [Google Scholar]
- 6.Berlin JD, Catalano P, Thomas JP, Kugler JW, Haller DG, Benson AB. Phase III study of gemcitabine in combination with fluorouracil versus gemcitabine alone in patients with advanced pancreatic carcinoma: Eastern Cooperative Oncology Group Trial E2297. J Clin Oncol. 2002;20:3270–3275. doi: 10.1200/JCO.2002.11.149. [DOI] [PubMed] [Google Scholar]
- 7.Heinemann V, Quietzsch D, Gieseler F, et al. Randomized phase III trial of gemcitabine plus cisplatin compared with gemcitabine alone in advanced pancreatic cancer. J Clin Oncol. 2006;24:3946–3952. doi: 10.1200/JCO.2005.05.1490. [DOI] [PubMed] [Google Scholar]
- 8.Rocha Lima CM, Green MR, Rotche R, et al. Irinotecan plus gemcitabine results in no survival advantage compared with gemcitabine monotherapy in patients with locally advanced or metastatic pancreatic cancer despite increased tumor response rate. J Clin Oncol. 2004;22:3776–3783. doi: 10.1200/JCO.2004.12.082. [DOI] [PubMed] [Google Scholar]
- 9.Louvet C, Labianca R, Hammel P, et al. Gemcitabine in combination with oxaliplatin compared with gemcitabine alone in locally advanced or metastatic pancreatic cancer: results of a GERCOR and GISCAD phase III trial. J Clin Oncol. 2005;23:3509–3516. doi: 10.1200/JCO.2005.06.023. [DOI] [PubMed] [Google Scholar]
- 10.Abou-Alfa GK, Letourneau R, Harker G, et al. Randomized phase III study of exatecan and gemcitabine compared with gemcitabine alone in untreated advanced pancreatic cancer. J Clin Oncol. 2006;24:4441–4447. doi: 10.1200/JCO.2006.07.0201. [DOI] [PubMed] [Google Scholar]
- 11.Moore MJ, Goldstein D, Hamm J, et al. Erlotinib plus gemcitabine compared with gemcitabine alone in patients with advanced pancreatic cancer: a phase III trial of the National Cancer Institute of Canada Clinical Trials Group. J Clin Oncol. 2007;25:1960–1966. doi: 10.1200/JCO.2006.07.9525. [DOI] [PubMed] [Google Scholar]
- 12.Kindler HL. Pancreatic cancer: an update. Curr Oncol Rep. 2007;9:170–176. doi: 10.1007/s11912-007-0018-z. [DOI] [PubMed] [Google Scholar]
- 13.Kindler HL. Front-line therapy of advanced pancreatic cancer. Semin Oncol. 2005;32:S33–36. doi: 10.1053/j.seminoncol.2005.06.007. [DOI] [PubMed] [Google Scholar]
- 14.Biswas C, Zhang Y, DeCastro R, et al. The human tumor cell-derived collagenase stimulatory factor (renamed EMMPRIN) is a member of the immunoglobulin superfamily. Cancer Res. 1995;55:434–439. [PubMed] [Google Scholar]
- 15.Suzuki S, Sato M, Senoo H, Ishikawa K. Direct cell-cell interaction enhances pro-MMP-2 production and activation in co-culture of laryngeal cancer cells and fibroblasts: involvement of EMMPRIN and MT1-MMP. Exp Cell Res. 2004;293:259–266. doi: 10.1016/j.yexcr.2003.10.010. [DOI] [PubMed] [Google Scholar]
- 16.Ellenrieder V, Alber B, Lacher U, et al. Role of MT-MMPs and MMP-2 in pancreatic cancer progression. Int J Cancer. 2000;85:14–20. doi: 10.1002/(sici)1097-0215(20000101)85:1<14::aid-ijc3>3.0.co;2-o. [DOI] [PubMed] [Google Scholar]
- 17.Tang Y, Nakada MT, Kesavan P, et al. Extracellular matrix metalloproteinase inducer stimulates tumor angiogenesis by elevating vascular endothelial cell growth factor and matrix metalloproteinases. Cancer Res. 2005;65:3193–3199. doi: 10.1158/0008-5472.CAN-04-3605. [DOI] [PubMed] [Google Scholar]
- 18.Bougatef F, Quemener C, Kellouche S, et al. EMMPRIN promotes angiogenesis through hypoxia-inducible factor-2alpha-mediated regulation of soluble VEGF isoforms and their receptor VEGFR-2. Blood. 2009;114:5547–5556. doi: 10.1182/blood-2009-04-217380. [DOI] [PubMed] [Google Scholar]
- 19.Zheng HC, Takahashi H, Murai Y, et al. Upregulated EMMPRIN/CD147 might contribute to growth and angiogenesis of gastric carcinoma: a good marker for local invasion and prognosis. Br J Cancer. 2006;95:1371–1378. doi: 10.1038/sj.bjc.6603425. [DOI] [PMC free article] [PubMed] [Google Scholar]
- 20.Riethdorf S, Reimers N, Assmann V, et al. High incidence of EMMPRIN expression in human tumors. Int J Cancer. 2006;119:1800–1810. doi: 10.1002/ijc.22062. [DOI] [PubMed] [Google Scholar]
- 21.Dandekar M, Tseng JR, Gambhir SS. Reproducibility of 18F-FDG microPET studies in mouse tumor xenografts. J Nucl Med. 2007;48:602–607. doi: 10.2967/jnumed.106.036608. [DOI] [PMC free article] [PubMed] [Google Scholar]
- 22.Kroep JR, Van Groeningen CJ, Cuesta MA, et al. Positron emission tomography using 2-deoxy-2-[18F]-fluoro-D-glucose for response monitoring in locally advanced gastroesophageal cancer; a comparison of different analytical methods. Mol Imaging Biol. 2003;5:337–346. doi: 10.1016/j.mibio.2003.09.007. [DOI] [PubMed] [Google Scholar]
- 23.Kelloff GJ, Hoffman JM, Johnson B, et al. Progress and promise of FDG-PET imaging for cancer patient management and oncologic drug development. Clin Cancer Res. 2005;11:2785–2808. doi: 10.1158/1078-0432.CCR-04-2626. [DOI] [PubMed] [Google Scholar]
- 24.Barber TW, Kalff V, Cherk MH, Yap KS, Evans P, Kelly MJ. (18)F-FDG PET/CT influences management in patients with known or suspected pancreatic cancer. Intern Med J. 2010 doi: 10.1111/j.1445-5994.2010.02257.x. [DOI] [PubMed] [Google Scholar]
- 25.Mataki Y, Shinchi H, Kurahara H, et al. Clinical usefulness of FDG-PET for pancreatic cancer. Gan To Kagaku Ryoho. 2009;36:2516–2520. [PubMed] [Google Scholar]
- 26.Maisey NR, Webb A, Flux GD, et al. FDG-PET in the prediction of survival of patients with cancer of the pancreas: a pilot study. Br J Cancer. 2000;83:287–293. doi: 10.1054/bjoc.2000.1166. [DOI] [PMC free article] [PubMed] [Google Scholar]
- 27.Higashi T, Sakahara H, Torizuka T, et al. Evaluation of intraoperative radiation therapy for unresectable pancreatic cancer with FDG PET. J Nucl Med. 1999;40:1424–1433. [PubMed] [Google Scholar]
- 28.Kuwatani M, Kawakami H, Eto K, et al. Modalities for evaluating chemotherapeutic efficacy and survival time in patients with advanced pancreatic cancer: comparison between FDG-PET, CT, and serum tumor markers. Intern Med. 2009;48:867–875. doi: 10.2169/internalmedicine.48.2009. [DOI] [PubMed] [Google Scholar]
- 29.Schellenberg D, Quon A, Minn AY, et al. 18Fluorodeoxyglucose PET is prognostic of progression-free and overall survival in locally advanced pancreas cancer treated with stereotactic radiotherapy. Int J Radiat Oncol Biol Phys. 2010;77:1420–1425. doi: 10.1016/j.ijrobp.2009.06.049. [DOI] [PubMed] [Google Scholar]
- 30.Schneiderhan W, Diaz F, Fundel M, et al. Pancreatic stellate cells are an important source of MMP-2 in human pancreatic cancer and accelerate tumor progression in a murine xenograft model and CAM assay. J Cell Sci. 2007;120:512–519. doi: 10.1242/jcs.03347. [DOI] [PubMed] [Google Scholar]
- 31.Larsen SK, Solomon HF, Caldwell G, Abrams MJ. [99mTc]tricine: a useful precursor complex for the radiolabeling of hydrazinonicotinate protein conjugates. Bioconjug Chem. 1995;6:635–638. doi: 10.1021/bc00035a020. [DOI] [PubMed] [Google Scholar]
- 32.Lowry O, Rosebrough N, Farr L, Randall R. Protein measurement with the folin phenol reagent. J Biol Chem. 1951;193:265–275. [PubMed] [Google Scholar]
- 33.Prasad R, Ratib O, Zaidi H. Performance evaluation of the FLEX triumph X-PET scanner using the national electrical manufacturers association NU-4 standards. J Nucl Med. 51:1608–1615. doi: 10.2967/jnumed.110.076125. [DOI] [PubMed] [Google Scholar]
- 34.Kim H, Morgan DE, Buchsbaum DJ, et al. Early therapy evaluation of combined anti-death receptor 5 antibody and gemcitabine in orthotopic pancreatic tumor xenografts by diffusion-weighted magnetic resonance imaging. Cancer Res. 2008;68:8369–8376. doi: 10.1158/0008-5472.CAN-08-1771. [DOI] [PMC free article] [PubMed] [Google Scholar]
- 35.Neter J, Kutner MH, Nachtsheim JC, Wasserman W. Applied linear statistical models. Columbus: The McGraw-Hill Companies, Inc; 1996. [Google Scholar]
- 36.Hertzog C, Rovine M. Repeated-measures analysis of variance in developmental research: selected issues. Child Dev. 1985;56:787–809. [PubMed] [Google Scholar]
- 37.Rodgers JL, Nicewander WA. Thirteen ways to look at the correlation coefficient. The American Statistician. 1988;42:59–66. [Google Scholar]
- 38.Escorcia FE, Henke E, McDevitt MR, et al. Selective killing of tumor neovasculature paradoxically improves chemotherapy delivery to tumors. Cancer Res. 2010;70:9277–9286. doi: 10.1158/0008-5472.CAN-10-2029. [DOI] [PMC free article] [PubMed] [Google Scholar]
- 39.Dean NR, Newman JR, Helman EE, et al. Anti-EMMPRIN monoclonal antibody as a novel agent for therapy of head and neck cancer. Clin Cancer Res. 2009;15:4058–4065. doi: 10.1158/1078-0432.CCR-09-0212. [DOI] [PMC free article] [PubMed] [Google Scholar]