Abstract
Individuals with cerebral palsy have neurological deficits that may interfere with motor function and lead to abnormal walking patterns. It is important to know the joint moment generated by the patient’s muscles during walking in order to assist the suboptimal gait patterns. In this paper, we describe a practical strategy for estimating the internal moment of a knee joint from surface electromyography (sEMG) and knee joint angle measurements. This strategy requires only isokinetic knee flexion and extension tests to obtain a relationship between the sEMG and the knee internal moment, and it does not necessitate comprehensive laboratory calibration, which typically requires a 3-D motion capture system and ground reaction force plates. Four estimation models were considered based on different assumptions about the functions of the relevant muscles during the isokinetic tests and the stance phase of walking. The performance of the four models was evaluated by comparing the estimated moments with the gold standard internal moment calculated from inverse dynamics. The results indicate that an optimal estimation model can be chosen based on the degree of cocontraction. The estimation error of the chosen model is acceptable (normalized root-mean-squared error: 0.15–0.29, R: 0.71–0.93) compared to previous studies (Doorenbosch and Harlaar, 2003; Doorenbosch and Harlaar, 2004; Doorenbosch, Joosten, and Harlaar, 2005), and this strategy provides a simple and effective solution for estimating knee joint moment from sEMG.
Index Terms: Cerebral palsy (CP), estimation of knee internal moment, muscular cocontraction, sEMG-moment relationship
I. Introduction
Cerebral palsy (CP) is a neurological disorder of the developing brain that affects body movement, posture, and muscle coordination. The reported worldwide prevalence of CP ranges from 1.6 to 3.3 per 1000 people [4]–[7]. There are approximately 764,000 people with CP in the United States [8]. Related research has shown that the characteristics of CP are muscle imbalance, contractures, spasticity, and abnormal muscle activation patterns such as excessive cocontraction and decreased muscle force [9]–[12]. As a consequence, individuals with CP typically have limited active motion and abnormal gait patterns [13]. In particular, the difference in the knee joint moment between typical development (TD) and CP is greater than that of other joint moments during gait [14], and this deficit is the major cause of a common abnormal gait pattern referred to as “crouch gait.”
Wearable robotic devices can potentially assist crouch gait. In the literature, many control methods proposed for robot-assisted locomotion rely on joint moment feedback [15]–[21]. To estimate the moment needed for these controllers, it is useful to know the joint internal moment. Robotic devices that use surface electromyography (sEMG) signals can calculate joint internal moments for assistance by the robot [18]–[21] because sEMG signals provide information of individual muscles’ activation level [22].
Standard gait analysis methods using joint kinematics and sEMG have been used to estimate the joint moment of the lower limb in individuals with TD [23]–[26] and CP [27]–[30]. Delp et al. analyzed joint moment and muscle contributions during TD [25] and CP [28]–[30] gait cycles using a 3-D musculoskeletal model. The authors investigated the roles and the capacities of the lower limb muscles in stiff-knee gait or crouch gait. Other musculoskeletal models have also estimated the joint kinetics in lower limbs with a correlation coefficient of greater than 0.72 and a mean error of less than 0.28 Nm/kg, which are considered acceptable [23], [24].
However, there are difficulties in applying estimation methods to gait analysis [23]–[26], [28]–[30] in the daily living environment. First, estimation methods require accurate calibration that requires the ground reaction force (GRF) to be measured in addition to kinematic data, and this is only possible in laboratories equipped with a 3-D motion capture system and 6 DOF force plates. Because the users have to recalibrate every time they put the sEMG sensors on due to the variation in attachment of sensors, they must come to the laboratory and calibrate whenever the sensors are attached to their body. Second, it is practically challenging to obtain an accurate calibration with assistive devices (e.g., a cane or a walker) being used during the calibration procedures. However, many children with CP cannot stand or walk without them or other type of external assistance. It is also technically difficult to get clear GRFs/torques for individuals with small step lengths.
Many joint moment estimation methods that do not require laboratory calibration have appeared in the literature, including machine learning models [21], [31], [32], biomechanical muscle models [19], [33], [34], and multiple linear regression models [1]–[3], [18], [35], [36]. The learning models match sEMG signals and the moments with supervised training algorithms, and the muscle models denote the contraction behaviors of the individual skeletal muscles. The regression models assume that the joint moments are generated by the contraction of agonist muscles only, similar to one of the suggested methods in this paper. However, there is a paucity of data regarding the application of these methods to individuals with CP. Because the muscle activation patterns in CP are different from TD [37], the estimation methods developed for TD may not perform successfully in the CP population.
In addition, the learning models may be time consuming to collect a sufficient number of training data sets to prevent poor performance on tasks outside those defined by the training sets. The muscle models require an identification procedure for the physical parameters of the muscles. The regression models, on the other hand, are practical in that they can minimize the time-consuming calibration process and they are simpler than more complex models that would only provide a slight gain in accuracy.
In this paper, we present and compare the validity of four methods of estimating the knee internal moment from sEMG measurements. In particular, this paper highlights how the abnormal coactivation in CP influences the appropriate choice of estimation method. Previous regression method [1]–[3], [18], [35], [36], validated by TD but not CP, was also tested and compared to the new models proposed in this paper.
The sEMG signals from the thigh muscles and the knee joint angle were used to estimate the knee internal moment in the sagittal plane. This strategy requires active isokinetic knee flex-ion and extension tests performed within the device, which takes less than 1 min after setup and does not require laboratory calibration. The performance of these four methods was tested in six children with CP.
II. Methods
Since we aim at calibrating sEMG–moment relationship without laboratory equipment but using simple wearable devices, calibration has to be performed at tasks that do not involve ground contact. Nonweight bearing isokinetic tests were performed to collect data for calibrating sEMG–moment relationship. A preconfigured commercial dynamometer was used instead of an exoskeleton assuming that typical wearable devices can perform the same isokinetic tasks. After calibration, the accuracy of the sEMG–moment relationship was validated at walking task. The estimated knee moment was compared to the gold standard measurement by the laboratory equipment.
A. Experimental Protocol and Study Participants
We completed the following protocol.
The participants sat on a dynamometer (Biodex System 3, Biodex Medical System, Inc., Shirley, NY) with their lower limb secured to it. Two sEMG electrodes (model 243, Noraxon, Scottsdale, AZ) were attached to the thigh muscles (rectus femoris and biceps femoris). As shown in Fig. 1(a), participants were instructed to extend and flex their knee on the dynamometer as fast as they could, while the dynamometer moved at a constant velocity (30°/s). The knee angle limits were set to the maximum passive range of motion of each participant. If the participant could extend their knee to 0° in the reclined posture, the extension boundary was set to 0°; otherwise, the maximum extension boundary was regarded as full extension. Only a single trial of isokinetic flexion and extension was performed because a single contraction was able to calibrate the dependency of the joint angle on the EMG–moment relationship [3].
A custom 6 DOF marker set was attached to the lower extremity of each participant. Four retroreflective markers placed on the pelvis (anterior superior iliac spines and posterior superior iliac spines) were used to predict the hip joint center [38]. Medial and lateral knee and ankle markers were placed for the static standing trial to define the joint axes. Clusters of four markers were used to track the lower extremity segments during the walking trials. Single markers were placed on the feet between the second and third metatarsal head, on the heel and on the lateral foot. Each participant was then instructed to walk three times at a self-selected speed without any assistive device [see Fig. 1(b)]. A 10-camera motion capture system (Vicon Motion Systems, Oxford, U.K.) was used to collect 3-D motion data with synchronized kinetic data from three embedded force platforms (AMTI, Watertown, MA). SEMG signals from the thigh muscles were simultaneously collected using a wireless sEMG system (Trigno Wireless, Delsys, Boston, MA).
Fig. 1.
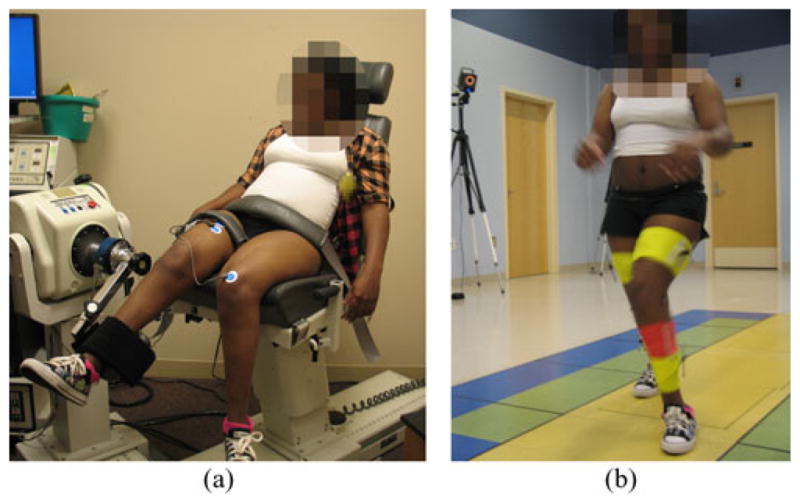
Experimental setup.
We recruited six children with a diagnosis of CP (two males and four females, 12.7 ± 2.9 years old) who were classified as gross motor function classification system (GMFCS) levels I–III (see Table I). P1, P3, P4, P5, and P6 had some instability, but they did not use assistive devices in their daily activities or while walking during the test. P2 (GMFCS level III) used a cane for daily life but was able to walk without a cane during the walking test. The protocol was approved by the Institutional Review Board at the National Institutes of Health. Written informed consent and assent were obtained from all of the parents of the participants. Data from the most affected side of each participant were analyzed.
TABLE I.
Demographics of the Participants
| Participants code | Sex | Age | Height (m) | Mass (kg) | GMFCS | Plegia | Test side |
|---|---|---|---|---|---|---|---|
| P1 | Female | 9.2 | 1.33 | 23.9 | I | Diplegia | Right |
| P2 | Female | 14.4 | 1.44 | 55.9 | III | Diplegia | Right |
| P3 | Female | 17.1 | 1.65 | 54.2 | II | Diplegia | Right |
| P4 | Male | 11.7 | 1.57 | 43.9 | II | Diplegia | Right |
| P5 | Female | 13.3 | 1.45 | 42.7 | II | Diplegia | Left |
| P6 | Male | 10.3 | 1.32 | 30.2 | II | Diplegia | Right |
B. Isokinetic Knee Flexion and Extension Movements
The lower limb and the dynamometer were regarded as a mechanical system represented by the following dynamic equation [39]:
| (1) |
where I denotes the total inertia around the joint, and θ̈ denotes the angular acceleration of the knee joint, respectively. Mknee,measured (θ) = Mknee,internal (θ) + Mgravity (θ) if θ̈ = 0, where Mknee,measured represents the moment measured by the dynamometer, Mknee,internal represents the knee internal moment created by the involved muscles, and Mgravity represents the moment due to the gravity.
In (1), θ̈ is zero when the knee flexes or extends at a constant angular velocity (isokinetic movement) or at zero angular velocity (isometric movement). The gravity moment at every joint angle (Mgravity (θ)) can be calculated from a static gravity measurement at a certain joint angle; therefore, the moment exerted by the involved muscles Mknee,internal can be directly calculated from the sensor measurement Mknee,measured [39]. We chose isokinetic movements to measure the internal moment corresponding to the knee angle range because it is known that sEMG signals are related to the moment as a function of knee angle [1].
During the isokinetic movements, sEMG signals were collected at a sampling frequency of 1000 Hz and the knee moment and angle were simultaneously recorded using the dynamometer. Motion artifacts in the sEMG signals were removed by high-pass filtering at 20 Hz. The mean absolute values (MAV) of the sEMG signals [40] were extracted from sliding time windows of 200 ms at every 10 ms. The 200 ms duration of the window was chosen empirically and the adjacent windows were overlapped by 10 ms to allow for reasonable continuity in the extracted feature. The moment and angle of the knee were downsampled every 10 ms to synchronize with the MAV. The dynamometer was locked to keep the position at the starting and terminating angles, and the angular velocity was not constant near the angular boundary. The knee angle and moment data and the processed sEMG signals (i.e., the MAV) were extracted from the constant angular velocity period.
C. EMG–Moment Relationship Models
Many muscles of the musculoskeletal system work in pairs called agonists and antagonists, and each muscle contraction force produces a net moment around a joint, which is formed by the combination of the agonistic and antagonistic moments. We tested four different estimation models for constructing relevant EMG–moment relationships using two criteria. The first criterion was whether or not cocontraction was considered when calculating the agonistic and antagonistic gains of the sEMG–moment relationship from the isokinetic tests. The second criterion ascertained whether the roles of the agonist muscles and antagonist muscles were clearly differentiated between the flexion and extension phases of the knee during the stance phase of gait (see Fig. 2). Models 1, 2, and 4 are original models proposed by the current study, whereas model 3 is similar to the methods in related literature [1]–[3], [18], [35], [36].
Fig. 2.
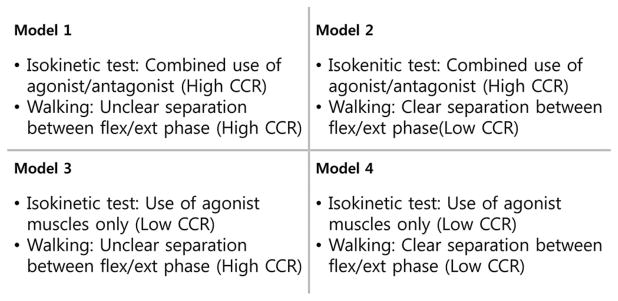
Classification of the models used to estimate the sEMG–moment relationship.
1) Estimation Model 1
The quadriceps and the hamstring muscles play major roles related to knee flexion and extension. The hamstring is an agonist when the knee is flexed, and the quadriceps is an agonist in the opposite case. We assumed that the roles of the agonist and antagonist during each of isokinetic tests are performed by the quadriceps and the hamstring muscles, respectively, if the muscles cocontract during the isokinetic test. From this assumption, we derived the following two equations from the knee internal moment and the sEMG signals during isokinetic flexion and extension movements:
| (2) |
| (3) |
where Mext and Mflx represent the knee moment during knee extension and flexion, respectively, Kagon,ext and Kantag,ext denote the gains for the agonist and antagonist moments during extension, respectively, and Kagon,flx and Kantag,flx denote the gains for the agonist and antagonist moments during flexion, respectively. EMGquadriceps,ext and EMGham string,ext represent the MAV from the rectus femoris and biceps femoris during knee extension, respectively, and EMGquadriceps,flx and EMGham string,flx represent the MAV from the same muscles during flexion; the subscript i indicates the ith time step.
To obtain a gain matrix, a pseudoinverse matrix of sEMG signals is multiplied by the moment, as shown in (4) and (5). For calculating pseudoinverse matrix, the Moore–Penrose pseudoinverse was applied. From the measured knee moment and the sEMG signals collected during the knee flexion and extension tests, the gain matrix was computed at every time step. We identified the dependency of the gain matrix on the knee angle (θ) using a quadratic least-squares fitting technique; therefore, the gain matrices have a second-order polynomial form as a function of the angle (θ).
| (4) |
| (5) |
By assuming that each muscle frequently alternates between the roles of agonist and antagonist or cocontracts throughout the gait cycle, it may be difficult to classify the agonistic and antagonistic roles, but the gains of the agonist and antagonist from each isokinetic test can be added; finally, the total knee internal moment can be estimated using the sEMG signals and the computed gains. Equation (6) is the final form of estimation model 1.
| (6) |
2) Estimation Model 2
We assumed that the muscles cocontract during isokinetic tests, as in model 1. Although the gain matrices can be obtained from (4) and (5) under this assumption (the first criterion), it was also assumed that the gains of the agonist and antagonist from each of the isokinetic tests can be used separately according to the movement direction (i.e., flexion and extension) because the gains from each of the isokinetic flexion and extension tests are calculated separately. The movement direction is the same as the sign of the joint angular velocity, and thus, (2) and (3) can be used separately, as in the following equation:
| (7) |
3) Estimation Model 3
If the contribution of the agonistic muscle is dominant and the activation of the antagonistic muscle is weak during knee flexion and extension movements, the terms for the antagonist in (2) and (3) can be neglected, as in the following (8) and (9):
| (8) |
| (9) |
As with model 1, it is possible to assume that each muscle frequently alternates between the roles of agonist and antagonist or cocontracts throughout the gait cycle. Consequently, the gains of the agonist and antagonist from each of the isokinetic tests can be added in the same way as they are added in (6)
| (10) |
4) Estimation Model 4
Similar to model 3, it can be assumed that the quadriceps and hamstring muscles only have an agonistic role for each of isokinetic tests if the contraction of the agonistic muscle dominates the knee joint moment during the isokinetic tests, and (8) and (9) can be used. In addition, based on the second assumption of model 2, the gains of the agonist and antagonist from each of the isokinetic tests can be used separately according to the movement direction, as in the following equation:
| (11) |
A schematic outline of the practical EMG–moment estimation model is shown in Fig. 3. We entered the data from the isokinetic tests into the four estimation models to obtain the gains. Each gain as a function of joint angle was fitted to a quadratic polynomial.
Fig. 3.
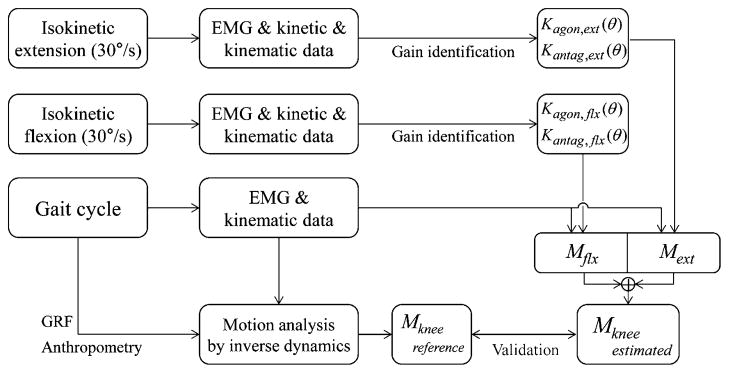
Schematic outline of practical EMG–moment model and its validation.
D. Validation
To validate the feasibility of our four models of EMG–moment relationships, we used the gold standard of gait analysis, which is based on the inverse dynamics model. The inverse dynamics model yields the joint moment computation during the stance phase of a gait using lower limb kinematics, the GRF, and the anthropometric data for each subject. During the walking test, the motion capture system and the force platforms collected the kinematic data and the GRF were recorded at a sampling frequency of 120 Hz. The moment computed by the gait analysis was used as the reference moment.
During the test, sEMG signals were simultaneously recorded at a sampling frequency of 1080 Hz and scaled by a preamplification ratio due to the use of different electrodes. The MAV were extracted from sliding time windows of 180 ms every 9 ms. Subsequently, the knee internal moment was estimated using the kinematic data and the MAV via the four suggested models.
The reference and estimated moments were normalized by body weight. The performance of our strategy was then evaluated by calculating the normalized root-mean-squared error (NRMSE) and the Pearson’s correlation coefficient (R) between the moments for each model [41]. The NRMSE indicates the relative closeness between the estimated and reference moments with respect to the reference moment ranges, whereas R indicates the strength of the linear relationship between the estimated and reference moments.
III. Results
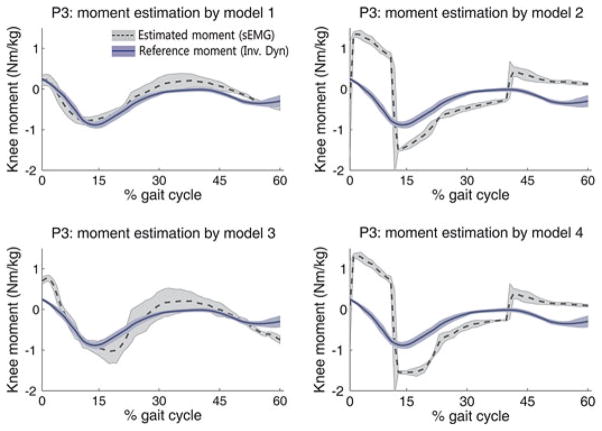
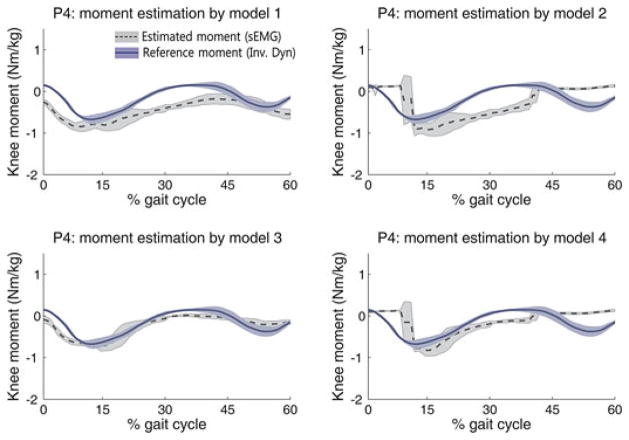
The NRMSE and the R of each method are shown in Table II. Figs. 4 and 5 illustrate the representative patterns of the estimated moments and the reference moments during the stance phase for P3 and P4, respectively. In the left and middle rows of Figs. 4 and 5, the blue solid line indicates the average of the reference moment computed by inverse dynamics, and the dark gray dotted line indicates the average of the estimated moment. Each shaded area represents the standard deviation from three walking trials. In the case of the best performance, the estimated moment was similar to the reference moment, and they were consistent with the quantitative evaluation indices.
TABLE II.
Performance of Estimation Models
| Participants code | Model 1 | Model 2 | Model 3 | Model 4 | ||||
|---|---|---|---|---|---|---|---|---|
|
| ||||||||
| NRMSE | R | NRMSE | R | NRMSE | R | NRMSE | R | |
| P1 | 0.26±0.08 | 0.83±0.05 | 0.44±0.10 | 0.41±0.08 | 0.17±0.03 | 0.85±0.03 | 0.36±0.03 | 0.43±0.03 |
| P2 | 0.19±0.01 | 0.85±0.03 | 0.25±0.06 | 0.80±0.13 | 0.40±0.09 | 0.83±0.07 | 0.37±0.13 | 0.76±0.13 |
| P3 | 0.15±0.05 | 0.93±0.01 | 0.64±0.07 | 0.48±0.01 | 0.24±0.06 | 0.93±0.02 | 0.63±0.05 | 0.55±0.01 |
| P4 | 0.38±0.04 | 0.80±0.06 | 0.48±0.06 | 0.30±0.15 | 0.17±0.02 | 0.86±0.04 | 0.34±0.06 | 0.51±0.14 |
| P5 | 0.18±0.01 | 0.92±0.03 | 0.32±0.06 | 0.26±0.37 | 0.19±0.01 | 0.84±0.03 | 0.32±0.06 | 0.38±0.34 |
| P6 | 0.29±0.02 | 0.71±0.13 | 0.31±0.01 | 0.10±0.06 | 0.68±0.05 | 0.82±0.21 | 0.53±0.08 | 0.13±0.07 |
Fig. 4.
Estimated moments by the four models (P3).
Fig. 5.
Estimated moments by the four models (P4).
In cases of P1 and P4, estimation model 3 provided the best performance for moment estimation, whereas model 1 provided the best performance for the other subjects. In cases of P6, model 3 provided larger NRMSE than other models even though model 3 also provide the highest R value; thus, we regarded model 1 as the best model for P6.
The NRMSE ranged from 0.15 to 0.29, and the R ranged from 0.71 to 0.93 in the best cases. Compared to the results of previous study (NRMSE: 0.07–0.29) [2], which referred the error range as “reasonable good estimate,” and considering the high R value, we conclude that the proposed method is able to estimate knee joint moment acceptably. In Figs. 4 and 5, the moment estimated by models 2 and 4 shows a steep rising and falling slope; these models switch the muscle roles according to the movement direction (flexion and extension), at which point an entirely different relationship equation is used. The steep slope occurs at the switching time.
IV. Discussion
To find optimal estimation strategy, we tested four models, which assumed different EMG–moment relationships in the isokinetic tests (calibrating task) and the stance phase of walking (target task). Two criteria were considered to differentiate whether the agonistic and antagonistic muscles were clearly separated during the stance phase of walking, and whether or not agonistic and antagonistic muscles cocontracted in each of the calibrating and the target tasks, respectively.
It was observed that the quadriceps and hamstring muscles were activated regardless of knee flexion and extension during the stance phase of walking, and the performance of estimation models 1 and 3 was better than that of models 2 and 4. Therefore, during the stance phase of walking, it can be inferred that the models that do not separate flexion and extension phases [(6) and (10)] should be used. Moreover, models 2 and 4 showed a steep rising and falling slope due to the switching of the sEMG–moment relationship, indicating that this switching cannot reconstruct relevant sEMG–moment relationships.
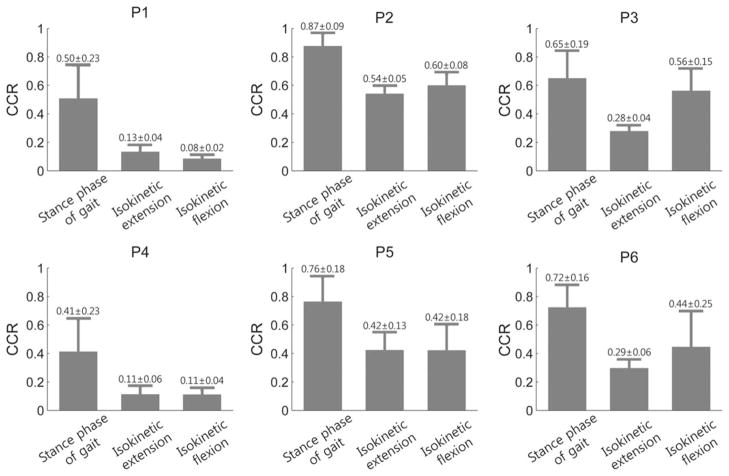
Muscle cocontraction is the simultaneous activation of agonistic and antagonistic muscle groups crossing the same joint and the same plane [11]. This activation pattern can efficiently increase joint stability and improve movement accuracy, but excessive muscle cocontraction in individuals with CP causes impaired movement [9]. It is known that children with CP commonly use cocontraction across different tasks [11]; however, cocontraction during the calibrating task for the sEMG–moment relationships has not been considered. We used estimation model 1 to consider the existence of cocontraction during the isokinetic tests, whereas previous methods [1]–[3], [18], [35], [36] that are similar to model 3 did not consider the co-contraction during the calibrating tasks. In model 1, four gains represent the contributions of the agonist and antagonist muscles to the flexion and extension moments in (2) and (3), and adding the gains of the agonist and antagonist implies that the rectus femoris and biceps femoris muscles exert agonistic and antagonistic moments simultaneously. To investigate the influence of the antagonistic gains, the cocontraction ratio (CCR) [11] of the rectus femoris and biceps femoris muscles during stance phase of walking and flexion/extension of isokinetic tests was calculated (see Fig. 6). The reported CCR of the quadriceps and hamstring in individuals with CP during isometric contraction was greater than 0.28, whereas that in TD was smaller than 0.17 [42]. Based on this criterion, subjects P2, P3, P5, and P6 showed greater CCR (>0.28) during the isokinetic tests and the stance phase of walking. For these subjects, model 1 resulted in better performance by considering cocontraction during the calibrating task. For the other subjects (P1 and P4), the CCR was smaller (<0.13), and model 3, which does not consider cocontraction during the calibrating task, showed better performance than model 1. These results indicate that the CCR during calibration tests can be an important index for finding optimal estimation strategy.
Fig. 6.
Cocontraction ratios (CCRs) of all participants during each task.
The proposed estimation methods would not be as accurate as the comprehensive gait analysis using the 3-D musculoskeletal model, which has allowed researchers to simulate the roles and the capacities of the lower limb muscles in individuals with CP [27]–[30]. The estimation gains might not hold across non-weight bearing tasks and weight bearing tasks. The best way to obtain the parameters in walking task would be to calibrate during the same task or similar tasks (e.g., squatting). These tasks require laboratory equipment, which is not available in the home environment. For a simple and practical strategy, the current study selected nonweight bearing task as an alternative solution and improved the accuracy by proposing various models depending on subject-specific CCRs.
There is a tradeoff between simplicity of calibration and accuracy of modeling the sEMG–moment relationship. Muscle length is a major contributor to force production [43], and we assumed that muscle length was correlated to joint angle to take the length–moment dependency into account. Muscle force is also dependent on velocity [43], therefore, performing the calibration at multiple angular velocities may improve the accuracy of estimating the gain matrices. Since the patient will need to perform a calibration each time they put on a device, the isokinetic test was performed only at one constant velocity (30°/s) to keep the calibration procedure simple. The estimation result was still acceptable compared to the previous studies on healthy volunteers [1]–[3]. However, future work should focus on tuning the gain to match nonconstant angular velocities that occur during walking, by calibrating at multiple velocities, and evaluating the effect of the introduction of velocity dependency into the proposed models.
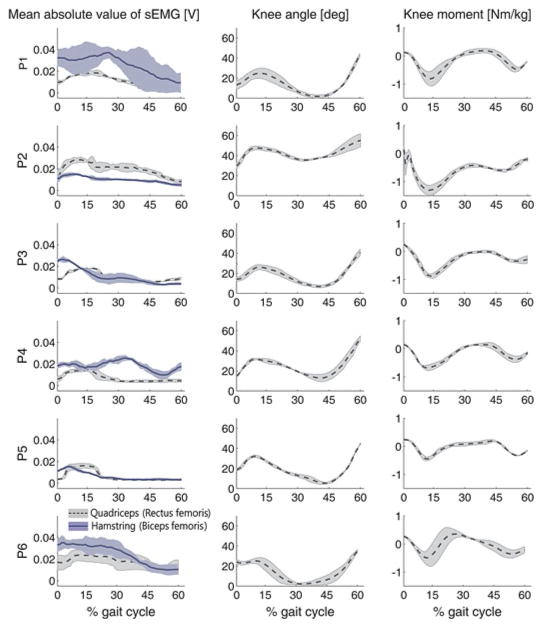
The participants in our study had various degrees of motor ability (GMFCS levels I–III); the sEMG signals, the knee angle, and the knee moment patterns of each participant during the stance phase were different (see Fig. 7), and the CCR also differed by tasks within the same participant (see Fig. 6). Therefore, more differentiated models that include other subject-specific characteristics such as knee angle range may further enhance the estimation performance.
Fig. 7.
SEMG, knee joint angle, and knee internal moment patterns of each participant during the stance phase; each shaded area represents the standard deviation from three walking trials.
SEMG patterns can be changed by physical interaction between a subject and an exoskeleton, such as overreaction of a subject against assistance by an exoskeleton [19], which could cause the estimated moments to be no longer valid. Therefore, when the proposed strategy is applied to the assistive devices in home environment, the influence of physical interaction on sEMG patterns should be investigated in future.
V. Conclusion
Knee internal moment calculation typically requires a 3-D motion capture system and GRF measurements, thereby restricting its applicability to assessments performed in gait laboratories. For individuals with CP, we proposed a practical strategy for estimating the knee internal moment from the sEMG signals and knee joint angle measurements instead of the typical kinetic analysis (using the motion capture system and GRF measurements). Our strategy requires only isokinetic knee flexion and extension tests to obtain a relationship between the sEMG signals and the knee internal moment. The knee moments estimated by the four different models assumed different roles of the relevant muscles during the isokinetic tests and the stance phase of walking. The moments estimated by each of the four models were compared with the internal moments calculated from the kinetic analysis (using the motion capture system and GRF measurements).
Our investigation highlights that the model with the optimal performance can be determined by measuring CCR during the calibrating tasks because individuals with CP generally show excessive cocontraction and indistinct muscle roles as opposed to TD. If the CCRs during the calibration tasks are relatively large, model 1 that incorporates both agonistic and antagonistic muscles into the regression model results in more accurate estimation. Otherwise, the model considering only agonistic muscle showed better accuracy.
This paper provides a simple and effective solution for building sEMG–moment relationship so that the calibration can be performed easily in the home environment.
Acknowledgments
This work was supported by the Je Won Research Foundation, the Happy Tech. Program through the National Research Foundation of Korea (NRF) funded by the Ministry of Education, Science and Technology under Grant 2011-0020934, and the Intramural Research Program at the National Institutes of Health (Protocol #: 10-CC-0073).
Biographies
Suncheol Kwon (S’11) received the M.S. degree from the Department of Mechanical Engineering Korea Advanced Institute of Science and Technology, Daejeon, Korea, in 2009, where he is currently working toward the Ph.D. degree in mechanical engineering.
His current research interests include surface electromyography (sEMG) analysis in patients and sEMG-based physical human robot interactions.

Hyung-Soon Park (M’05) received the Ph.D. degree in mechanical engineering from the Korea Advanced Institute of Science and Technology, Daejeon, Korea, in 2004.
He is currently a staff scientist in the Rehabilitation Medicine Department, Clinical Center, National Institutes of Health, Bethesda, MD. His current research interest include the application of robotics and control technology on rehabilitation medicine, and biomechanics of human movement.

Christopher J. Stanley received the M.S. degree in human movement science from the Department of Allied Health Sciences, University of North Carolina, Chapel Hill, in 2003.
He is currently a Research Engineer in the Rehabilitation Medicine Department, Clinical Center, National Institutes of Health, Bethesda, MD.

Jung Kim (M’05) received the Ph.D. degree from the Department of Mechanical Engineering, Massachusetts Institute of Technology, Cambridge, in 2004.
He is currently an Associate Professor in the Department of Mechanical Engineering, Korea Advanced Institute of Science and Technology, Daejeon, Korea. His current research interests include haptics, biosignal analysis for healthcare, and physical human robot interactions

Jonghyun Kim (S’05) received the Ph.D. degree from the Department of Mechanical Engineering, Korea Advanced Institute of Science and Technology, Daejeon, Korea, in 2010.
Since 2010, he has been with the Rehabilitation Medicine Department, Clinical Center, National Institutes of Health, Bethesda, MD, where he is currently a Visiting Fellow. His active research interests include the design and control of bilateral teleoperation, haptic display, and rehabilitation robotic systems.

Diane L. Damiano received the Ph.D. degree in research methods/biomechanics from the University of Virginia, Charlottesville, in 1993.
She is currently the Chief of the Functional and Applied Biomechanics Section in the Rehabilitation Medicine Department, Clinical Center, National Institutes of Health, Bethesda, MD. Her research interests include the investigation of both existing and novel activity-based rehabilitation approaches in children with cerebral palsy, which has helped to revolutionize the treatment of these patients.
Footnotes
Color versions of one or more of the figures in this paper are available online at http://ieeexplore.ieee.org.
Contributor Information
Suncheol Kwon, Email: sun.kwon@kaist.ac.kr, Department of Mechanical Engineering, Korea Advanced Institute of Science and Technology, Daejeon 305-701, Korea.
Hyung-Soon Park, Email: parkhs@cc.nih.gov, Functional and Applied Biomechanics Section, Rehabilitation Medicine Department/Clinical Center, National Institutes of Health, Bethesda, MD 20892 USA.
Christopher J. Stanley, Email: stanleycj@cc.nih.gov, Functional and Applied Biomechanics Section, Rehabilitation Medicine Department/Clinical Center, National Institutes of Health, Bethesda, MD 20892 USA
Jung Kim, Email: jungkim@kaist.ac.kr, Department of Mechanical Engineering, Korea Advanced Institute of Science and Technology, Daejeon 305-701, Korea.
Jonghyun Kim, Email: kimj13@cc.nih.gov, Functional and Applied Biomechanics Section, Rehabilitation Medicine Department/Clinical Center, National Institutes of Health, Bethesda, MD 20892 USA.
Diane L. Damiano, Email: damianod@cc.nih.gov, Functional and Applied Biomechanics Section, Rehabilitation Medicine Department/Clinical Center, National Institutes of Health, Bethesda, MD 20892 USA
References
- 1.Doorenbosch CAM, Harlaar J. A clinically applicable EMG-force model to quantify active stabilization of the knee after a lesion of the anterior cruciate ligament. Clin Biomechanics. 2003 Feb;18(2):142–149. doi: 10.1016/s0268-0033(02)00183-3. [DOI] [PubMed] [Google Scholar]
- 2.Doorenbosch CAM, Harlaar J. Accuracy of a practicable EMG to force model for knee muscles. Neurosci Lett. 2004;368:78–81. doi: 10.1016/j.neulet.2004.06.055. [DOI] [PubMed] [Google Scholar]
- 3.Doorenbosch CAM, Joosten A, Harlaar J. Calibration of EMG to force for knee muscles is applicable with submaximal voluntary contractions. J Electromyography Kinesiology. 2005 Aug;15(4):429–435. doi: 10.1016/j.jelekin.2004.11.004. [DOI] [PubMed] [Google Scholar]
- 4.Liu J-M, Li S, Li Z. Prevalence of cerebral palsy in China. Int J Epidemiology. 1999 May;28:949–954. doi: 10.1093/ije/28.5.949. [DOI] [PubMed] [Google Scholar]
- 5.Kirby RS, Wingate MS, Van Naarden Braun K, Doernberg NS, Arneson CL, Benedict RE, Mulvihill B, Durkin MS, Fitzgerald RT, Maenner MJ, Patz JA, Yeargin-Allsopp M. Prevalence and functioning of children with cerebral palsy in four areas of the United States in 2006: A report from the Autism and Developmental Disabilities Monitoring Network. Res Develop Disabilities. 2011;32(2):462–469. doi: 10.1016/j.ridd.2010.12.042. [DOI] [PubMed] [Google Scholar]
- 6.Surveillance of Cerebral Palsy in Europe (SCPE), Prevalence and characteristics of children with cerebral palsy in Europe. Developmental Med Child Neurology. 2002 Sep;44(9):633–640. [PubMed] [Google Scholar]
- 7.Park MS, Kim SJ, Chung CY, Kwon DG, Choi IH, Lee KM. Prevalence and lifetime healthcare cost of cerebral palsy in South Korea. Health Policy. 2011 May;100(2–3):234–238. doi: 10.1016/j.healthpol.2010.09.010. [DOI] [PubMed] [Google Scholar]
- 8.United Cerebral Palsy. CP fact sheet [Online] 2010 Available: http://affnet.ucp.org/uploads/CPFACTSHEET914.pdf.
- 9.Perry J, Newsam C. Function of the hamstrings in cerebral palsy. In: Sussman MD, editor. Diplegic Child: Evaluation and Management. Rosemont (IL): American Academy of Orthopaedic Surgeons; 1992. pp. 299–307. [Google Scholar]
- 10.Dietz V, Berger W. Cerebral palsy and muscle transformation. Dev Med Child Neurol. 1995;37:180–184. doi: 10.1111/j.1469-8749.1995.tb11987.x. [DOI] [PubMed] [Google Scholar]
- 11.Damiano DL, Martellotta TL, Sullivan DJ, Granata KP, Abel MF. Muscle force production and functional performance in spastic cerebral palsy: Relationship of cocontraction. Archives Phys Med Rehabil. 2000 Jul;81(7):895–900. doi: 10.1053/apmr.2000.5579. [DOI] [PubMed] [Google Scholar]
- 12.Wiley ME, Damiano DL. Lower-extremity strength profiles in spastic cerebral palsy. Develop Med Child Neurol. 1998;40(2):100–107. doi: 10.1111/j.1469-8749.1998.tb15369.x. [DOI] [PubMed] [Google Scholar]
- 13.Savelsbergh G, Davids K, van der Kamp J, Bennett SJ. Development of Movement Co-ordination in Children: Applications in the Fields of Ergonomics, Health Sciences and Sport. 12 Vol. 45. London, U.K: Routledge; 2003. [Google Scholar]
- 14.McNee AE, Shortland AP, Eve LC, Robinson RO, Gough M. Lower limb extensor moments in children with spastic diplegic cerebral palsy. Gait Posture. 2004 Oct;20(2):171–176. doi: 10.1016/j.gaitpost.2003.08.009. [DOI] [PubMed] [Google Scholar]
- 15.Banala SK, Kim SH, Agrawal SK, Scholz JP. Robot assisted gait training with active leg exoskeleton (ALEX) IEEE Trans Neural Syst Rehabil Eng. 2009 Feb;17(1):2–8. doi: 10.1109/TNSRE.2008.2008280. [DOI] [PubMed] [Google Scholar]
- 16.Duschau-Wicke A, von Zitzewitz J, Caprez A, Lunenburger L, Riener R. Path control: A method for patient-cooperative robot-aided gait rehabilitation. IEEE Trans Neural Syst Rehabil Eng. 2010 Feb;18(1):38–48. doi: 10.1109/TNSRE.2009.2033061. [DOI] [PubMed] [Google Scholar]
- 17.Jezernik S, Colombo G, Keller T, Frueh H, Morari M. Robotic orthosis Lokomat: A rehabilitation and research tool. Neuromodulation: Technol Neural Interface. 2003 Apr;6(2):108–115. doi: 10.1046/j.1525-1403.2003.03017.x. [DOI] [PubMed] [Google Scholar]
- 18.Hayashi T, Kawamoto H, Sankai Y. Control method of robot suit HAL working as operator’s muscle using biological and dynamical information. Proc IEEE/RSJ Int Conf Intell Robots Syst. 2005;2(1):3063–3068. [Google Scholar]
- 19.Fleischer C, Hommel G. A human-exoskeleton interface utilizing electromyography. IEEE Trans Robot. 2008 Aug;24(4):872–882. [Google Scholar]
- 20.Sawicki GS, Ferris DP. A pneumatically powered knee-ankle-foot orthosis (KAFO) with myoelectric activation and inhibition. J Neuroeng Rehabil. 2009 Jan;6(23) doi: 10.1186/1743-0003-6-23. [DOI] [PMC free article] [PubMed] [Google Scholar]
- 21.Kiguchi K, Imada Y. EMG-based control for lower-limb power-assist exoskeletons. Proc. IEEE Workshop Robot. Intell. Informationally Struct. Space; 2009. pp. 19–24. [Google Scholar]
- 22.Merletti R, Parker PA. Electromyography: Physology, Engineering, and Noninvasive Applications. Hoboken, NJ: Wiley-IEEE; 2004. [Google Scholar]
- 23.White SC, Winter DA. Predicting muscle forces in gait from EMG signals and musculotendon kinematics. J Electromyography Kinesiology. 1993 Jan;2(4):217–231. doi: 10.1016/1050-6411(92)90025-E. [DOI] [PubMed] [Google Scholar]
- 24.Lloyd DG, Besier TF. An EMG-driven musculoskeletal model to estimate muscle forces and knee joint moments in vivo. J Biomech. 2003 Jun;36(6):765–776. doi: 10.1016/s0021-9290(03)00010-1. [DOI] [PubMed] [Google Scholar]
- 25.Arnold AS, Anderson FC, Pandy MG, Delp SL. Muscular contributions to hip and knee extension during the single limb stance phase of normal gait: A framework for investigating the causes of crouch gait. J Biomech. 2005;38:2181–2189. doi: 10.1016/j.jbiomech.2004.09.036. [DOI] [PubMed] [Google Scholar]
- 26.Sartori M, Reggiani M, Mezzato C, Pagello E. A lower limb EMG-driven biomechanical model for applications in rehabilitation robotics; Proc 14th Int Conf Adv Robot; 2009. pp. 1–7. [Google Scholar]
- 27.Goldberg EJ, Requejo PS, Fowler EG. Joint moment contributions to swing knee extension acceleration during gait in individuals with spastic diplegic cerebral palsy. Gait Posture. 2011 Oct;33(1):66–70. doi: 10.1016/j.gaitpost.2010.09.026. [DOI] [PubMed] [Google Scholar]
- 28.Steele KM, Seth A, Hicks JL, Schwartz MS, Delp SL. Muscle contributions to support and progression during single-limb stance in crouch gait. J Biomech. 2010;43(11):2099–2105. doi: 10.1016/j.jbiomech.2010.04.003. [DOI] [PMC free article] [PubMed] [Google Scholar]
- 29.Reinbolt JA, Fox MD, Arnold AS, Ounpuu S, Delp SL. Importance of preswing rectus femoris activity in stiff-knee gait. J Biomech. 2008;41:2362–2369. doi: 10.1016/j.jbiomech.2008.05.030. [DOI] [PMC free article] [PubMed] [Google Scholar]
- 30.Hicks JL, Schwartz MH, Arnold AS, Delp SL. Crouched postures reduce the capacity of muscles to extend the hip and knee during the single-limb stance phase of gait. J Biomech. 2008;41:960–967. doi: 10.1016/j.jbiomech.2008.01.002. [DOI] [PMC free article] [PubMed] [Google Scholar]
- 31.Sepulveda F, Wells DM, Vaughan CL. A neural network representation of electromyography and joint dynamics in human gait. J Biomech. 1993;26(2):101–109. doi: 10.1016/0021-9290(93)90041-c. [DOI] [PubMed] [Google Scholar]
- 32.Hahn ME. Feasibility of estimating isokinetic knee torque using a neural network model. J Biomech. 2007 Jan;40(5):1107–1114. doi: 10.1016/j.jbiomech.2006.04.014. [DOI] [PubMed] [Google Scholar]
- 33.Amarantini D, Martin L. A method to combine numerical optimization and EMG data for the estimation of joint moments under dynamic conditions. J Biomech. 2004 Sep;37(9):1393–404. doi: 10.1016/j.jbiomech.2003.12.020. [DOI] [PubMed] [Google Scholar]
- 34.Kellis E, Katis A. Hamstring antagonist moment estimation using clinically applicable models: Muscle dependency and synergy effects. J Electromyography Kinesiology. 2008 Feb;18(1):144–153. doi: 10.1016/j.jelekin.2006.09.001. [DOI] [PubMed] [Google Scholar]
- 35.Aagaard P, Simonsen EB, Andersen JL, Magnusson SP, Bojsen-Møller F, Dyhre-Poulsen P. Antagonist muscle coactivation during isokinetic knee extension. Scandinavian J Med Sci Sports. 2000 Apr;10(2):58–67. doi: 10.1034/j.1600-0838.2000.010002058.x. [DOI] [PubMed] [Google Scholar]
- 36.Kellis E, Kouvelioti V, Ioakimidis P. Reliability of a practicable EMG-moment model for antagonist moment prediction. Neurosci Lett. 2005 Aug;383(3):266–271. doi: 10.1016/j.neulet.2005.04.038. [DOI] [PubMed] [Google Scholar]
- 37.Ikeda AJ, Abel MF, Granata KP, Damiano DL. Quantification of cocontraction in spastic cerebral palsy. Electromyography Clin Neurophysiol. 1998;38(8):497–504. [PubMed] [Google Scholar]
- 38.Bell AL, Pedersen DR, Brand RA. A comparison of the accuracy of several hip center location prediction methods. J Biomech. 1990;23(6):617–621. doi: 10.1016/0021-9290(90)90054-7. [DOI] [PubMed] [Google Scholar]
- 39.Payton CJ, Bartlett RM. Biomechanical Evaluation of Movement in Sport and Exercise. Oxon, U.K: Routledge; 2008. [Google Scholar]
- 40.Zecca M, Micera S, Carrozza MC, Dario P. Control of multi-functional prosthetic hands by processing the electromyographic signal. Crit Rev Biomed Eng. 2002 Jan;30(4–6):459–485. doi: 10.1615/critrevbiomedeng.v30.i456.80. [DOI] [PubMed] [Google Scholar]
- 41.Youn W, Kim J. Estimation of elbow flexion force during isometric muscle contraction from mechanomyography and electromyography. Med Biol Eng Comput. 2010 Nov;48(11):1149–1157. doi: 10.1007/s11517-010-0641-y. [DOI] [PubMed] [Google Scholar]
- 42.Tedroff K, Knutson LM, Soderberg GL. Co-activity during maximum voluntary contraction: A study of four lower-extremity muscles in children with and without cerebral palsy. Develop Med Child Neurol. 2008 May;50(5):377–381. doi: 10.1111/j.1469-8749.2008.02055.x. [DOI] [PubMed] [Google Scholar]
- 43.Lieber RL. Skeletal Muscle Structure, Function, and Plasticity: The Physiological Basis of Rehabilitation. 3. Baltimore, MD: Lippincott Williams & Wilkins; 2009. [Google Scholar]


