Abstract
We have developed a vector Doppler ultrasound imaging method to directly quantify the magnitude and direction of muscle and tendon velocities during movement. The goal of this study was to evaluate the feasibility of using vector Tissue Doppler Imaging (vTDI) for estimating the tibialis anterior tendon velocities during dorsiflexion in children with cerebral palsy who have foot drop. Our preliminary results from this study show that tendon velocities estimated using vTDI have a strong linear correlation with the joint angular velocity estimated using a conventional 3D motion capture system. We observed a peak tendon velocity of 5.66±1.45 cm/s during dorsiflexion and a peak velocity of 8.83±2.13 cm/s during the passive relaxation phase of movement. We also obtained repeatable results from the same subject 3 weeks apart. Direct measurements of muscle and tendon velocities may be used as clinical outcome measures and for studying efficiency of movement control.
Keywords: Ultrasonography, vector Doppler, tissue motion, tendon motion, musculoskeletal imaging, signal processing
I. Introduction
Quantitative methods for direct measurements of muscle and tendon kinematics may lead to improved clinical outcome measures for neuromuscular and movement disorders, such as cerebral palsy (CP). Traditionally, joint kinematics, dynamometry and electromyographic data have been used as clinical outcome measures. In recent years, ultrasound imaging (US) has become an important tool for direct assessment of length, shape and deformation of muscles and tendons. Studies using ultrasound have investigated the functional changes in length and shape of tendons during motion [1][2]. Currently only a limited number of validated methods exist for estimating muscle and tendon motion using ultrasound. Most methods rely on identification of landmarks in B-mode image sequences, although other methods based on speckle tracking [3], elastography [4] or color Doppler [5] have been proposed. Each of these methods has limitations in terms of quantitative accuracy of motion tracking.
For quantitative motion estimation, spectral Doppler ultrasound has traditionally been considered the method of choice in cardiovascular applications. However, spectral Doppler has limited utility in musculoskeletal applications because muscle and tendon motion tends to occur in a direction perpendicular to the ultrasound beam (parallel to the skin surface), whereas conventional spectral Doppler estimates velocities along the ultrasound beam. To overcome this problem, our research group is investigating the use of vector Doppler ultrasound for measuring muscle and tendon contraction velocities.
Vector Doppler ultrasound estimates tissue motion in two or more independent directions using multiple transmitters and receivers oriented in different directions. The vector Doppler method combines the multiple velocity estimates producing a velocity vector with magnitude and direction [6]. Thus, vector Doppler can be used to estimate muscle and tendon velocities even if the motion occurs parallel to the skin surface. Since this method relies on spectral Doppler, it provides accurate quantitative estimates of tissue velocity, has higher temporal resolution over the speckle tracking method and does not rely on the visualization and tracking of anatomical landmarks in B-mode images.
We have developed a vector Doppler system based on clinical ultrasound scanner with a research interface. This system has the ability to perform experiments in a clinical setting with simultaneous 3D joint motion capture. In preliminary studies, we have characterized the accuracy of this vector Doppler system [7] and also shown the feasibility of measuring muscle contraction velocities in vivo [8]. The goal of this paper is to investigate the feasibility of using vector Doppler velocity estimates as a reliable clinical outcome measure. Using vector Doppler, we evaluated the tibialis anterior tendon contraction velocities during ankle dorsiflexion in children with CP who have foot drop, or inadequate ankle dorsiflexion during the swing phase of gait. The measurements were compared with conventional joint kinematics estimated using an infrared (IR) 3D motion capture system.
II. Methods AND Materials
A. Vector Tissue Doppler Imaging
Vector tissue Doppler imaging (TDI), used to measure tendon velocities, was implemented on a Ultrasonix Sonix Touch® US system (Richmond, BC, Canada) with a 5–14 MHz linear array transducer, consisting of 128 elements and with a 60 mm field of view. Vector TDI is based on estimating the velocity vector from measurements taken from two or more independent directions. The Sonix Touch® system allows low level beamforming and pulse sequence control through a software development kit called Texo. This interface was employed to split the array transducer into two transmit apertures and two receive apertures and steer the receive beams. The transmit & receive beams were steered by 150 with respect to the normal and the transmit beam was focused in the region of interest (center of the tendon). Transmit and receive apertures were set to 32 elements. The magnitude of the resultant velocity vector can then be obtained from the individual velocity components as described previously [6][9]:
| (1) |
where β is the beam steering angle, f1 and f2 are the two received frequency components and ft is the transmit frequency.
B. Beam Profile Experiments
A calibrated beam profile & slice thickness phantom 538N (ATS laboratories, CT, USA) was used to characterize the receive beam patterns and the beam overlap region. The ultrasound transducer was then placed perpendicular to a plane of scatterers and held in position using a clamp. A series of experiments were performed by changing parameters like beam steering angle, depth of focus and the vector Doppler geometry (1 transmit, 2 receive or 2 transmit, 2 receive). The beam steering angle was varied from 150 to 300 holding the transmit focus depth and the vector Doppler geometry constant. Similarly, the transmit focus depth and the vector Doppler geometry were varied holding the other two parameters constant.
C. Participants
This study was done at the Functional & Applied Biomechanics Section in the Rehabilitation Medicine Department of the National Institutes of Health, Clinical Center. Children with spastic cerebral palsy (CP) who could ambulate independently with no assistive device (Gross Motor Function Classification Scale level I & II) were evaluated. Those with a foot drop pattern identified by a physiatrist through clinical observation were eligible for the study. The exclusion criteria were administration of botulinum toxin to the gastrocnemius and soleus muscle groups within the past four months or during the study or surgery to the legs in the past year. The NICHD Institutional Review Board approved this study and all subjects and their caregivers provided informed consent and assent of a minor, respectively, to participate in this study.
D. Data Acquisition Procedures
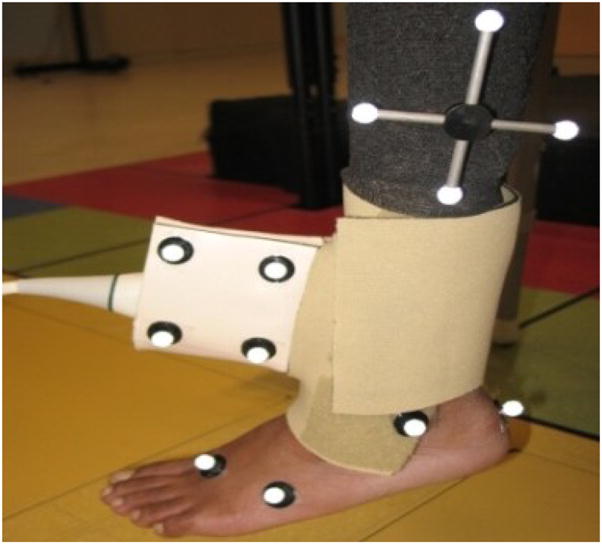
All subjects were asked to sit comfortably in an upright position on a tall chair such that their feet did not touch the ground. To ensure good signal coupling, hypoallergenic transmission gel (Aquasonic 100, Parker laboratories, NJ) was applied on the skin surface at the ankle and a 2×9 cm stand-off pad (Aquasonic 100, Parker laboratories, NJ) was also used to avoid near field effects. The stand-off pad was held in place using polyvinylidene chloride (PVDC) wrap. A custom built US transducer holder made from gypsum plaster and a Neoprene cuff was used to stabilize the US transducer to the ankle (Fig. 1) while allowing full ankle dorsiflexion. B-mode imaging was used to ensure that the center of the tibialis anterior tendon was located at the center of the expected beam overlap region. Subjects were asked to perform repeated ankle dorsiflexion and relaxation while data were being collected.
Fig 1.

The experimental setup for measuring tibialis anterior tendon velocities. The ultrasound probe was held in place using a custom holder and a Neoprene cuff, and reflective markers were placed on the probe and on anatomical landmarks.
A Vicon 612 (Lake Forest, CA, USA) motion capture system was used to quantitatively measure ankle joint motion. A subject specific model was created using this motion capture system. Ten Infrared (IR) cameras were used to capture the motion of reflective markers placed at specific locations on the foot, ankle and lower leg (shank).
E. Ultrasound Signal Processing
The ultrasound data acquired at 5-MHz transmit frequency were digitized at 40 MHz and processed offline using MATLAB (Mathworks, Inc., Natick, MA). A broadband velocity estimator based on the 2D Fourier transform was used for velocity estimation [10]. The raw RF signals from the two receive apertures were converted to analytical signals using the Hilbert transform. The signals from the two apertures were mixed to generate the sum and difference frequency components corresponding to axial and lateral components of the motion (Eq. (1)). The 2D Fourier transforms of these mixed signals were then computed to estimate variations of Doppler frequency with RF. The Doppler spectra were estimated from projections of the 2D Fourier transform. The lateral velocity spectra, corresponding to the difference frequency, were obtained from a projection centered at zero frequency on the RF axis, while the axial velocity spectra, corresponding to the sum frequency, were obtained from a projection centered at twice the transmit frequency on the RF axis. Stationary and low-frequency clutter were removed using a 20-Hz high pass clutter filter. The mean and standard deviation of the Doppler spectrum were computed, and the envelope of the Doppler spectrum was estimated as the mean plus one standard deviation, with a correction for the variance of the analysis window. This envelope of the Doppler spectrum was used as the estimate of axial and lateral velocity components.
F. Motion Capture Data Processing
Post processing of the raw data was done using Visual3D (C-Motion, Inc., MD). A bi-directional Butterworth low pass filter with a cut-off of 6Hz was used to remove any high frequency components produced due to vibration of the markers during motion of the ankle. The ankle angle time series waveforms were differentiated to obtain absolute joint angular velocity. The data were lowpass filtered at 5 Hz before calculating the velocity to remove transient noise.
G. Statistical Analysis
Absolute velocity waveforms were obtained from the TDI using Eq.(1). Joint velocity waveforms were estimated from the displacement values of the ankle obtained using the motion capture systems. Linear regression analysis was used to compare the velocity values obtained using vector TDI and the velocity values obtained using motion capture systems. The R2 and the error variance values of the regression line fit between the tendon velocities obtained using vector TDI and the velocity values obtained using motion capture system were computed for each trial.
III. Results
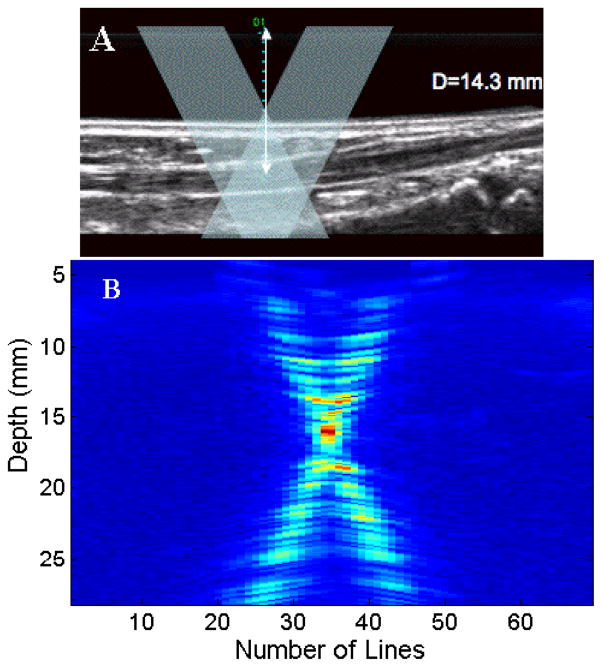
Figure 2(A) shows a B-mode image of the tibialis anterior tendon at a depth of 14.3 mm from the transducer. The overlay shows the expected ultrasound transmit and receive beams from the two separate apertures interrogating the tendon. Figure 2(B) shows the vector Doppler beams measured using the beam profile phantom. The beam overlap region appears to be centered at depth of 15 mm. The beam profile data were acquired by scanning the transmit and receive apertures through 128 elements sequentially. Alternate scanlines were acquired from the left and right apertures, respectively. The reflective plane in the beam profile phantom was placed at the 64th element of the transducer.
Fig 2.
(A). B-mode image showing the tibialis anterior tendon visualized at a depth of 14.3 mm. The overlay denotes a schematic of the two ultrasound beams used for vector Doppler imaging. (B) Measured beam overlap pattern of the vector Doppler configuration with the overlap region centered at a depth of 15mm. Two transmit beams and two receive beams were used with a 150 beam steering angle.
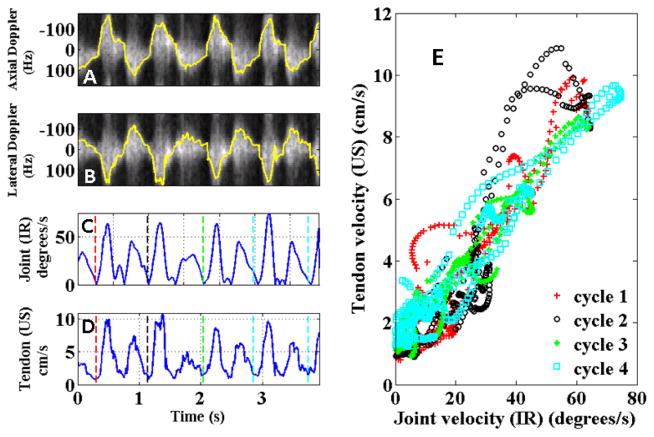
Figure 3 shows the correlations between the ultrasound and 3D motion capture measurements for one subject over multiple cycles of dorsiflexion and relaxation. Each cycle shows a distinct velocity peak corresponding to dorsiflexion and a higher velocity peak corresponding to the passive relaxation phase of the movement.
Fig 3.
Correlation between velocity waveforms measured using ultrasound and motion capture system. Four cycles of dorsiflexion and relaxation are shown. A & B display the axial and lateral spectrograms overlaid in yellow with the estimated velocities. (C) Joint velocity in degrees/s from motion capture system. (D) Absolute tendon velocity using vector Doppler. (E) Correlation between velocity waveforms for all trials obtained from vector Doppler and motion capture systems.
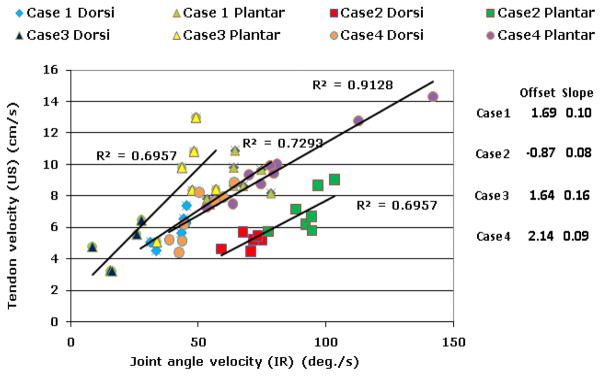
Estimated absolute velocities from vector Doppler showed strong correlation with the estimated absolute velocities from the 3D motion capture system as shown in Fig. 3(E) and Fig. 4. As expected, a linear relationship was observed between the joint velocity and the tendon velocity. Table 1 summarizes the R2 values obtained over all the trials. The values over all trials are comparable with all 30 trials showing strong correlations, with peak velocity of 5.66±1.45 cm/s during dorsiflexion and peak velocity of 8.83±2.13 cm/s during passive relaxation.
Fig 4.

Correlation between the peak velocities measured using ultrasound and 3D motion capture. For each subject, a linear relationship with strong correlation was observed between peak velocities for dorsiflexion and relaxation. Relaxation velocities were significantly higher than dorsiflexion velocities. Case 1 and Case 4 are the same subject studied 3 weeks apart.
Table 1.
Summary of R2 values between vector TDI and motion capture systems using linear regression.
| Case | Trial | R2 |
|---|---|---|
| 1 | 1 | 0.77 |
| 2 | 0.80 | |
| 3 | 0.77 | |
| 4 | 0.90 | |
| 5 | 0.84 | |
| 6 | 0.83 | |
| 7 | 0.94 | |
| 8 | 0.93 | |
| 2 | 1 | 0.87 |
| 2 | 0.79 | |
| 3 | 0.63 | |
| 4 | 0.76 | |
| 5 | 0.77 | |
| 6 | 0.75 | |
| 7 | 0.90 | |
| 3 | 1 | 0.64 |
| 2 | 0.84 | |
| 3 | 0.78 | |
| 4 | 0.71 | |
| 5 | 0.80 | |
| 6 | 0.75 | |
| 4 | 1 | 0.88 |
| 2 | 0.75 | |
| 3 | 0.83 | |
| 4 | 0.85 | |
| 5 | 0.82 | |
| 6 | 0.85 | |
| 7 | 0.91 | |
| 8 | 0.71 | |
| 9 | 0.75 |
IV. DISCUSSION
In this study, we investigated a vector TDI method to directly measure the velocity of the anterior tibilalis tendon during voluntary ankle dorsiflexion. As expected in patients with foot drop, we observed the peak tendon velocity during dorsiflexion was lower than during passive relaxation.
While the tendon velocities are expected to correlate with joint angle velocities, it is conceivable that in subjects with impaired movement, we would see differences between these two measures, which would indicate inefficiencies in movement control. Case 1 and case 4 were the same subject, but were studied 3 weeks apart. The slope of the trend line from linear regression analysis between tendon velocities and joint angle velocities in case 1 & case 4 were comparable, due the similar radius of motion of the subject. This shows that the velocity estimates obtained using vector Doppler are repeatable. We are continuing our studies in a population of subjects with foot drop before and after treatment using a device that delivers surface electrical stimulation to the common peroneal nerve, triggered by tilt sensors on the lower leg, to initiate and maintain ankle dorsiflexion during the swing phase of gait for those with inadequate strength or control to accomplish this effectively.
The vector Doppler method overcomes several issues encountered with traditional spectral Doppler, which can only estimate motion only along the axis of the beam. The vTDI approach for estimating the tissue velocities could lead to better assessment of the magnitude and direction of tissue motion.
Some limitations of this study must be acknowledged. Although, Doppler methods are widely used in clinic for measuring velocities, various factors affect the accuracy of the measurements. The Doppler signal undergoes spectral broadening due the geometry of the vector Doppler system as well as during acceleration and deceleration. This increases the variance of the Doppler signal estimated using narrowband spectral estimators or autocorrelation-based estimators. We performed broadband estimation using the 2D Fourier transform to reduce the spectral variance. Additional signal processing strategies can further reduce the variance of the estimates. The location of the beam overlap region relative to the location of the tendon is another consideration. In our experiments, we scanned through a large region of interest by electronically controlling the transmit and receive apertures. This enabled us to reconstruct anatomical images from each receiver to confirm the location of the tendon. The ability to perform simultaneous imaging is a significant advantage of performing vector Doppler using an array transducer. Another potential source of variation is the relative motion between the transducer and the shank during dorsiflexion and plantarflexion. In our experimental setup we used a custom holder and a neoprene cuff to stabilize the position of the transducer. In our future studies, we will track the motion of the transducer relative to the shank using the 3D motion capture system.
In summary, we have demonstrated that vector TDI is a feasible method for measuring tendon velocities in vivo using inexpensive equipment suitable for a clinical setting. We have also demonstrated that this technique can produce repeatable velocity estimates. Direct measurements of muscle and tendon velocities may be used as clinical outcome measures and for studying efficiency of movement control.
Contributor Information
Avinash Eranki, Department of Electrical and Computer Engineering, George Mason University, Fairfax, VA, USA 22030.
Lindsey Bellini, Functional and Applied Biomechanics Section, Rehabilitation Medicine Department, National Institutes of Health, Bethesda, MD, USA 20892.
Laura Prosser, Functional and Applied Biomechanics Section, Rehabilitation Medicine Department, National Institutes of Health, Bethesda, MD, USA 20892.
Christopher Stanley, Functional and Applied Biomechanics Section, Rehabilitation Medicine Department, National Institutes of Health, Bethesda, MD, USA 20892.
Daniel Bland, Functional and Applied Biomechanics Section, Rehabilitation Medicine Department, National Institutes of Health, Bethesda, MD, USA 20892.
Katharine Alter, Functional and Applied Biomechanics Section, Rehabilitation Medicine Department, National Institutes of Health, Bethesda, MD, USA 20892.
Diane Damiano, Functional and Applied Biomechanics Section, Rehabilitation Medicine Department, National Institutes of Health, Bethesda, MD, USA 20892.
Siddhartha Sikdar, Department of Electrical and Computer Engineering, George Mason University, Fairfax, VA, USA 22030.
References
- 1.Herbert RD, et al. Change in length of relaxed muscle fascicles and tendons with knee and ankle movement in humans. J Physiol. 2000;539:637–645. doi: 10.1113/jphysiol.2001.012756. [DOI] [PMC free article] [PubMed] [Google Scholar]
- 2.Maganaris CN, Paul JP. Tensile properties of the in vivo human gastrocnemius tendon. J Biomech. 2002;12:1639–1646. doi: 10.1016/s0021-9290(02)00240-3. [DOI] [PubMed] [Google Scholar]
- 3.Korstanje JWH, et al. Development and validation of ultrasound speckle tracking to quantify tendon displacement. J Biomech. 2010 doi: 10.1016/j.jbiomech.2010.01.001. (in press) [DOI] [PubMed] [Google Scholar]
- 4.Farron J, Varghese T. Measurement of tendon strain during muscle twitch contractions using ultrasound elastography. IEEE Trans Ultrasonics, Ferroelect Freq Contr. 2009;56:27–35. doi: 10.1109/TUFFC.2009.1002. [DOI] [PMC free article] [PubMed] [Google Scholar]
- 5.Cigali BS, et al. Measurement of tendon excursion velocity with colour Doppler imaging: a preliminary study on flexor pollicis longus muscle. European J Radiology. 1996;23:217–221. doi: 10.1016/s0720-048x(96)00767-x. [DOI] [PubMed] [Google Scholar]
- 6.Dunmire B, et al. Cross beam vector Doppler ultrasound for angle-independent velocity measurements. Ultrasound Med Biol. 2000;26:1213–1235. doi: 10.1016/s0301-5629(00)00287-8. [DOI] [PubMed] [Google Scholar]
- 7.Eranki A, Sikdar S. Experimental characterization of a vector Doppler system based on a clinical ultrasound scanner. Conf Proc IEEE in Med & Biol. 2009:2260–2263. doi: 10.1109/IEMBS.2009.5334972. [DOI] [PubMed] [Google Scholar]
- 8.Sikdar S, Lebiedowska M, Eranki A, Garmirian L, Damiano D. Measurement of rectus femoris muscle velocities during patellar tendon jerk using vector tissue Doppler imaging. Conf Proc IEEE in Med & Biol. 2009:2963–2966. doi: 10.1109/IEMBS.2009.5332500. [DOI] [PMC free article] [PubMed] [Google Scholar]
- 9.Pastorelli A, Torricelli G, Scabia M, Biagi E, Masotti L. A real-time 2-D vector Doppler system for clinical experimentation. IEEE Trans Med Imag. 2008;27:1515–1524. doi: 10.1109/TMI.2008.927337. [DOI] [PubMed] [Google Scholar]
- 10.Loupas T, Gill RW. Multifrequency Doppler: improving the quality of spectral estimation by making full use of the information present in the backscattered RF echoes. IEEE Trans Ultrasonics, Ferroelect Freq Contr. 1994;41:522–531. [Google Scholar]


