

Abstract
The Ultimatum Game (UG) is a widely used and well-studied laboratory model of economic decision-making. Here, we studied 129 healthy adults and compared demographic (i.e., age, gender, education), cognitive (i.e., intelligence, attention/working memory, speed, language, visuospatial, memory, executive functions), and personality (i.e., “Big Five”, positive affect, negative affect) variables between those with a “rational” versus an “irrational” response pattern on the UG. Our data indicated that participants with “rational” UG performance (accepting any offer, no matter the fairness) endorsed higher levels of trust, or the belief in the sincerity and good intentions of others, while participants with “irrational” UG performance (rejecting unfair offers) endorsed higher levels of negative affect, such as anger and contempt. These personality variables were the only ones that differentiated the two response patterns—demographic and cognitive factors did not differ between rational and irrational players. The results indicate that the examination of personality and affect is crucial to our understanding of the individual differences that underlie decision-making.
Keywords: trustworthiness, negative affect, decision making, Ultimatum Game
The Ultimatum Game (UG) is a widely used and well-studied laboratory model of economic decision-making. Although elegantly uncomplicated in its design, performance on the UG has been associated with more complex real-world economic behavior (Grace and Kemp, 2005; Oosterbeek, Sloof, & van de Kuilen, 2004). In a typical instantiation, two players are given the opportunity to split a sum of money. One player (the proposer) offers a portion of the money to the second player (the responder). The responder can either accept the offer (in which case both players split the money as proposed) or reject the offer (in which case both players get nothing).
“Rational actor” models predict that the responder should accept the offer, no matter how low, since any amount of money is better than no money. However, relatively small offers (20 to 30% of the total, or less) have about a 50% chance of being rejected (Bolton & Zwick, 1995; Camerer & Thaler, 1995; Guth, Schmittberger, & Schwarze, 1982). This “irrational” behavior is disadvantageous because the player ends up with less money overall from the game; in other words, it is better to accept “unfair treatment” (low offers) in the interest of winning more money. Game theorists, experimental economists, and neuroscientists have been intrigued by the “irrational” decision to reject small offers (Koenigs & Tranel, 2007; Krajbich, Adolphs, Tranel, Denburg, & Camerer, 2009; Lee, 2008; Sanfey, Rilling, Aronson, Nystrom, & Cohen, 2003). The purpose of the present study was to explore whether and how “rational” and “irrational” responders in the UG differ with regard to demographic, cognitive, and personality variables. We begin with a review of the literature as to how these factors might impact UG performance.
Demographic Factors
A few studies have examined the impact of age on UG performance. The most comprehensive study, by Sutter and Kocher (2007), examined age effects on UG performance in a large (N = 662) sample of children, young adults, and older adults. The authors observed behavioral differences between childhood and early adulthood, indicating a linear increase in acceptance rates (i.e., more “rational” behavior) with age. By contrast, the two adult age groups – young working professionals and older adults – were virtually indistinguishable in their UG performance. Regarding the impact of gender on UG performance, previous findings are inconclusive. Solnick (2001) observed higher rates of “irrational” rejections by women, whereas Eckel and Grossman (2001) observed more frequent “irrational” rejections by men.
Cognitive Factors
The impact of cognitive ability on UG performance has been sparsely addressed in the literature, and what is known is limited to the examination of intellect (or “IQ”) among UG proposers. Ben-Ner and colleagues (2004a,b) used the Wonderlic Personnel Test (as a proxy for IQ) and studied its relationship to UG performance in 224 undergraduate students. Women with lower IQ scores were more generous in the role of UG proposer (Ben-Ner, Kong, & Putterman, 2004a). However, when investigating whether individuals would reciprocate “generosity” shown from other proposers, IQ was not predictive of reciprocity outcomes (Ben-Ner, Putterman, Kong, & Magan, 2004b). To date no study has systematically investigated the relationship between cognitive abilities and UG responder behavior.
Personality Factors
Individual differences in personality are the most well investigated potential contributor to economic decision-making. In a study involving 69 undergraduate students, Scheres and Sanfey (2006) investigated UG performance and self-reported motivational behavior. They found that higher self-reported reward sensitivity (which is similar to “extraversion”) was associated with lower proposer offers on the UG (and thus the attempt to maximize profit). However, the study did not assess individual differences in the acceptance or rejection of ultimatum offers. In another study, Brandstatter and Konigstein (2001) assessed personality influences on economic behavior in 98 undergraduate economic students. The participants completed an adjective checklist and the UG. They found that participants who were characterized as emotionally unstable and extraverted, or emotionally stable and introverted, were more likely to reject UG offers. These findings were interpreted as an act of negative reciprocity (that is, an action that has a negative effect upon someone else is reciprocated with an action that has approximately equal negative effect upon another).
Several studies have explored the potential neural mechanisms behind UG performance. Sanfey and colleagues (2003) investigated brain activation during the UG via functional magnetic resonance imaging (fMRI). Unfair offers elicited activity in brain areas related to emotion (anterior insula) and working memory (dorsolateral prefrontal cortex). The authors opined that activation in the anterior insula reflected the responder’s negative emotional response to unfair offers, while activation in the dorsolateral prefrontal cortex (DLPFC) may be related to higher cognitive demands to overcome a strong emotional tendency to reject the offer (although activation in this area did not correlate with acceptance rates). A later study also found evidence for involvement of DLPFC during the UG. Knoch et al. (2006) used transcranial magnetic stimulation (TMS) and observed that disruption to the right (but not the left) DLPFC led to lowered rejection of unfair offers in the UG (Knoch, Pascual-Leone, Meyer, Treyer, & Fehr, 2006). Other work, specifically with neurological patients, has demonstrated that the regulation of emotion is important for the “rational” acceptance of unfair offers in the UG, as patients with emotional dysregulation caused by damage to ventromedial prefrontal cortex (VMPC) displayed exaggerated rejection of unfair offers (Koenigs & Tranel, 2007). Interestingly, reducing central serotonin function in healthy individuals, via tryptophan depletion, led to an increased rate of rejection of unfair UG offers (Crockett, Clark, Tabibnia, Lieberman, & Robbins, 2008). Given that serotonin receptors are abundant in the forebrain, this latter finding is further evidence for the importance of prefrontal cortex in UG performance.
The present study is an exploratory analysis on whether and how “rational” and “irrational” UG responders differ with regard to demographic (i.e., age, gender, education), cognitive (i.e., intelligence, attention/working memory, speed, language, visuospatial, memory, executive functions), and personality (i.e., “Big Five”, positive affect, negative affect) variables in a large lifespan sample of healthy adults. Only a few studies have investigated these factors, and to our knowledge, none have comprehensively examined all three domains in the same sample of participants.
Methods
Participants
A sample of 129 adults was recruited from the community, with a median age of 65.0 years (range [26–88]), a mean education of 16.0 years (SD = 2.62; range [11–20]), and 57% females. A comprehensive clinical interview determined that all persons enrolled in the study were neurologically healthy and free of significant psychiatric disease. Participants were deemed healthy through this semi-structured screening interview that assessed their medical status (e.g., major surgeries, illnesses, and hospitalizations), medications that might impact cognitive functioning (e.g., cardiovascular or psychotropic medications), alcohol or drug consumption, and mood (e.g., symptoms of depression).
Measures and Procedures
Participants were tested individually in a quiet laboratory room, each taking approximately 4 hours to complete the following tasks and the aforementioned clinical interview. Participants were administered all neuropsychological measures and completed the NEO Five-Factor Inventory and the Positive and Negative Affect Schedule – Expanded Form prior to the UG. All participants were financially compensated for their involvement.
Ultimatum Game (UG)
In the Ultimatum Game (adapted from Koenigs & Tranel, 2007), the participants acted as responders in a series of 22 offers, presented in a fixed order. In each trial, the participant first saw a picture of the person making the Ultimatum offer (a take-it-or-leave-it split of $10) with the individual’s name. Next, the participant saw the offer (e.g., “Julie gets $9, you get $1”). Then, the participant saw “Accept or Reject?” on the screen. The participant had unlimited time to consider the offer and push a key (Y to “accept” or N to “reject”) to respond. Lastly, the participant saw the outcome based on his/her response (e.g., “You both get $0” if the offer was rejected or “You get $1” if the offer was accepted). (See Figure 1 for a graphical representation of the trial design.)
Figure 1. Schematic of Trial Design.
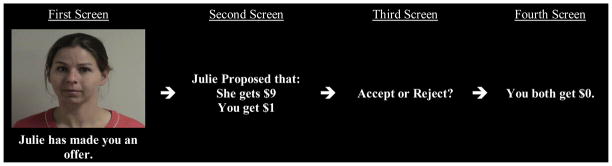
Note. Schematic of trial design. First screen, Proposer name/picture: 4 s. Second screen, Offer: 4 s. Third screen, Participant decision: indefinite. Fourth screen, Outcome: 3 s. In this example, the offer was rejected.
Participants received 22 offers from 22 different proposers.1 Before beginning, the participants were instructed about the contingencies of an “Accept” or “Reject” response, that the offers were real but prepared before their arrival, and that both the participant and the proposer would be paid according to the participant’s decisions. In actual fact, the 22-pictured “proposers” were confederates of the experimenter, and the experimenter predetermined the offers. Participants were informed that they would interact with each proposer once and be paid according to their decisions. In compliance with the University of Iowa Institutional Review Board, all participants were remunerated the same amount, regardless of their responses on the task. At the end of the testing session, participants underwent debriefing to explain this human subjects requirement.
Since the participants’ responses to “unfair” offers were of the greatest interest, offers were generated at the following frequencies: two offers of $5 (proposer keeps $5), two offers of $4 (proposer keeps $6), six offers of $3 (proposer keeps $7), six offers of $2 (proposer keeps $8), and six offers of $1 (proposer keeps $9). The $5 and $4 offers were considered “fair,” and the $3, $2, and $1 offers were considered “unfair,” based on previous work (e.g., Guth et al., 1982; Koenigs et al., 2010; Koenigs & Tranel, 2007). In these studies, it was found that 35% of the total sum and greater (corresponding to the $4 and $5 offers in the present study) were almost always accepted, whereas lesser offers (corresponding to the $3, $2, and $1 offers) were rejected a significant proportion of the time.
Cognitive Battery
Each participant completed a thorough cognitive battery of approximately three hours duration. The battery was designed to measure a broad range of neuropsychological abilities.
Intelligence
Intelligence was measured using the four-subtest Wechsler Abbreviated Scale of Intelligence (WASI; Wechsler, 1999) to obtain a Full Scale Intelligence Quotient (FSIQ) score. Premorbid intellect was measured using the Wide Range Achievement Test – III Reading subtest (WRAT-III; Wilkinson, 1993), a single-world reading task.
Attention and Working Memory
Both simple and divided attention (also referred to as working memory) was measured using the combination of the Digit Span, Letter-Number Sequencing, and Arithmetic subtests from the Wechsler Adult Intelligence Scale – Third Edition (WAIS-III; Wechsler, 1997). In the Digit Span subtest, participants are asked to repeat strings of numbers in both forward and backward order. For the Letter-Number Sequencing subtest, participants must recite back a string of numbers and letters after putting them in numerical and alphabetical order. Participants mentally solve arithmetic problems for the Arithmetic subtest.
Psychomotor Speed
In the Trail Making Test, part A (Trail Making A; Spreen & Strauss, 1998), participants are asked to connect dots in numerical order as quickly as they can.
Language
The Controlled Oral Word Association Test (COWAT; Benton & Hamsher, 1989) is a verbal fluency measure, in which participants are given one minute to say as many words as they can that begin with a designated letter. In the Boston Naming Test (BNT; Kaplan, Goodglass, & Weintraub, 1983), a measure of confrontation naming, participants are presented with a series of line drawings (e.g., unicorn, compass), and have 20 seconds to correctly name each object.
Visuospatial
The Rey-Osterrieth Complex Figure Test-Copy Condition (Rey-O Copy; Rey, 1941) consists of presenting a complex figure, which participants are instructed to copy. The copy performance measures both visual perception and visual construction. The Benton Facial Recognition Test (Benton Facial Recognition Test; Benton, Sivan, Hamsher, Varney, & Spreen, 1994) is a measure of visual perceptual discrimination that requires the matching of identical or near-identical faces.
Memory
The Rey Auditory-Verbal Learning Test (RAVLT; Rey, 1964) is a verbal learning and memory task. Participants are provided five trials to learn a list of 15 words. They are then asked to recite these words again following a 30-minute delay period. Visual memory was assessed with the Rey-Osterrieth Complex Figure Test-Delay Condition (Rey-O Delay; Rey, 1941), in which participants are asked to reproduce the figure they copied 30 minutes previously.
Executive Functioning
In the Wisconsin Card Sorting Test (WCST; Heaton et al., 1993), a measure of problem solving and mental flexibility, participants must correctly categorize cards based on immediate feedback. In the Trail Making Test, part B (Trail Making B; Spreen & Strauss, 1998), participants are asked to connect dots consecutively, alternating the order between numbers and letters.
Mood
The Beck Depression Inventory – II (BDI-II; Beck, Steer, & Brown, 1996), a 21-item self-report measure, was used to assess depressive symptomatology.
Personality Measures
The NEO Five-Factor Inventory (NEO-FFI) is a 60-item version of the 240-item NEO Personality Inventory-Revised (NEO PI-R; Costa & McCrae, 1992), a standardized psychological personality inventory, comprised of scales that represent each of the “Big Five” personality traits (Neuroticism, Extraversion, Openness, Agreeableness, and Conscientiousness). Each of the five domains on the NEO-FFI consists of 12 items. However, we further modified (with permission from the publisher) the NEO-FFI with the addition of eight items referred to as the Trust facet in the larger NEO PI-R. Each NEO item is presented in the form of a statement, and the participant is asked to rate their response on a five-point Likert scale ranging from “strongly disagree” to “strongly agree” (with “neutral” corresponding to a “3” on the scale). Taken together, the inclusion of these additional items brought this modified NEO-FFI to 68 items comprised of six trait scales.
The interpretations of these personality traits were discussed thoroughly by Costa and McCrae (1992). In particular, neuroticism is the general tendency to experience negative affects, such as fear, sadness, embarrassment, anger, guilt, or disgust. Individuals with low levels of neuroticism are usually emotionally relaxed and stable, and are generally calm, even-tempered, and relaxed. They often face upsetting situations without getting upset or rattled. Extraversion describes individuals who are sociable, socially dominant, optimistic, assertive, and energetic. They prefer social large groups or gatherings, socially dominant, and tend to be cheerful, upbeat. Those who report low levels of extraversion are often reserved, less friendly, maybe sluggish in demeanor, preferring to be alone or in small groups. Individuals with high trait openness are often described as curious, creative, original, and complex. They are willing to entertain novel and unconventional ideas, experiences, and values. Those with low levels of openness are conventional and conservative in their outlook. Individuals with high trait agreeableness are prosocial, altruistic, tender-minded, trustful, and modest. Those who are disagreeable are generally self-interested, tough-minded, and egocentric and skeptical of other’s intentions. Individuals with high trait conscientiousness are able to resist impulses and temptations. They possess high levels of self-control, planning, organizing, purposeful, strong-willed, and determined. Individuals low in conscientiousness may possess a more carefree outlook in life, lackadaisical in working toward their goals, less punctual, and are less able to restrain impulses or consider consequences of their decisions. Finally, trust is defined as the disposition to believe that others are honest and well intentioned in high scorers, and defined as the disposition to be cynical and skeptical and to assume that others may be dishonest or dangerous in low scorers.
Test-retest reliability of the NEO PI-R have been reported to be high, ranging from 0.86 to 0.91 for the five scales, and internal consistency ranges from 0.68 to 0.86 (Costa & McCrae, 1992). The authors also reported retest reliability of the NEO-FFI to range from 0.75 to 0.83. The facet scales, including Trust, of the NEO PI-R have also been shown to exhibit both high convergent validity and discriminant validity (Costa & McCrae, 1992). In particular, Costa & McCrae (1992) reported that the Trust facet has been shown to be positively correlated (r = 0.68) with the Trusting scale of the Interpersonal Style Inventory (Lorr, 1986) and negatively correlated (r = −0.46) with the Suspicion scale of the Buss-Durkee Hostility Inventory (Buss & Durkee, 1957).
The Positive and Negative Affect Schedule – Expanded Form (PANAS-X) is a 60-item self-rated measure comprised of two broad dimensions of emotional experience (labeled as positive affect and negative affect), that can be used validly to assess long-term individual differences in affect (Watson & Clark, 1994). Each item consists of a word or phrase that describes different feelings and emotions. The participant is asked to rate their response on a five-point Likert scale ranging from “very slightly/not at all” to “extremely” (with “moderate” corresponding to a “3” on the scale). The Positive Affect (PA) dimension, comprised of 10 items, includes descriptors such as attentive, enthusiastic, and excited; the Negative Affect (NA) dimension, comprised of 10 items, consists of descriptors such as irritable, hostile, and distressed. The authors have indicated that these two dominant dimensions of emotional experience account for the majority of variance in self-rated affect, which is approximately one-half to three-quarters of the common variance in mood terms.
Watson and Clark (1994) reported extensive reliability and validity data on the PANAS-X, with internal consistency of PA ranging from 0.86 to 0.90, and NA ranging from 0.84 to 0.87. Retest reliability of PA ranges from 0.47 to 0.68, and NA ranges from 0.39 to 0.71. Construct validity of the PANAS-X have also been reported by Watson, Clark, and Tellegen (1988), with the descriptor scales being significantly related to positive affect and negative affect scales used in the past.
Group Classification
We classified the participants based on the strict criteria for “rational” and “irrational” behavior as defined by behavioral economists. A “rational” actor would accept any unfair offer, no matter how low, as this is the most financially advantageous decision. By this strict definition, ANY rejection would be “irrational”. In addition to this theoretical justification for the dichotomization, a frequency distribution analysis of the UG rejection rates revealed a striking non-normal distribution, with a clear separation of participants who accepted every UG offers from those who rejected any UG offers.
In addition, we considered the degree of “irrationality” among the participants, since it is possible that those who rejected only one unfair offer may be different in personality variables of interest (NEO Trust, PANAS Negative Affect) than those who rejected all 18 unfair offers. However, a Pearson’s correlation revealed a weak, non-significant relationship between the proportion of rejected offers and these personality variables. Therefore, we focus our analyses on the dichotomous distinction between “rational” and “irrational” responders.
The sample was dichotomized into two groups, based on their UG decisions in response to “unfair” offers (i.e., responses to offers of $3, $2, and $1) (Koenigs et al., 2010; Koenigs & Tranel, 2007). Responses to offers of $3, $2, and $1 were tallied to determine the dichotomization of decisions from these unfair offers. (As noted earlier, in the 22 offers in the UG, there were six offers of $3 (proposer keeps $7), six offers of $2 (proposer keeps $8), and six offers of $1 (proposer keeps $9).) Participants were classified as “Rational” economic decision-makers (hereafter referred to as “Rational”) if they accepted every unfair offer, no matter how low. This resulted in a group of 66 participants. Similarly, participants were classified as “Irrational” economic decision-makers (hereafter referred to as “Irrational”) if they rejected any unfair offers. This resulted in a group of 63 participants. Nearly everyone (87%) in the Irrational group rejected more than half of the unfair offers, and all but one participant in this group (who rejected five offers) rejected one-third or more of the unfair offers. On average, the Irrational group rejected 13.5 of the 18 unfair offers. These data support the classification of Rational vs. Irrational decision-makers.
Statistical Analysis
Preliminary analysis examined data for the presence of outliers. Descriptive statistics were used to characterize the distributions of the variables and to investigate the propriety of relevant modeling and testing assumptions.
The significance of group differences between the Rational and Irrational groups on demographic, cognitive, and affective measures were tested with independent samples t tests for continuous measures (based on independent samples and a pooled variance estimate), and with chi-square tests for the categorical variable, gender.
Logistic regression analyses were also conducted to examine the relationship between demographic, cognitive, and affective variables and UG decision-making status (i.e., Rational vs. Irrational). The first regression model examined the relationship of UG decision-making status with demographic variables by allowing the variables of age, gender, and education to enter the predictive model to identify whether a participant is either an Irrational or Rational economic decision-maker. The second model included the six personality characteristics from the NEO-FFI, the third model included the positive and negative affect variables from the PANAS-X, and the fourth model included all cognitive variables. In the final model, we entered individual variables that were found to be significantly predictive of UG decision-making status from the previous four steps into an inclusive model.
For all tests, .05 was used as the level of significance. Given the exploratory nature of the study, we also considered p-values between the .05 – .15 levels of significance as indicating variables that might warrant further investigation. To limit the number of tests conducted, for multivariable models, we did not inspect partial test p-values for individual variables in a model unless the p-value for the overall model was below .15. As the study is exploratory, no adjustment was made for multiple testing.
Results
We first present an overview of the frequencies of the acceptances and rejections among the five offers in the UG (see Figure 2), in order to provide a broad perspective on how the behavior of our participants compares to standard behavior on the UG as described in previous studies. As expected, the majority of the participants accepted the fair offers (99% accepted $5 offers, 98% accepted $4 offers). The proportions of rejection rates toward the unfair offers were consistent with past findings from Koenigs and Tranel (2007) (13% rejected all $3 offers; 30% rejected all $2 offers; and 46 % rejected all $1 offers).
Figure 2. Frequency of Accepted and Rejected Ultimatum Game Offers.

Note. The majority of the participants accepted all “fair” offers: 99% accepted $5 offers And 98% accepted $4 offers. The proportion of rejection rates of “unfair” offers was: 13% rejected all $3 offers, 30% rejected all $4 offers, and 46 % rejected all $1 offers.
Regarding the demographic and cognitive variables, we compared the results from the Rational and Irrational participant groups, using either t tests or chi-square tests. As can be seen in Table 1, the two groups were comparable on all variables. More specifically, there were no statistical differences between the Rational and Irrational groups on age, gender, education, intelligence, attention/working memory, psychomotor speed, language, visuospatial, memory, or executive functions. Given that there were no statistical differences between the two participants groups on the aforementioned variables, we concluded that the demographic and cognitive abilities were similar between the Rational and Irrational economic decision-makers, as indicated by the UG.
Table 1.
Demographic and Cognitive Variables
| Characteristics | Statistics | Participant Group
|
P-values | |
|---|---|---|---|---|
| RATIONAL (n = 66) | IRRATIONAL (n = 63) | |||
| Mean (SD) | Mean (SD) | |||
| Age | M (S.D.) | 63.0 (15.3) | 59.2 (18.3) | p = .203 |
| Gender | % female | 61% | 54% | p = .446 |
| Education | M (S.D.) | 16.1 (2.6) | 15.9 (2.7) | p = .687 |
| BDI-II | M (S.D.) | 4.4 (3.7) | 4.0 (4.3) | p = .625 |
| WASI Verbal IQ | M (S.D.) | 118.3 (11.2) | 115.3 (11.5) | p = .163 |
| WASI Performance IQ | M (S.D.) | 115.8 (17.8) | 116.0 (13.1) | p = .928 |
| WASI FS IQ | M (S.D.) | 120.2 (11.5) | 117.21 (9.7) | p = .145 |
| WRAT Reading | M (S.D.) | 52.2 (3.9) | 52.0 (3.5) | p = .803 |
| Working Memory Index | M (S.D.) | 111.5 (14.0) | 112.5 (11.9) | p = .710 |
| Trail Making A | M (S.D.) | 30.6 (10.2) | 32.8 (10.9) | p = .263 |
| COWA | M (S.D.) | 44.9 (10.9) | 45.4 (12.2) | p = .775 |
| Boston Naming Test | M (S.D.) | 19.0 (1.4) | 18.9 (1.6) | p = .686 |
| Rey-O Copy | M (S.D.) | 31.8 (3.8) | 32.1 (3.2) | p = .718 |
| Benton Faces | M (S.D.) | 46.7 (3.7) | 48.0(3.8) | p = .074 |
| RAVLT Trials 1–5 | M (S.D.) | 50.3 (9.1) | 50.9 (8.9) | p = .708 |
| RAVLT 30 min delay | M (S.D.) | 10.6 (2.9) | 10.8 (2.7) | p = .745 |
| Rey-O 30 min delay | M (S.D.) | 17.4 (6.5) | 16.8 (6.8) | p = .606 |
| WCST Perseverative Errors | M (S.D.) | 9.2 (7.2) | 9.2 (8.4) | p = .986 |
| Trail Making B | M (S.D.) | 71.8 (26.6) | 70.6 (31.2) | p = .815 |
To test for any mean level differences on the NEO-FFI and PANAS-X variables, t tests were conducted. These characteristics of the Rational and Irrational groups are presented in Table 2. We found significant differences between the groups on two of the NEO characteristics. When comparing the groups, the Irrational group scored lower on NEO Agreeableness (t(120) = 2.11, p = .037), as well as NEO Trust (t(120) = 2.80, p = .008). (We note that NEO Trust is a subscale of Agreeableness though with non-overlapping items on the particular version of the NEO we employed). On the PANAS-X, the Irrational group scored higher on Negative Affect (t(120) = 1.37; p = .038). To summarize, the group analysis (Rational vs. Irrational decision-makers) indicated no significant difference between groups on any demographic variables or tests of cognitive function, but significant between-group differences emerged on measures of affective personality traits, namely NEO Agreeableness, NEO Trust, and PANAS-X Negative Affect.
Table 2.
Affective Variables
| Characteristics | Statistics | Participant Group
|
P-values | |
|---|---|---|---|---|
| RATIONAL (n = 66) | IRRATIONAL (n = 63) | |||
| Mean (SD) | Mean (SD) | |||
|
| ||||
| NEO Neuroticism | M (S.D.) | 14.4 (7.7) | 15.1 (7.8) | p = .629 |
| NEO Extraversion | M (S.D.) | 28.7 (5.9) | 28.1 (6.9) | p = .621 |
| NEO Openness | M (S.D.) | 28.3 (6.7) | 27.3 (6.2) | p = .444 |
| NEO Agreeableness | M (S.D.) | 29.5 (4.4) | 27.7 (4.9) | p = .037 |
| NEO Conscientiousness | M (S.D.) | 35.3 (6.0) | 34.4 (6.0) | p = .427 |
| NEO Trust | M (S.D.) | 23.4 (3.5) | 21.5 (4.2) | p = .006 |
| PANAS Positive | M (S.D.) | 34.3 (5.1) | 32.9 (5.7) | p = .174 |
| PANAS Negative | M (S.D.) | 13.5 (3.2) | 15.1 (4.9) | p = .038 |
Next, we used several logistic regression models to explore the contribution of demographic, cognitive, and/or affective factors to UG performance (see Table 3). In the first model, the demographic variables of age, gender, and education were entered. As a group, these variables did not make a statistically significant contribution in predicting whether an individual was a Rational or Irrational economic decision-maker. Since the overall p-value for the model exceeds the predetermined threshold of .15, we did not give further consideration to any of the individual variables in the model based on the partial test p-values.
Table 3.
Results for Variable Category Models
| Category | exp(b)* | P-value | P-value for Model |
|---|---|---|---|
| Model 1. Demographic Variables | |||
| Age | .987 | .206 | p = .438 |
| Gender | .693 | .339 | |
| Education | .952 | .496 | |
| Model 2. NEO Affective Variables | |||
| NEO Neuroticism | .984 | .600 | p = .118 |
| NEO Extraversion | 1.026 | .461 | |
| NEO Openness | .969 | .308 | |
| NEO Agreeableness | .967 | .522 | |
| NEO Conscientiousness | .962 | .329 | |
| NEO Trust | .877 | .048 | |
| Model 3. PANAS Affective Variables | |||
| Positive Affect | .968 | .389 | p = .073 |
| Negative Affect | 1.095 | .077 | |
| Model 4. Cognitive Variables | |||
| WASI FSIQ | .950 | .178 | p = .892 |
| WRAT-3 Reading | .974 | .771 | |
| WAIS-III WMI | 1.017 | .587 | |
| Trail Making A | 1.041 | .357 | |
| COWAT | 1.030 | .337 | |
| Boston Naming Test | .949 | .843 | |
| Rey-O Copy | 1.021 | .844 | |
| Benton Faces | 1.181 | .078 | |
| AVLT Trials 1–5 | 1.030 | .600 | |
| AVLT 30 min delay | .931 | .669 | |
| Rey-O Delay | 1.023 | .667 | |
| WCST Preservative Errors | 1.004 | .897 | |
| Trail Making B | .993 | .677 | |
exp(b) values are the exponentiated regression coefficient estimates
In the second model, we entered the NEO-FFI personality scales (i.e., Neuroticism, Extraversion, Openness, Agreeableness, Conscientiousness, and Trust) to examine their contributions to economic decision-making status. This analysis revealed that, collectively, these personality characteristics were not significant in predicting the likelihood of an individual being a Rational or Irrational economic decision-maker. However, since the overall p-value for the model is less than the .15 threshold, we inspected the partial test p-values for the individual variables in the model. These results indicated that after controlling for the effect of other personality characteristics, NEO Trust was significantly predictive of UG status (p = .048). Also, recall that the t test for NEO Trust reflected a significant difference between the Rational and Irrational groups (p = .008).
The Positive Affect and Negative Affect variables from the PANAS-X were entered into the third model. Since the overall p-value for the model is less than .15, we inspected the partial tests for the individual variables. Neither variable was significant in predicting UG status based on its partial test; however, the partial test for Negative Affect approached significance (p = .073). Also, recall that the t test for Negative Affect indicated a significant difference between the Rational and Irrational groups (p = .038).
Cognitive variables (i.e., intelligence, attention/working memory, psychomotor speed, language, visuospatial, memory, and executive functions) were entered into the fourth model to predict UG decision-making status. Collectively, these cognitive characteristics were not significant in their predictive ability of economic decision-making performances among our participants. Consistent with the first model, we did not give further consideration to any of the individual cognitive variables since the overall p-value for the model exceeds the predetermined threshold of .15.
In the final model (see Table 4), we were interested in examining the variables that were previously found to be predictive of UG status (i.e., NEO Trust and PANAS-X Negative Affect) to determine their partial contributions in a multivariable model. Collectively, both NEO Trust and PANAS-X Negative Affect were predictive of UG performance (p = .009). Partial tests revealed that NEO Trust was the only significant predictor of the model (exponentiated regression coefficient estimate = .886, p = .045), indicating that for every unit increase in NEO Trust, there is approximately 11% decrease in the odds of an individual rejecting unfair offers in the Ultimatum Game.
Table 4.
Results for Final Model
| Variable | exp(b)* | 95% C.I. for exp(b)
|
Partial | Overall | Marginal | |
|---|---|---|---|---|---|---|
| Lower | Upper | P-value | P-value | P-value | ||
| NEO Trust | .886 | .787 | .997 | p = .045 | p = .009 | p = .009 |
| PANAS Negative Affect | 1.094 | .990 | 1.209 | p = .079 | p = .043 | |
exp(b) values are the exponentiated regression coefficient estimates
We also fit univariable logistic regression models based on NEO Trust and PANAS-X Negative Affect to investigate their marginal associations with UG status (see Table 4). From these marginal analyses, it was observed that NEO Trust had a significant effect on UG performance (exponentiated regression coefficient estimate = .870, p = .009). Specifically, for every unit increase in NEO Trust, we can expect a decrease of 13% in the odds of an individual being an Irrational economic decision-maker. Note that this result is similar to that obtained for NEO Trust in the multivariable model. Thus, being able to believe in the sincerity and good intentions of others led to more acceptances of unfair offers on the UG. PANAS-X Negative Affect also had a significant effect on UG performance (exponentiated regression coefficient estimate = 1.106, p = .043). Thus, for every unit increase in Negative Affect, we can expect an increase of 11% in the odds of an individual being an Irrational economic decision-maker.
Discussion
This study investigated whether demographic, cognitive, and/or personality variables were associated with UG performance. We found that only personality variables differentiated the response patterns between rational and irrational players. More specifically, participants displaying a “rational” UG performance (i.e., accepting any offer, no matter the fairness) endorsed higher levels of trust, while participants displaying an “irrational” UG performance (i.e., rejecting unfair offers) endorsed higher levels of negative affect. Others have indicated that emotional factors interfere with rational economic decision-making performance, such as emotional dysregulation among neurological patients (Koenigs & Tranel, 2007).
In our data, the strongest personality predictor of UG performance was Trust from the NEO. That is, individuals who were more trusting of others, agreeable, and prosocial, were more likely to accept any UG offers, the most rational approach to this laboratory paradigm. Presumably, such individuals are willing to accept any offers because they do not perceive hostile intent from the proposer and therefore they are not concerned about the unfairness of the offers. Another potential interpretation is that individuals high on Trust are better able to see that receiving any offer, no matter how low, is more advantageous than rejecting the offer.
Another determinant of UG performance among healthy adults was Negative Affect, as measured by the PANAS-X. We found that participants with higher levels of negative affect, defined as a variety of aversive affective states, such as fear, anger, contempt, and disgust (Watson, Clark, & Tellegen, 1988), were more likely to reject unfair offers in the UG. This is consistent with prior research indicating that rejection of low offers may be a form of punishment inflicted by the responder on the proposer (Bolton & Zwick, 1995). An alternate explanation is that individuals high in Negative Affect may be particularly sensitive to stimuli representing punishment or frustrative nonreward (i.e., punishment sensitivity), and that sensitivity leads them to reject unfair offers, in order to avoid an experience that is perceived as (psychologically) painful. This would suggest that individual differences in punishment sensitivity may influence economic decision-making.
This latter finding is consistent with a recent study by Harle and Sanfey (2007). Using movie clips, these investigators induced positive (i.e., amusement) and negative (i.e., sadness) moods in college students prior to completing the UG. They found that induced sadness interfered with economic decision-making, resulting in lowered acceptance rates of unfair offers, whereas induced amusement had no impact on UG performance. Collectively, these data also raise the possibility that both trait (or long-standing) affect (i.e., Negative Affect) and state (or transient) affect (i.e., induced negative mood) have a similar impact on UG performance.
Although much attention has been paid to decision-making impairments in clinical affective disorders (such as depression and mania, Cella, Dymond, & Cooper, 2010), little research has examined the impact of normal variation in affective traits on real-world decision-making. Our data indicate that individual differences in affective factors predict economic decision-making. More specifically, our results provide evidence for the hypothesis that individual differences in certain personality features, namely trust and negative affect, contribute to individual differences in economic decision-making, as measured by the UG.
An important limitation of this study is that we have not adjusted for multiple testing to control for Type I errors. Given that the study is exploratory in nature, we felt that it is important to highlight potential contributions of various factors (i.e., demographic, cognitive, Big Five, or personality variables) to economic decision-making. Our findings should be viewed as forming a basis for future investigations, rather than treated as definitive in their interpretation.
Acknowledgments
Preparation of this article was supported by a National Institute on Aging Career Development Award (K01 AG022033) to NLD and R01 DA022549 to DT.
Footnotes
In keeping with much of the previous work on the UG, we experimentally “fixed” the proposer behavior, and did not study this as a dependent variable. This design helps isolate the relationships of interest, i.e., how various demographic, cognitive, and affective factors might differ between rational and irrational UG players.
References
- Beck AT, Steer RA, Brown G. Beck Depression Inventory – II: Manual. San Antonio, Texas: Psychological Corp; 1996. [Google Scholar]
- Ben-Ner A, Kong F, Putterman L. Share and share alike? Gender-pairing, personality, and cognitive ability as determinants of giving. Journal of Economic Psychology. 2004a;25:581–589. [Google Scholar]
- Ben-Ner A, Putterman L, Kong F, Magan D. Reciprocity in a two-part dictator game. Journal of Economic Behavior & Organization. 2004b;53:333–352. [Google Scholar]
- Benton AL, Hamsher K. Multilingual Aphasia Examination. Iowa City, Iowa: AJA Associates; 1989. [Google Scholar]
- Benton AL, Sivan AB, Hamsher K, Varney NR, Spreen O. Contributions to Neuropsychological Assessment: A Clinical Manual. 2. New York, New York: Oxford University Press; 1994. [Google Scholar]
- Bolton GE, Zwick R. Anonymity versus punishment in ultimatum bargaining. Games and Economic Behavior. 1995;10:95–121. [Google Scholar]
- Brandstatter H, Konigstein M. Personality influences on ultimatum bargaining decisions. European Journal of Personality. 2001;15:53–70. [Google Scholar]
- Buss AH, Durkee A. An inventory for assessing different kinds of hostility. Journal of Consulting Psychology. 1957;21:343–348. doi: 10.1037/h0046900. [DOI] [PubMed] [Google Scholar]
- Camerer C, Thaler RH. Anomalies: Ultimatums, dictators, and manners. The Journal of Economic Perspectives. 1995;9:209–219. [Google Scholar]
- Cella M, Dymond S, Cooper A. Impaired flexible decision-making in major depressive disorder. Journal of Affective Disorders. 2010;124:207–210. doi: 10.1016/j.jad.2009.11.013. [DOI] [PubMed] [Google Scholar]
- Clark LA, Watson D, Leeka J. Diurnal variation in the positive affects. Motivation and Emotion. 1989;13:205–234. [Google Scholar]
- Costa PT, Jr, McCrae RR. Revised NEO Personality Inventory and the Five-Factor Model of Inventory professional manual. Odessa, FL: Psychological Assessment Resources; 1992. [Google Scholar]
- Crockett MJ, Clark L, Tabibnia G, Lieberman MD, Robbins TW. Serotonin modulates behavioral reactions to unfairness. Science. 2008;320:1739. doi: 10.1126/science.1155577. [DOI] [PMC free article] [PubMed] [Google Scholar]
- Dodrill CB. An economical method for the evaluation of general intelligence in adults. Journal of Consulting and Clinical Psychology. 1981;49:668–673. doi: 10.1037//0022-006x.49.5.668. [DOI] [PubMed] [Google Scholar]
- Eckel CC, Grossman PJ. Chivalry and solidarity in ultimatum games. Economic Inquiry. 2001;39:171–188. [Google Scholar]
- Erdle S, Rushton JP. The general factor of personality, BIS-BAS, expectancies of reward and punishment, self-esteem, and positive and negative affect. Personality and Individual Differences. 2010;48:762–766. [Google Scholar]
- Fehr E, Gächter S. Altruistic punishment in humans. Nature. 2002;415:137–140. doi: 10.1038/415137a. [DOI] [PubMed] [Google Scholar]
- Grace RC, Kemp S. What does the Ultimatum Game mean in the real world? Behavioral and Brain Sciences. 2005;28:824–825. [Google Scholar]
- Guth W, Schmittberger R, Schwarze B. An experimental analysis of ultimatum bargaining. Journal of Economic Behavior and Organization. 1982;3:367–388. [Google Scholar]
- Harle KM, Sanfey AG. Incidental sadness biases social economic decisions in the Ultimatum Game. Emotion. 2007;7:876–881. doi: 10.1037/1528-3542.7.4.876. [DOI] [PubMed] [Google Scholar]
- Heaton RK, Chelune GJ, Talley JL, Kay GG, Curtiss G. Wisconsin Card Sorting Test manual: Revised and expanded. Odessa, FL: Psychological Assessment Resources; 1993. [Google Scholar]
- Folstein MF, Folstein SE, McHugh PR. “Mini-mental state”: a practical method for grading the cognitive state of patients for the clinician. Journal of Psychiatric Research. 1975;12:189–198. doi: 10.1016/0022-3956(75)90026-6. [DOI] [PubMed] [Google Scholar]
- Kaplan EF, Goodglass H, Weintraub S. Boston Naming Test. Philadelphia, Pennsylvania: Lea & Febiger; 1983. [Google Scholar]
- Knoch D, Pascual-Leone A, Meyer K, Treyer V, Ernst F. Diminishing reciprocal fairness by disrupting the right prefrontal cortex. Science. 2006;314:829–832. doi: 10.1126/science.1129156. [DOI] [PubMed] [Google Scholar]
- Koenigs M, Tranel D. Irrational economic decision-making after ventromedial prefrontal cortex damage: Evidence from the ultimatum game. The Journal of Neuroscience. 2007;27:951–956. doi: 10.1523/JNEUROSCI.4606-06.2007. [DOI] [PMC free article] [PubMed] [Google Scholar]
- Koenigs M, Kruepke M, Newman J. Economic decision-making in psychopathy: A comparison with ventromedial prefrontal lesions. Neuropsychologia. 2010;48:2198–2204. doi: 10.1016/j.neuropsychologia.2010.04.012. [DOI] [PMC free article] [PubMed] [Google Scholar]
- Krajbich I, Adolphs R, Tranel D, Denburg NL, Camerer CF. Economic games quantify diminished sense of guilt in patients with damage to the prefrontal cortex. Journal of Neuroscience. 2009;29:2188–2192. doi: 10.1523/JNEUROSCI.5086-08.2009. [DOI] [PMC free article] [PubMed] [Google Scholar]
- Lee D. Game theory and neural basis of social decision making. Nature Neuroscience. 2008;11:404–409. doi: 10.1038/nn2065. [DOI] [PMC free article] [PubMed] [Google Scholar]
- Lorr M. Interpersonal Style Inventory (ISI) manual. Los Angeles: Western Psychological Services; 1986. [Google Scholar]
- Oosterbeek H, Sloof R, van de Kuilen G. Cultural differences in ultimatum experiments: Evidence from a meta-analysis. Experimental Economics. 2004;7:171–88. [Google Scholar]
- Pillutla MM, Murnighan JK. Unfairness, anger, and spite: Emotional rejections of ultimatum offers. Organizational Behavior and Human Decision Processes. 1996;68:208–224. [Google Scholar]
- Rey A. L’examen psychologique dans les cas d’encephalopathie traumatique. Archives de Psychologie. 1941;28:286–340. [Google Scholar]
- Rey A. L’examen Clinique en Psychologie. Paris, France: Presses Universitaires de France; 1964. [Google Scholar]
- Sanfey AG, Rilling JK, Aronson JA, Nystrom LE, Cohen JD. The neural basis of economic decision-making in the ultimatum game. Science. 2003;300:1755–1758. doi: 10.1126/science.1082976. [DOI] [PubMed] [Google Scholar]
- Scheres A, Sanfey AG. Individual differences in decision making: Drive and reward responsiveness affect strategic bargaining in economic games. Behavioral and Brain Functions. 2006;2:1–8. doi: 10.1186/1744-9081-2-35. [DOI] [PMC free article] [PubMed] [Google Scholar]
- Solnick SJ. Gender differences in the ultimatum game. Economic Inquiry. 2001;39:189–200. [Google Scholar]
- Spreen O, Strauss E. A Compendium of Neuropsychological Tests. 2. New York, New York: Oxford University Press; 1998. [Google Scholar]
- Sutter M, Kocher MG. Trust and trustworthiness across different age groups. Games and Economic Behavior. 2007;59:364–382. [Google Scholar]
- van’t Wout M, Kahn RS, Sanfey AG, Aleman A. Affective state and decision-making in the ultimatum game. Experimental Brain Research. 2006;169:564–568. doi: 10.1007/s00221-006-0346-5. [DOI] [PubMed] [Google Scholar]
- Watson D, Clark LA. Manual for the Positive and Negative Affect Schedule – Expanded Form. Iowa City: University of Iowa, Department of Psychology; 1994. [Google Scholar]
- Watson D, Clark LA, Tellegen A. Development and validation of brief measures of positive and negative affect: The PANAS Scales. Journal of Personality and Social Psychology. 1988;54:1063–1070. doi: 10.1037//0022-3514.54.6.1063. [DOI] [PubMed] [Google Scholar]
- Wechsler D. Wechsler Adult Intelligence – Scale III. San Antonio, Texas: Psychological Corp; 1997. [Google Scholar]
- Wechsler D. The WASI: Wechsler Abbreviated Scale of Intelligence. San Antonio, Texas: Psychological Corp; 1999. [Google Scholar]
- Wilkinson GS. WRAT-3: Wide Range Achievement Test Administration Manual, 3rd edition. Wilmington, Delaware: Wide Range; 1993. [Google Scholar]