Abstract
Four polymorphic forms of methyl paraben (methyl 4-hydroxybenzoate, 1), denoted 1-I (melting point 126 °C), 1-III (109 °C), 1-107 (107 °C), and 1-112 (112 °C), have been investigated by thermomicroscopy, infrared spectroscopy, and X-ray crystallography. The crystal structures of the metastable forms 1-III, 1-107, and 1-112 have been determined. All polymorphs contain the same O–H···O=C connected catemer motif, but the geometry of the resulting H-bonded chain is different in each form. The Z′ = 3 structure of 1-I (stable form; space group Cc) contains local symmetry elements. The crystal packing of each of the four known crystal structures of 1 was compared with the crystal structures of 12 chemical analogues. Close two-dimensional relationships exist between 1-112 and a form of methyl 4-aminobenzoate and between 1-107 and dimethyl terephthalate. The lattice energies of the four methyl paraben structures have been calculated with a range of methods based on ab initio electronic calculations on either the crystal or single molecule. This shows that the differences in the induction energy of the different hydrogen-bonded chain geometries have a significant effect on relative lattice energies, but that conformational energy, repulsion, dispersion, and electrostatic also contribute.
Short abstract
A single O−H···O=C connected catemer motif results in four fundamentally different chain geometries. This study highlights the challenges associated with the computation of polymorphic energy differences.
Introduction
Methyl paraben (1) (also: Nipagin M; CAS no. 99-76-3; Scheme 1), the methyl ester of 4-hydroxybenzoic acid, is used as an antifungal agent and preservative (E218) in cosmetics, foods, and drugs. The polymorphic nature of sublimates of 1 was first noted by Fischer and Stauder1 in the early 1930s. L. and A. Kofler2 found two distinct forms with melting points (mp) of 126 and 110 °C. In 1939, Lindpaintner described the existence of six distinct solid state modifications: I (mp 127 °C), II (116 °C), III and IV (110 °C), V (109 °C), VI (106 °C).3 Lin reported the crystal structure of the stable polymorph at room temperature4 (1-I) in 1983 (CSD refcode5 CEBGOF). In 2006, Vujovic and Nassimbeni discussed a structure of I at 113 K (CEBGOF01) in terms of a possible low-temperature polymorph distinct from 1-I,6 but other authors later disagreed with this interpretation.7 Similarly, a crystal structure of 1 at 100 K (CEBGOF02), determined by Fun and Jebas and claimed to represent a new polymorph of 1,8 is in fact the same as CEBGOF01 and CEBGOF.9 During the preparation of this manuscript, we became aware of a recent study by Nath et al. (CEBGOF03)10 of a polymorph of 1 whose identity we will discuss below. The literature dealing with the various crystal forms of the title compound is summarized in Table 1.
Scheme 1.
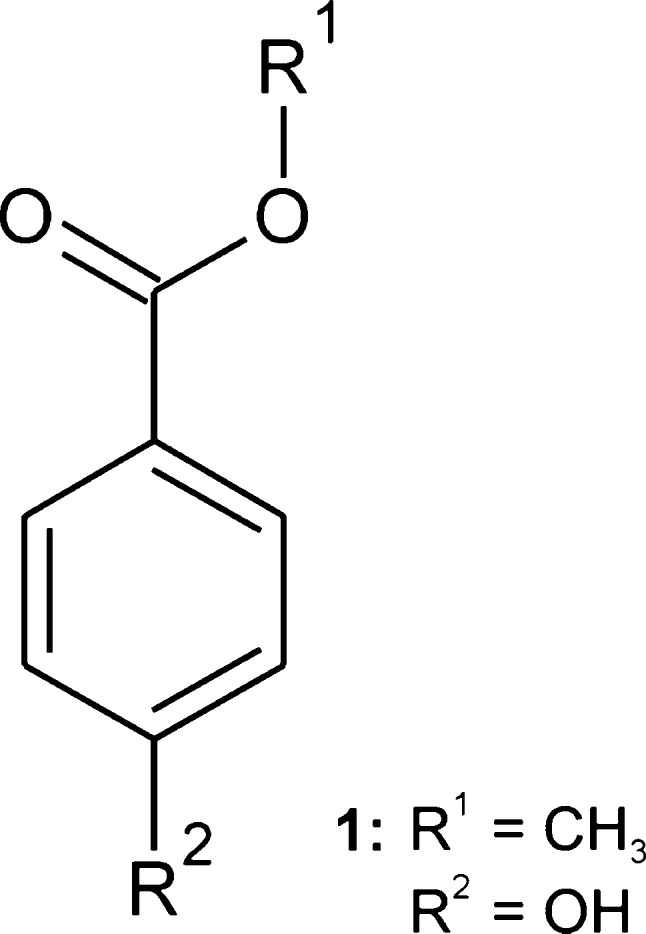
Table 1. Overview of Reports about Polymorphs of 1 and Assignment of the Forms Discussed in This Study.
| report | notation | experimental method(s)a | ref |
|---|---|---|---|
| Polymorph 1-I | |||
| this work | 1-I | SS, IR, HSM (mp 126 °C) | |
| Kofler & Kofler, 1931 | I | OM, SS, HSM (mp 126 °C) | (2) |
| Lindpaintner, 1939 | I | SS, HSM (mp 127 °C) | (3) |
| Lin, 1983 | SX (RT; CSD: CEBGOF) | (4) | |
| Giordano et al., 1999 | DSC (mp 126.0) | (12) | |
| Vujovic & Nassimbeni, 2006 | b | SX (LT; CSD: CEBGOF01) | (6) |
| Fun & Jebas, 2008 | c | SX (LT; CSD: CEBGOF02) | (8) |
| Nath et al., 2011 | I | SS, IR | (10) |
| Polymorph 1-III | |||
| this work | 1-III | SS, SX (RT), IR, HSM (mp 109 °C), DSC | |
| Kofler & Kofler, 1931 | II | OM, SS, HSM (mp 110 °C) | (2) |
| Lindpaintner, 1939 | III | SS, HSM (mp 110 °C) | (3) |
| Nath et al., 2011 | II | SS, SX (LT; CSD: CEBGOF03), IR, HSM | (10) |
| Polymorph 1-107 | |||
| this work | 1-107d | SS, SX (LT), IR, HSM (mp 107 °C) | |
| Polymorph 1-112 | |||
| this work | 1-112d | SS, SX (RT), IR, HSM (mp 112 °C) |
HSM = hot-stage microscopy: IR = infrared spectroscopy; OM = optical microscopy; SS = sublimation studies; SX = single-crystal X-ray structure analysis; DSC = differential scanning calorimetry; RT = room temperature; LT = low temperature.
Proposed as a possible low-temperature form.
Claimed to be distinct from CEBGOF and CEBGOF01.
Nomenclature derived from the melting point.
We have embarked on a comprehensive reinvestigation of Lindpaintner’s original observations about the polymorphism of methyl paraben. In this contribution, we report the crystal structures of three metastable modifications formed either by sublimation or from the melt, their melting points and infrared spectra. Different state of the art ab initio electronic structure calculation methods, based either on the lattice or the molecule and allowing for polarization, are contrasted to analyze the relevant contributions to relative (lattice) energies. The structural relationships to analogous compounds will be discussed on the basis of an XPac analysis, a structure comparison method based on the comparison of corresponding geometrical parameters.11
Experimental Section
Materials
Commercial methyl paraben purchased from Merck KGaA Darmstadt, Germany, was used for all experiments.
Single-Crystal X-ray Structure Analysis
Essential crystal data are summarized in Table 2. The data for 1-107 and 1-112 were collected, using Cu radiation (1-107; λ = 1.5418 Å) or Mo radiation (1-112; λ = 0.7107 Å), on an Oxford Diffraction Gemini-R Ultra diffractometer operated by CrysAlis software.13 Intensity data for 1-III were recorded on a Bruker SMART diffractometer driven by SMART and SAINT software14 and using Mo radiation (λ = 0.7107 Å). The data were corrected for absorption effects by means of comparison of equivalent reflections using the program SADABS.15 The structures were solved using the direct methods procedure in SHELXS97 and refined by full-matrix least-squares on F2 using SHELXL97.16 Non-hydrogen atoms were refined anisotropically. Hydrogen atoms were located in difference maps, and those bonded to carbon atoms were fixed in idealized positions and their displacement parameters were set to 1.2Ueq (for CH) or 1.5Ueq (for the CH3 group) of the parent C atom, while the H atom of the OH group was refined freely. The molecular structures of 1-III, 1-107, and 1-112 are shown in Figure S1, Supporting Information.
Table 2. Crystal Data for Polymorphs of 1.
| polymorph | 1-I | 1-III | 1-107 | 1-112 |
|---|---|---|---|---|
| chemical formula | C8H8O3 | C8H8O3 | C8H8O3 | C8H8O3 |
| formula mass | 152.14 | 152.14 | 152.14 | 152.14 |
| crystal system | monoclinic | monoclinic | monoclinic | monoclinic |
| space group | Cc | P21/c | Cc | P21/c |
| no. of formula units per unit cell, Z | 12 | 4 | 4 | 4 |
| a/Å | 13.568(5) | 4.8980(8) | 17.517(5) | 5.9845(6) |
| b /Å | 16.959(7) | 14.698(2) | 7.2602(18) | 8.3384(6) |
| c/Å | 12.458(6) | 10.3341(16) | 6.224(2) | 14.4209(12) |
| β/° | 130.10(3) | 98.774(4) | 107.61(3) | 96.526(9) |
| unit cell volume/Å3 | 2192.7 | 735.3(2) | 754.5(4) | 714.96(11) |
| volume per molecule/Å3 | 182.7 | 183.8 | 188.6 | 178.7 |
| temperature/K | 298 | 298(2) | 298(2) | 173(2) |
| no. of reflections measured | 4619 | 1641 | 2914 | |
| no. of independent reflections | 1299 | 893 | 1331 | |
| Rint | 0.0561 | 0.0803 | 0.0421 | |
| final R1 values (I > 2σ(I)) | 0.0354 | 0.0536 | 0.0489 | |
| final wR(F2) values (I > 2σ(I)) | 0.0577 | 0.1020 | 0.1052 | |
| final R1 values (all data) | 0.0977 | 0.0947 | 0.0786 | |
| final wR(F2) values (all data) | 0.0637 | 0.1339 | 0.1187 | |
| reference | 4 | this work | this work | this work |
| CSD refcode or CCDC no. | CEBGOFa | 905982 | 905983 | 905984 |
The structure is the same as those of CEBGOF01 and CEBGOF02.
Fourier Transform Infrared (FT-IR) Spectroscopy
FT-IR spectra were recorded with a Bruker IFS 25 spectrometer connected with the IR microscope I (Bruker). The samples were prepared on ZnSe discs and measured in transmission mode (15× Cassegrain objective, spectral range 4000 to 600 cm–1, resolution 4 cm–1, 64 interferograms per spectrum).
XPac Analysis
Geometrical comparisons between crystal structures were carried out with the program XPac.11,17 Each independent molecule was represented by the positions of 11 non-H atoms (see Scheme 1, Supporting Information, Figure S3). Further XPac details are available as Supporting Information.
Computer Models for Relative Lattice Energies
The lattice energies of the four structures of methyl paraben, 1-I, 1-III, 1-107, and 1-112, were calculated using a range of different ab inito methods.18 Periodic electronic structure calculations were carried out with the CASTEP plane wave code19 using the Perdew–Burke–Ernzerhof (PBE) generalized gradient approximation (GGA) exchange-correlation density functional20 and ultrasoft pseudopotentials21 with the addition of either the Grimme (G06)22 or Tkatchenko and Scheffler (TS)23 semiempirical dispersion corrections. The results reported here were obtained using a plane wave cutoff energy of 780 eV and a Monkhorst-Pack24 Brillouin zone sampling grid of spacing 2π × 0.07 Å–1; the required force tolerance for a successful geometry optimization in each run was 0.05 eV Å–1. Convergence checks were made by increasing the cutoff energy to 1020 and 1560 eV and the sampling grid of spacing 2π × 0.03 Å–1 (see Supporting Information).
“Isolated molecule charge density” structures are based on crystal structures optimized with CrystalOptimizer.25 All dihedrals containing oxygen atoms (Supporting Information, Figure S10), the cell parameters, position, and orientation of each independent molecule were varied to minimize the lattice energy, Elatt, as the sum of the intermolecular lattice energy, Uinter, and the conformational intramolecular energy penalty, ΔEintra, i.e., Elatt = Uinter + ΔEintra. GAUSSIAN0326 was used to perform ab initio calculations on the isolated molecules to determine ΔEintra, the torsional forces, and to calculate the charge density. This was done at both the PBE0/6-31G(d,p) and the MP2/6-31G(d,p) level of theory. All atomic multipole models27 included moments up to hexadecapole, and they were generated from the isolated-molecule wave function, using GDMA2.28 All other intermolecular contributions to the lattice energy were represented by empirical exp-6 potentials, using either the FIT29 or Williams0130 parameters. DMACRYS31 was used for intermolecular lattice energy calculations.
The effect of simulating the average polarization of the molecule within the crystal structure was tested by calculating the distributed multipoles and relative conformational energies using the polarizable continuum model (PCM)32 implemented in GAUSSIAN03 with ε = 3, a value typical of organic crystals.33
A better estimate of the effect of the specific environment of each “isolated molecule charge density” structure was made by calculating the induction energies. The explicit polarization model used distributed anisotropic dipole–dipole polarizabilities calculated using the Williams–Stone–Misquitta (WSM) scheme,34 as implemented in the CamCASP suite of programs.35 The induced atomic dipole moments within each crystal structure were iterated to self-consistency using DMACRYS31 and used to evaluate the induction contributing to the lattice energy (see Supporting Information).
Results and Discussion
Preparation and Assignment of the Crystal Forms
Sublimation experiments were carried out on a Kofler hot bench at 85–110 °C, between two glass slides separated by a spacer ring of 5–30 mm height. This method yielded at least three distinct polymorphs, henceforth denoted 1-I, 1-III, and 1-112. Form 1-I crystallized as needles or large isometric crystals (Figure 1a). Polymorph 1-III, the main primary phase of these sublimation experiments, crystallized mainly as plates with a rhombic base (Figure 1b). It converted into the stable form 1-I within minutes to days, depending on the ambient temperature. A few crystals of the third polymorph 1-112 were present in some sublimates produced at higher temperature (>100 °C). They were easily distinguishable from crystals of the concomitant forms 1-I and 1-III by their coffin-lid shape (Figure 1d). Polymorph 1-112 was found to have transformed into 1-I within a few days. Single crystals of form 1-107 (Figure 1c) were produced in a thermomicroscopy experiment, by allowing small isolated droplets to crystallize at 95 °C. Quench cooling of melt droplets yielded 1-107 and 1-III as primary polymorphs. Recently, Nath et al. have reported that crystallization from various solvents always gave the modification 1-I.10
Figure 1.
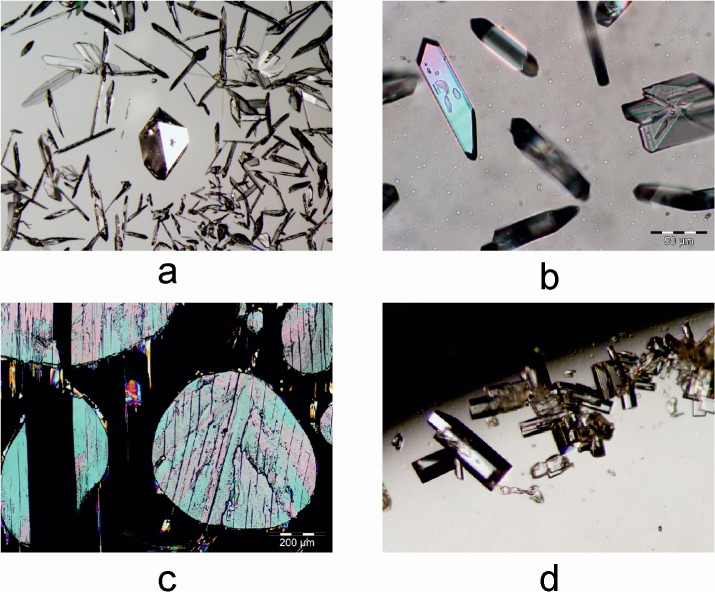
(a) Isometric crystal of 1-I, surrounded by form 1-III (sublimation experiment); (b) crystals of 1-III formed by sublimation at 90 °C; (c) form 1-107 crystallized from melt droplets; (d) crystals of 1-112 formed by sublimation at 105 °C.
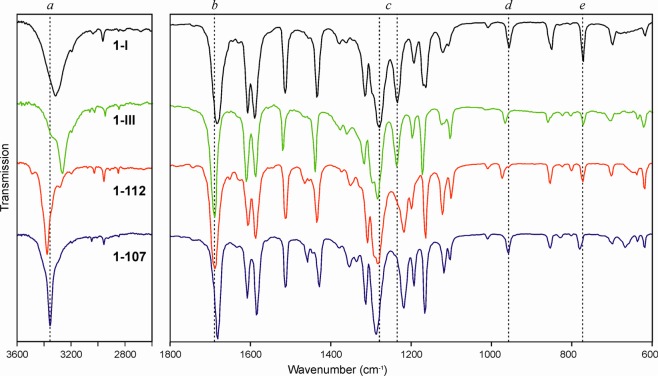
The following equilibrium melting points (±0.5 °C) were determined by thermomicroscopy: 126 °C (1-I), 109 °C (1-III), 112 °C (1-112), and 107 °C (1-107). The spectra of the four polymorphs are shown in Figure 2 and typical bands are listed in Table 3. Habit and physical properties of the crystals of 1-I match Lindpaintner’s description3 of “modification I”. Their identity with the three existing CSD entries4,6,8 (see Table 1) for the stable “form I” was confirmed by us by single crystal X-ray diffraction.
Figure 2.
IR spectra of polymorphs of 1. Reference lines a–e and the values associated with them are detailed in Table 3.
Table 3. Positions (cm–1) of Distinctive Bands in the Mid Infrared Spectra of Polymorphs of 1.
| polymorph |
|||||
|---|---|---|---|---|---|
| section | type | 1-I | 1-III | 1–112 | 1–107 |
| a | ν(O–H) | 3315 | 3264 | 3379 | 3555 |
| b | ν(C=O) | 1683 | 1689 | 1690 | 1682 |
| c | ν(C–O) | 1280, 1235 | 1284, 1236 | 1285, 1220 | 1288, 1219 |
| d | ν(C–C–O) [in phase] | 957 | 967 | 975 | 958 |
| e | ν(C–H) [banding wagging] | 772 | 772 | 775 | 780 |
Our observations strongly suggest that 1-III is identical with Lindpaintner’s “modification III”. Moreover, 1-III is identical with the structure recently published by Nath et al. (CEBGOF03),10 as evidenced by the very low XPac dissimilarity index17 of x = 1.1 (ΔT = 198 K; for details, see Supporting Information). We note, however, that the FT-IR spectrum accompanying this structure report (Figure S6 of ref (10)) differs substantially from that of 1-III recorded by us (Figure 2). The most notable discrepancies occur in the region of the characteristic OH bands, which are critical for the identification of a specific polymorph of 1.
For 1-112 and 1-107, the overall thermomicroscopic, sublimation and crystallization characteristics observed by us do not match any of Lindpaintner’s six descriptions of methyl paraben polymorphs sufficiently closely to permit unequivocal assignment.
Crystal Structures
The structure of 1-I has the space group symmetry Cc and contains three independent molecules, denoted henceforth 1–3. In recent years, the existence of single-component crystal structures with more than one (Z′ > 1) independent molecule has been discussed by different authors.36 To gain a better understanding of such a structure, it is useful to establish whether any of the independent molecules are related by a noncrystallographic symmetry transformation. This may be achieved by comparing their first molecular environments to one another, as was previously demonstrated for Z′ > 1 polymorphs of sulfathiazole,37 2,4,6-trinitrotoluene,38 carbamazepine,39 and the barbiturate eldoral.40 We have carried out such an analysis for polymorph 1-I (CEBGOF4), using the program XPac.11 It was found that the first environments of molecules 1 and 2 are geometrically very similar with respect to 11 (out of 16) next-neighbor molecules (dissimilarity index17x = 2.7). Likewise, the geometry of another portion of the first environment of molecule 1, also comprising 11 next neighbors is replicated in the environment of molecule 3 (again x = 2.7), while the environments of molecules 2 and 3 agree with respect to a smaller cluster with only six surrounding molecules (x = 3.2). Further analysis of these results implies the presence of local symmetry elements, which will be discussed in the following paragraphs.
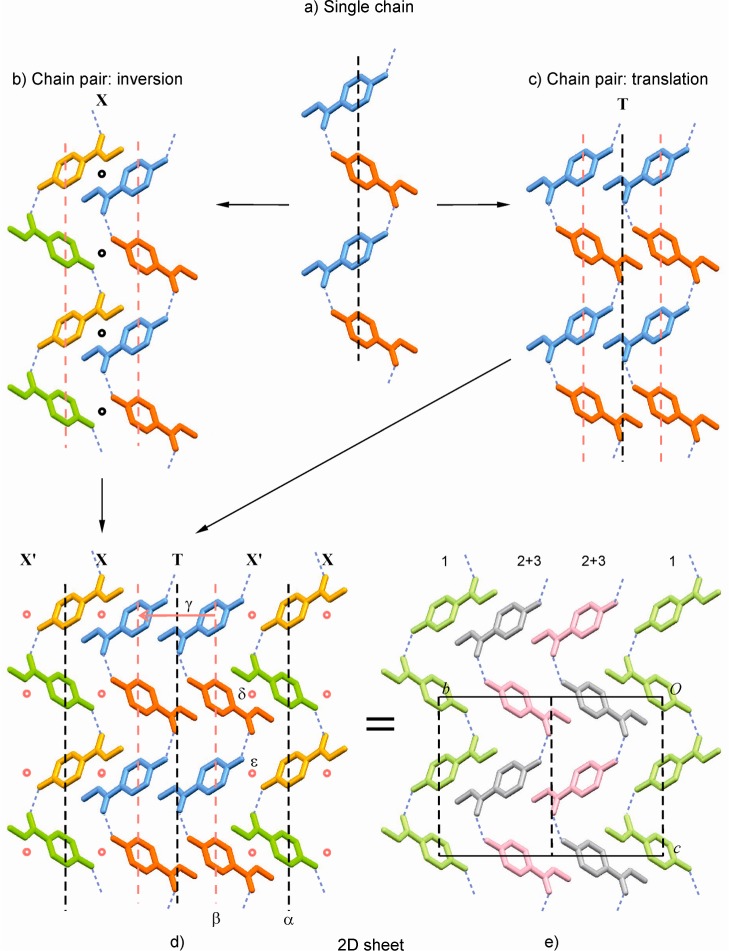
The crystal of 1-I is composed of O–H···O=C bonded chains which possess glide symmetry and propagate parallel to the c-axis (Figures 3a and 4). Two neighboring H-bonded chains are related to one another either by inversion (linkage mode X) or by translation (T) symmetry. Linkage type X generates two distinct centers of inversion between neighboring chains (Figure 3b), while mode T results in a central glide plane (Figure 3c). The H-bonded chains are arranged into a 2D extended sheet parallel to (100) in such a way that a linkage sequence X′ X T X′ X T is generated (Figure 3d). The identification of the shortest translation periods within this layer structure shows immediately that its asymmetric unit consists of three molecules (Figure 3e). The central glide plane of each T-connected two-chain unit is effective on the entire 2D sheet and is therefore a crystallographic symmetry element. This is also true for the central glide plane of every other chain in the X-linked units. By contrast, all the other symmetry operations in this sheet (colored red in Figure 3b,c; see also Table 4) are local, i.e., effective on a specific molecule pair only.
Figure 3.
Crystallographic and local symmetry elements in the bc-plane of 1-I (viewed along the a*-axis). (a–d) Molecules are color coded, yellow (y), blue (b), red (r), and green (g), according to their symmetry relationships: translation (y/y, b/b, r/r, g/g), glide (y/g, r/b), and inversion (y/b, r/g); local and global symmetry elements are indicated red and black, respectively; (a) single H-bonded chain; two neighboring chains related by (b) inversion (X) or (c) by translation (T); (d) X′ X T X′ X T sequence of H-bonded chains; the local symmetry elements α–ε are listed in Table 4; (e) alternative representation of the same sequence, highlighting molecule types 1 (green), 2 (gray), and 3 (pink).
Figure 4.
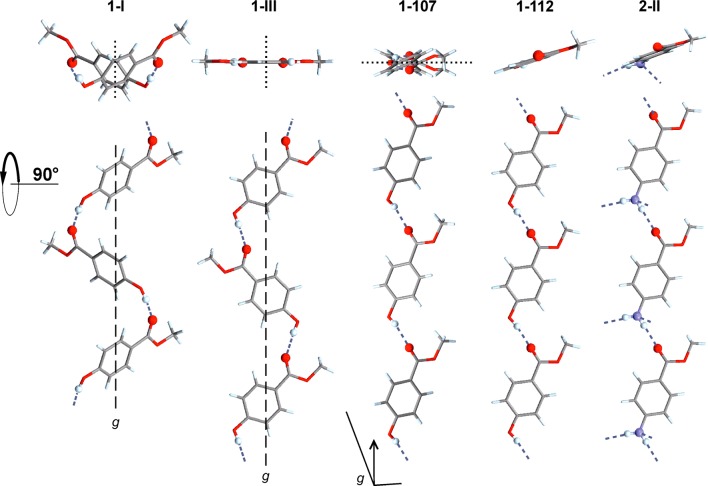
O–H···O=C bonded chains in polymorphs of 1 and the analogous N–H···O=C bonded chain of 2-II (top: cross-section).
Table 4. Symmetry Operations in 1-Ia.
| # | operation | position | type | molecules affected |
|---|---|---|---|---|
| α | c-glide | x, 0, z | crystallographic | complete crystal structure |
| β | c-glide | x, ∼1/3, z | local | 2 + 3 in a single H-bonded chain |
| γ | t(0, ∼1/3, 0) | local | 2 + 3 in adjacent H-bonded chains (T) | |
| δ | inversion | 0.272, 0.165, 0.723 | local | 1 + 3 (two H-bonded chains X) |
| ε | inversion | 0.271, 0.166, 0.223 | local | 1 + 2 (two H-bonded chains X) |
See Figure 3d,e.
As a consequence of these relationships, the structure of 1-I contains two H-bonded chain types, which are crystallographically distinct but possess the same geometry. One chain type is composed of molecules of type 1 and possesses crystallographic glide symmetry, while the other is formed by the molecules 2 and 3. Overall, the structure of 1-I is a sequence of the layers described above (Figure 3d,e) that are shifted relative to one another by 1/2 1/2 0.
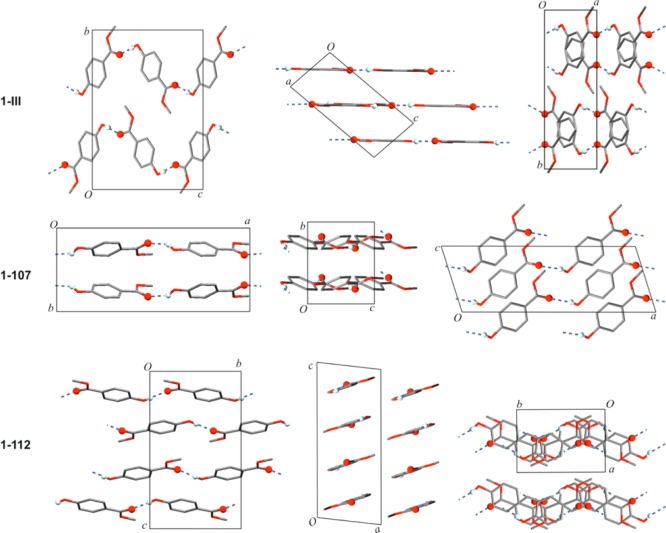
The methyl paraben molecule adopts the same geometry in each of the four polymorphs. The crystal packing of the Z′ = 1 forms 1-III, 1-112, and 1-107 is illustrated in Figure 5. All polymorphs contain the same O–H···O=C bonded connectivity motif as 1-I [graph set notation41 C11(8)], but the resulting extended 1D H-bonded structures differ fundamentally from one another geometrically (Figure 4). The chains of 1-I, 1-III, 1-112 all possess glide symmetry, and the glide plane and mean plane of individual chain molecules form angles of 53.8° (both independent chains of 1-I), 26.4° (1-107), and 89.6° (1-III); i.e., the O–H···O=C bonded chain of 1-III has an almost planar cross-section. The latter is also true for the chain of 1-112 where neighboring molecules are related to one another by translation symmetry. The polymorphs 1-III and 1-112 may be interpreted as layer structures. In the case of 1-III, antiparallel H-bonded chains, which propagate along [201̅], form a centrosymmetric planar sheet parallel to (102). Neighboring layers of this kind are related to each other by a 21 screw operation so that additional glide planes are generated. In form 1-112, the H-bonded chains propagate parallel to the b-axis and are arranged into centrosymmetric sheets which are slightly corrugated and lie in (1̅04) planes. Stacking of these planes is again achieved via 21 and glide symmetry operations. In the structure of 1-107, the H-bonded chains propagate parallel to [101], and chains related to each other by a translation along the a-axis form planes parallel to (010). Adjacent layers of this kind are related to each other by glide symmetry. Parameters for H-bonds are compiled in Table 5.
Figure 5.
Crystal structures of polymorphs of 1, viewed along their crystallographic axes. H atoms, except those in OH groups, are omitted for clarity. O–H···O=C bonds are highlighted.
Table 5. Geometrical Parameters (Å, °) of O–H···O Bonds in Polymorphs of 1.
| D–H···A | d(D–H) | d(H···A) | d(D···A) | ∠(DHA) |
|---|---|---|---|---|
| 1-I (taken from CEBGOF02, ref (8)) | ||||
| O1A–H1A···O2Aa | 0.82 | 1.96 | 2.770(2) | 168 |
| O1B–H1B···O3Cb | 0.82 | 1.93 | 2.729(2) | 167 |
| O1C–H1C···O2B | 0.82 | 1.92 | 2.729(2) | 167 |
| 1-III | ||||
| O3–H3O···O1c | 0.83(2) | 1.87(2) | 2.693(2) | 176(3) |
| 1-112 | ||||
| O3–H3O···O1e | 0.82(2) | 1.93(2) | 2.737(2) | 168(3) |
| 1-107 | ||||
| O3–H3O···O1d | 0.82(9) | 2.00(9) | 2.723(7) | 148(9) |
Symmetry transformations used to generate equivalent atoms: x – 1/2, −y + 1/2, z – 1/2.
x + 1, y, z + 1.
x + 1, −y + 3/2, z – 1/2.
x – 1/2, −y + 1/2, z – 1/2.
x, y + 1, z.
Packing Relationships
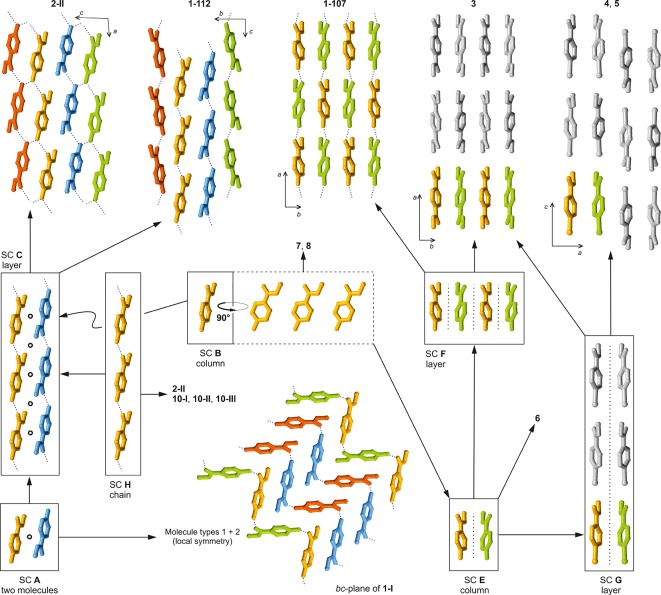
The program XPac(11) was used to identify geometrically similar building blocks (supramolecular constructs, SCs)42 in the four distinct forms of methyl paraben (Figure 6). The SC A is a centrosymmetric arrangement of two molecules belonging to neighboring H-bonded chains. It is formed by molecules 1 and 2 of polymorph 1-I, and it is also found in 1-112. Moreover, the 1D stacking of methyl paraben molecules along the c-axis in form 1-107 is repeated along the a-axis of 1-112 (SC B). These are the two closest packing similarities in this group. Also worth noting is an arrangement of two inversion-related molecules belonging to adjacent O–H···O bonded chains that occurs both in 1-III and 1-112 (SC D, Figure 7), albeit with a relatively high dissimilarity index x of 12.7. The mean planes of the two molecules forming this SC are almost perfectly coplanar in 1-III, while in 1-112 they are somewhat offset against one another.
Figure 6.
Packing relationships involving crystal structures of methyl paraben and analogous compounds (see Table 6), identified with XPac. The color scheme is the same as in Figure 3a–d.
Figure 7.
Details of similar packing in 1-III and 1-112 (SC D). (a) Top: assembly of two neighboring H-bonded chains with an instance of D highlighted; bottom: side view, showing the different offset. (b) Molecular packing in the (102) plane of 1-III (top) and in the (1̅04) plane of 1-112 (bottom) with different instances of D indicated by different colors.
It has been reported by Giordano et al. that crystals of ethyl and propyl paraben43 (11, 13) are isostructural and that their binary mixtures give a continuous series of solid solutions,12 while the stable methyl paraben modification 1-I was found to be clearly distinct from these two crystals. Inspired by these observations, we have compared the crystal structures of 1-I, 1-III, 1-107, and 1-112 with those of 12 structural analogues of methyl paraben (Table 6), again using XPac. The identified SCs are illustrated in Figure 6, and an overview of all packing relationships is shown in Figure 8 (for more details, see Supporting Information). In addition to the relationships discussed below, it was established that allyl paraben44 (12) is isostructural with the ethyl and propyl analogues 11 and 13.
Table 6. Crystal Structures Included in the XPac Comparison (see Scheme 1).
| R1 | R2 | T | CSD | ref | |
|---|---|---|---|---|---|
| 1-I | CH3 | OH | RT | CEBGOF | (4) |
| 1-III | CH3 | OH | RT | this work | |
| 1-107 | CH3 | OH | RT | this work | |
| 1-112 | CH3 | OH | 173 K | this work | |
| 2-I | CH3 | NH2 | RT | CEBGUL | (51) |
| 2-II | CH3 | NH2 | 120 K | CEBGUL01 | (45) |
| 3 | CH3 | C(=O)OCH3 | RT | DMTPAL | (46) |
| 4 | CH3 | Br | 173 K | DEGGOM | (53) |
| 5 | CH3 | I | RT | FORGOI | (54) |
| 6 | CH3 | CCH | 120 K | AYOHIF | (48) |
| 7 | CH3 | CH2Br | 173 K | XEZBOU | (49) |
| 8 | CH3 | CH3 | 120 K | XIYVOR | (50) |
| 9 | CH3 | C(=O)F | RT | LALXEB | (55) |
| 10-I | CH2CH3 | NH2 | RT | QQQAXG04 | (52) |
| 10-II | CH2CH3 | NH2 | RT | QQQAXG05 | (52) |
| 10-III | CH2CH3 | NH2 | 150 K | QQQAXG03 | (52) |
| 11 | CH2CH3 | OH | RT | FEGLEI | (43) |
| 12 | CH2CHCH2 | OH | RT | ELIDEI | (44) |
| 13 | CH2CH2CH3 | OH | RT | DUPKAB | (56) |
Figure 8.
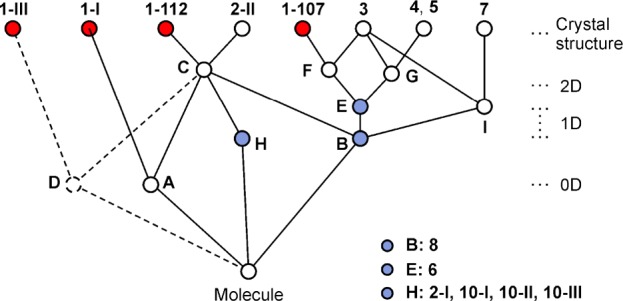
Tree diagram according to ref (39), illustrating packing relationships between polymorphs of 1 and crystal structures of analogous compounds (Table 6). The SCs A–I are illustrated in Figures 6 and 7.
The stacking of molecules along the c-axis of 1-107 and along the a-axis of 1-112 (SC B) is repeated in methyl 4-aminobenzoate45 (2-II), dimethyl terephthalate46 (3), methyl 4-bromobenzoate47 (4) and its iodo47 (5) and ethynyl48 (6) analogues, methyl 4-(bromomethyl)benzoate49 (7) and methyl 4-methylbenzoate50 (8). Form 1-112 is even 2D similar (SC C) with polymorph 2-II of 4-aminobenzoate,45 with which it shares a centrosymmetric double layer consisting of two layers of H-bonded chains. The geometrical correspondence between the O–H···O=C chain of 1-112 and the N–H···O=C chain of 2-II is apparent from Figure 4. The two crystal structures differ in the orientation of the 21 axis by which neighboring instances of C are related to one another. This axis lies either parallel (1-112) or perpendicular (2-II) to the translation vector of the chain, and in the latter case it facilitates a second set of intermolecular N–H···O=C bonds. Ten out of 15 molecules forming the first environment of the molecule of 1-112 belong to SC C (see also Supporting Information, Figure S7). Interestingly, the N–H···N=C bonded chain (along [11̅0]) in the second methyl 4-aminobenzoate51 polymorph 2-I adopts a similar geometry (SC H), but here the separation between adjacent molecular centroids is substantially increased by 0.5 Å. SC H is also present in three polymorphs of ethyl 4-aminobenzoate52 (10).
SC E is a 1D column of molecules found in 1-107 and in 3–6. It is composed of two instances of SC B that are related by glide symmetry. The structures of 1-107 and dimethyl terephthalate (3) are even 2D similar (SC F) as they contain essentially the same arrangement of adjacent instances of SC E along their respective b-axis. Moreover, the packing of instances of SC E in 3 along the a-axis is repeated in methyl 4-bromobenzoate (4) and in the isostructural iodo analogue (5), namely, along the c-axis (2D SC G).
The three SCs shared by different polymorphs of methyl paraben, i.e., A (0D; 1-I, 1-112), B (1D; 1-112, 1-107), D (0D; 1-III, 1-112), may be interpreted as particularly favorable supramolecular arrangements. It is however doubtful whether the geometry of such an SC would indeed be maintained in a corresponding solid-state phase transition. Moreover, we note that forms 1-107 and 1-112 both exhibit close packing relationships with a number 4-substituted analogues of methyl benzoate (R1 = CH3; 2–8), even though the ring substituents at the 4-position (R2) in this group vary considerably in terms of their H-bond capabilities and their shape (relative to the overall size of the molecule). This indicates that the supramolecular constructs in question remain more favorable than possible alternatives even if their geometry is adopted to satisfy the specific preferences of R2. Contrary to our original expectations, none of the four polymorphs of 1 has any close packing relationship with the three isostructural ethyl, allyl, and propyl parabens (R2 = OH; 11, 12, 13).
Relative Lattice Energy Differences
Each of the applied electronic structure calculation methods reproduces the four experimental structures as lattice energy minima. The reproduction of all the structures is acceptable considering that lattice energies correspond to 0 K, whereas the experiments were at finite temperature. However, the DFT+G06 increase in density for all forms, particularly 1-I (CEBGOF) and 1-107, seems rather too large to correspond to the neglect of thermal expansion (Supporting Information, Table S3). This effect may be caused by the G06 correction.57
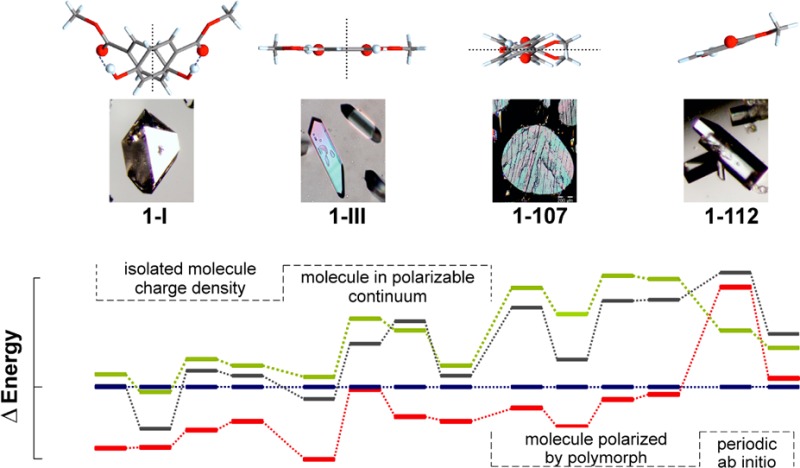
The range of the lattice energy differences, 4–8 kJ mol–1 (Figure 9), is small enough that all structures would be considered as low energy structures and probable polymorphs on a crystal energy landscape. But there is no agreement in 0 K relative stability order, although forms 1-I and 1-III are, with few exceptions, calculated to be more stable than forms 1-107 and 1-112.
Figure 9.
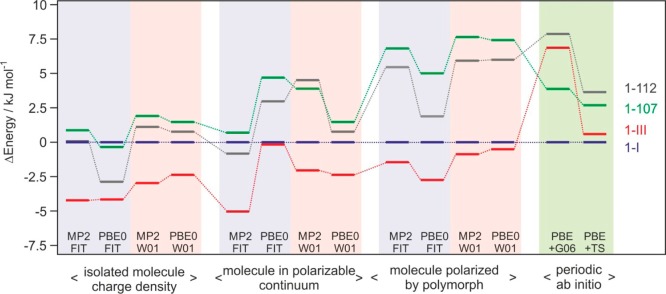
Lattice energy differences of the four methyl paraben polymorphs. Isolated molecule charge density = relaxed structures obtained using the CrystalOptimizer methodology; molecule in polarizable continuum = relaxed structures with average polarization from the PCM model; molecule polarized by polymorph = relaxed structures with the addition of the induction energy; periodic ab initio = density functional theory relaxations with dispersion correction. PBE0 or MP2: PBE0/6-31G(d,p) or MP2/6-31 (d,p) level of theory used for calculating molecular geometry and charge density; FIT or W01: FIT or Williams01 repulsion-dispersion potential parameters; G06 or TS: Grimme or Tkatchenko and Scheffler dispersion corrections. Tie lines have been added to show the changes in relative ordering.
The application of different methods affords insights into the complex interplay of factors stabilizing the polymorphs. Although the experimental conformations are very similar, the corresponding differences in conformational energies, ΔΔEintra < 1.5 kJ mol–1, are still comparable to the calculated energy differences between pairs of polymorphs. There is no a priori reason to believe that more reliable results for methyl paraben will be given by Williams01 or FIT repulsion-dispersion parameters (both potentials are experimentally fitted); MP2 or PBE0 charge densities (both include electron correlation and are better than the PBE functional in the periodic electronic structure calculations); or the G06 or TS semiempirical dispersion correction.
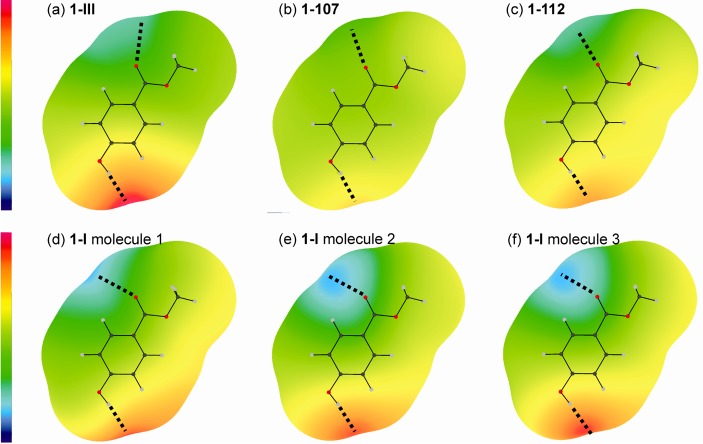
The contribution of electrostatic forces to the lattice energy is smaller than the contribution of repulsion-dispersion. However, strong electrostatic potentials are associated with the para-hydroxyl proton (positive) and the C=O oxygen (negative) in all six conformers, as a result of the strong O–H···O=C intermolecular interactions (Figure 10). Those intermolecular potentials that incorporate the induction energy (Figures 10 and 11c) take into account how the charge density of the molecule adjusts to the specific crystalline environment in the polymorph. They are a considerable improvement over the isolated molecule (Figure 11a) and PCM models (Figure 11b), which are based on the assumption that the electron density of a molecule in the crystal is independent of the position of the surrounding molecules. The polarization in the regions of the C=O oxygen and para-hydroxyl proton is large compared to the electrostatic energies and different in each of the polymorphs/conformers (Figure 10). The induction effects are smaller in the metastable forms 1-107 and 1-112 and larger in 1-III and 1-I (Figure 10), induced by the close proximity of the C(3)–H proton (meta) to the para-hydroxyl group in 1-III and of the −CH3 groups to the C=O groups in 1-I. The total variation with induction affects the lattice energies of 1 significantly, stabilizing 1-I by ∼6 kJ mol–1, 1-III by ∼3.5 kJ mol–1, and 1-112 by <1 kJ mol–1 relative to 1-107.
Figure 10.
(a–f) Electrostatic potential difference plots (“molecule polarized by polymorph” – “isolated molecule charge density”) around conformers of 1 on a surface defined by twice the atomic van der Waals radii58 (with a zero radius for polar hydrogen atoms to reflect the close distances in hydrogen bonds), calculated from the distributed multipoles of the PBE0/6-31G(d,p) molecular charge densities and plotted using ORIENT.59 The scale runs from −0.55 eV (−53.07 kJ mol–1, blue) to +0.45 eV (43.42 kJ mol–1, red). O–H···O=C intermolecular interactions indicated with dotted lines.
Figure 11.

Different models for the charge density around the 1-III conformer on a surface defined by twice the atomic van der Waals radii58 (with a zero radius for polar hydrogen atoms to reflect the close distances in hydrogen bonds), calculated from the distributed multipoles of the PBE0/6-31G(d,p) molecular charge densities and plotted using ORIENT:59 as calculated for (a) an isolated molecule; (b) a molecule in a polarized continuum; and (c) following polarization in the crystal. The scale runs from −0.95 eV (−91.66 kJ mol–1, blue) to +1.35 eV (130.26 kJ mol–1, red).
Dispersion is a major stabilizing factor as seen by the sensitivity to dispersion correction and its effect on the 0 K densities (Supporting Information, Table S3). The relative energy ranking changed substantially after a relaxation with DFT including the dispersion correction, and 1-I became the most stable structure as a result (Figure 9). Periodic electronic structure calculations have the advantage that they do not require a separation between intermolecular and intramolecular interactions and that polarization is automatically modeled well. However, the modeling of these interactions is severely limited by the quality of the PBE charge density,57 which is the best that could be afforded. The correct modeling of the dispersion forces is critical.60 This is shown by a comparison between two state-of-the-art dispersion corrections for organic molecules, which lead to results that are qualitatively and quantitatively different.
Conclusions
The methyl paraben polymorphic system is an example of geometrical diversity arising from a single supramolecular synthon.61 The characteristics of two polymorphs (1-I, 1-III) can be easily reconciled with the original reports from the 1930s,1−3 while one or both of the metastable forms 1-107 and 1-112 are reported here for the first time. Further investigations are currently under way to confirm the identity of other polymorphs of methyl paraben and to establish phase relationships and transformation pathways.
The crystallographically independent molecules of the stable form 1-I were shown to be related by local symmetry elements. Therefore, the occurrence of Z′ = 3 may be understood in terms of local symmetry preferences that are incompatible with the space group symmetry of this structure. We have previously reported a few similar examples36−38 and assume that many Z′ > 1 structures can be interpreted in a similar fashion. The formation of crystal structures with “wasted molecular inversion symmetry” recently discussed by Bond62 is an analogous phenomenon. The analysis of 1-I was based on a geometry comparison of its distinct molecular environments with the XPac method, which has the advantage that individual data points and molecule/molecule arrangements are intrinsically linked together. The analysis of molecular environments is increasingly recognized as a powerful tool to evaluate and compare crystal structures,36e and other methods include the visual inspection of 2D Hirshfeld fingerprint plots63 (Figure 5 of ref (10) depicts the three plots for 1-I) and distance/energy plots proposed by Gavezzotti.64
The calculations demonstrated that improvements in the quality of the molecular or crystal charge density and the other approximations made in representing the intra- and intermolecular forces are needed to accurately calculate stability (energy) differences between polymorphs. Polarization and dispersion interactions, significant contributions to the lattice energy, are often inadequately represented by readily available model intermolecular potentials and computationally affordable periodic DFT methods.18b The applied methods are good enough for crystal structure prediction studies, as all polymorphs were calculated to be within the energy range normally considered for experimental polymorphs. However, currently calculations are unable to give conclusive results on the 0 K stability order of the methyl paraben polymorphs. While the computational results are ambiguous with regard to the 0 K order of stability of 1-I and 1-III, experimental evidence clearly indicates 1-I as the stable polymorph at room temperature and that forms 1-I and 1-III are monotropically related.65,66 These results appear to contradict the view that any polymorphic system should tend to a lowest Z′ = 1 form36d and the proposed interpretation of Z′ > 1 structures as high energy polymorphs that manifest “incomplete or interrupted crystallisation”. Measuring and computing polymorphic energy differences can be a challenge, particularly when metastable forms are only obtained as mixed phases and when the energy differences are small.
Acknowledgments
We thank Franziska Walser for experimental assistance, Sarah L. Price for helpful discussions, and Volker Kahlenberg for access to X-ray facilities used for this study. Other resources used were from EPSRC funding of Control and Prediction of the Organic Solid State www.cposs.org.uk. D.E.B. acknowledges financial support from the Hertha Firnberg Programme of the Austrian Science Fund (FWF, Project T593-N19).
Supporting Information Available
(a) Crystallographic information files (CIF); (b) molecular structures determined by single crystal structure analysis; (c) simulated PXRD patterns; (d) details of the XPac comparisons; (e) details of the modeling of the experimental forms of 1; (f) DSC data for the transition from 1-III to 1-I. This material is available free of charge via the Internet at http://pubs.acs.org.
The authors declare no competing financial interest.
Supplementary Material
References
- Fischer V. R.; Stauder F. Mikrochemie 1930, 8, 330–336. [Google Scholar]
- Kofler L.; Kofler A. Mikrochemie 1931, 8, 45–51. [Google Scholar]
- Lindpaintner E. Mikrochemie 1939, 27, 21–41. [Google Scholar]
- Lin X. Chin. J. Struct. Chem. 1983, 2, 213–218. [Google Scholar]
- Allen F. H. Acta Crystallogr., Sect. B: Struct. Sci. 2002, 58, 380–388. [DOI] [PubMed] [Google Scholar]
- Vujovic D.; Nassimbeni L. R. Cryst. Growth Des. 2006, 6, 1595–1597. [Google Scholar]
- Threlfall T. L.; Gelbrich T. Cryst. Growth Des. 2007, 7, 2297–2297. [Google Scholar]
- Fun H.-K.; Jebas S. R. Acta Crystallogr., Sect. E.: Struct Rep. Online 2008, 64, o1255. [DOI] [PMC free article] [PubMed] [Google Scholar]
- This is evidenced by an XPac comparison (dissimilarity index x = 0.1) – the transformation matrix [1̅00.01̅0.101] converts the unit cell of this structure model into that of CEBGOF01 (for details, see Supporting Information, Figure S5)
- Nath N. K.; Aggarwal H.; Nangia A. Cryst. Growth Des. 2011, 11, 967–971. [Google Scholar]
- Gelbrich T.; Hursthouse M. B. CrystEngComm 2005, 7, 324–336. [Google Scholar]
- Giordano F.; Bettini R.; Donini C.; Gazzaniga A.; Caira M. R.; Zhang G. G. Z.; Grant D. J. W. J. Pharm. Sci. 1999, 88, 1210–1216. [DOI] [PubMed] [Google Scholar]
- CrysAlis CCD and CrysAlis RED; Oxford Diffraction Ltd.: Abingdon, Oxford, England, 2003.
- SMART, SAINT and SADABS; Bruker AXS Inc.: Madison, WI, 1997.
- Sheldrick G. M.SADABS, Version 2007/7; Bruker AXS Inc.; Madison, Wisconsin, USA, 2007.
- Sheldrick G. M. Acta Crystallogr., Sect. A: Fundam. Crystallogr. 2008, 64, 112–122. [DOI] [PubMed] [Google Scholar]
- Gelbrich T.; Threlfall T. L.; Hursthouse M. B. CrystEngComm 2012, 5454–5464. [Google Scholar]
- a Bardwell D. A.; Adjiman C. S.; Arnautova Y. A.; Bartashevich E.; Boerrigter S. X. M.; Braun D. E.; Cruz-Cabeza A. J.; Day G. M.; Della Valle R. G.; Desiraju G. R.; van Eijck B. P.; Facelli J. C.; Ferraro M. B.; Grillo D.; Habgood M.; Hofmann D. W. M.; Hofmann F.; Jose K. V. J.; Karamertzanis P. G.; Kazantsev A. V.; Kendrick J.; Kuleshova L. N.; Leusen F. J. J.; Maleev A. V.; Misquitta A. J.; Mohamed S.; Needs R. J.; Neumann M. A.; Nikylov D.; Orendt A. M.; Pal R.; Pantelides C. C.; Pickard C. J.; Price L. S.; Price S. L.; Scheraga H. A.; van de Streek J.; Thakur T. S.; Tiwari S.; Venuti E.; Zhitkov I. K. Acta Crystallogr., Sect. B: Struct. Sci. 2011, 67, 535–551. [DOI] [PMC free article] [PubMed] [Google Scholar]; b Habgood M.; Price S. L.; Portalone G.; Irrera S. J. Chem. Theory Comput. 2011, 7, 2685–2688. [DOI] [PubMed] [Google Scholar]
- Clark S. J.; Segall M. D.; Pickard C. J.; Hasnip P. J.; Probert M. J.; Refson K.; Payne M. C. Z. Kristallogr. 2005, 220, 567–570. [Google Scholar]
- Perdew J. P.; Burke K.; Ernzerhof M. Phys. Rev. Lett. 1996, 77, 3865–3868. [DOI] [PubMed] [Google Scholar]
- Vanderbilt D. Phys. Rev. B 1990, 41, 7892–7895. [DOI] [PubMed] [Google Scholar]
- Grimme S. J. Comput. Chem. 2006, 27, 1787–1799. [DOI] [PubMed] [Google Scholar]
- Tkatchenko A.; Scheffler M. Phys. Rev. Lett. 2009, 102, 073005. [DOI] [PubMed] [Google Scholar]
- Monkhorst H. J.; Pack J. D. Phys. Rev. B 1976, 13, 5188–5192. [Google Scholar]
- Kazantsev A. V.; Karamertzanis P. G.; Adjiman C. S.; Pantelides C. C. J. Chem. Theory Comput. 2011, 7, 1998–2016. [DOI] [PubMed] [Google Scholar]
- Frisch M. J.; Trucks G. W.; Schlegel H. B.; Scuseria G. E.; Robb M. A.; Cheeseman J. R.; Montgomery J.; Vreven T.; Kudin K. N.; Burant J. C.; Millam J. M.; Iyengar S. S.; Tomasi J.; Barone V.; Mennucci B.; Cossi M.; Scalmani G.; Rega N.; Petersson G. A.; Nakatsuji H.; Hada M.; Ehara M.; Toyota K.; Fukuda R.; Hasegawa J.; Ishida M.; Nakajima T.; Honda Y.; Kitao O.; Nakai H.; Klene M.; Li X.; Knox J. E.; Hratchian H. P.; Cross J. B.; Bakken V.; Adamo C.; Jaramillo J.; Gomperts R.; Stratmann R. E.; Yazyev O.; Austin A. J.; Cammi R.; Pomelli C.; Ochterski J.; Ayala P. Y.; Morokuma K.; Voth G. A.; Salvador P.; Dannenberg J. J.; Zakrzewski V. G.; Dapprich S.; Daniels A. D.; Strain M. C.; Farkas O.; Malick D. K.; Rabuck A. D.; Raghavachari K.; Foresman J. B.; Ortiz J. V.; Cui Q.; Baboul A. G.; Clifford S.; Cioslowski J.; Stefanov B. B.; Liu G. L.; iashenko A.; Piskorz P.; Komaromi I.; Martin R. L.; Fox D. J.; Keith T.; Al Laham M. A.; Peng C. Y.; Nanayakkara A.; Challacombe M.; Gill P. M. W.; Johnson B.; Chen W.; Wong M. W.; Gonzalez C.; Pople J. A.. Gaussian 03, Gaussian Inc.: Wallingford, CT, 2003.
- Stone A. J. J. Chem. Theory Comput. 2005, 1, 1128–1132. [DOI] [PubMed] [Google Scholar]
- Stone A. J.GDMA: A Program for Performing Distributed Multipole Analysis of Wave Functions Calculated Using the Gaussian Program System, version 1.0; University of Cambridge: Cambridge, U.K., 1999.
- Coombes D. S.; Price S. L.; Willock D. J.; Leslie M. J. Phys. Chem. 1996, 7352–7360. [Google Scholar]
- Williams D. E. J. Comput. Chem. 2001, 22, 1154–1166. [Google Scholar]
- Price S. L.; Leslie M.; Welch G. W. A.; Habgood M.; Price L. S.; Karamertzanis P. G.; Day G. M. Phys. Chem. Chem. Phys. 2010, 12, 8478–8490. [DOI] [PubMed] [Google Scholar]
- a Cossi M.; Scalmani G.; Rega N.; Barone V. J. Chem. Phys. 2002, 117, 43–45. [Google Scholar]; b Cossi M.; Barone V.; Mennucci B.; Tomasi J. Chem. Phys. Lett. 1998, 286, 253–260. [Google Scholar]; c Mennucci B.; Tomasi J. J. Chem. Phys. 1997, 106, 5151–5158. [Google Scholar]
- Cooper T. G.; Hejczyk K. E.; Jones W.; Day G. M. J. Chem. Theory Comput. 2008, 4, 1795–1805. [DOI] [PubMed] [Google Scholar]
- a Misquitta A. J.; Stone A. J. J. Chem. Theory Comput. 2007, 4, 7–18. [DOI] [PubMed] [Google Scholar]; b Misquitta A. J.; Stone A. J.; Price S. L. J. Chem. Theory Comput. 2007, 4, 19–32. [DOI] [PubMed] [Google Scholar]; c Welch G. W. A.; Karamertzanis P. G.; Misquitta A. J.; Stone A. J.; Price S. L. J. Chem. Theory Comput. 2008, 4, 522–532. [DOI] [PubMed] [Google Scholar]
- Misquitta A. J.; Stone A. J.. CamCASP: a program for studying intermolecular interactions and for the calculation of molecular properties in distributed form; University of Cambridge: Cambridge, U.K., 2007.
- a Steiner T. Acta Crystallogr., Sect. B: Struct. Sci. 2000, 56, 673–676. [DOI] [PubMed] [Google Scholar]; b Steed J. W. CrystEngComm 2003, 5, 169–179. [Google Scholar]; c Anderson K. M.; Steed J. W. CrystEngComm 2007, 9, 328–330. [Google Scholar]; d Desiraju G. R. CrystEngComm 2007, 9, 91–92. [Google Scholar]; e Bernstein J. Cryst. Growth Des. 2011, 11, 632–650. [Google Scholar]
- Gelbrich T.; Hughes D. S.; Hursthouse M. B.; Threlfall T. L. CrystEngComm 2008, 10, 1328–1334. [Google Scholar]
- Vrcelj R. M.; Sherwood J. N.; Kennedy A. R.; Gallagher H. G.; Gelbrich T. Cryst. Growth Des. 2003, 3, 1027–1032. [Google Scholar]
- Gelbrich T.; Hursthouse M. B. CrystEngComm 2006, 8, 448–460. [Google Scholar]
- Gelbrich T.; Rossi D.; Griesser U. J. Acta Crystallogr., Sect. C: Cryst. Struct. Commun. 2012, 68, o65–o70. [DOI] [PubMed] [Google Scholar]
- a Etter M. C.; MacDonald J. C.; Bernstein J. Acta Crystallogr., Sect. B: Struct. Sci. 1990, 46, 256–262. [DOI] [PubMed] [Google Scholar]; b Bernstein J.; Davis R. E.; Shimoni L.; Chang N.-L. Angew. Chem., Int. Ed. 1995, 34, 1555–1573. [Google Scholar]
- The term “supramolecular construct” (SC) denotes the specific spatial geometry of a finite cluster (0D) or extended (1D, 2D, or 3D) arrangement of molecules in a crystal structure.11 Thus, two crystals have an SC in common if they contain geometrically similar subcomponents, manifested by sets of matching internal coordinates. This term only implies geometrical closeness. By contrast, “supramolecular synthons” are defined as “structural units within supermolecules which can be formed and/or assembled by known or conceivable synthetic operations involving intermolecular interactions”.61 The O–H···O=C bonded supramolecular synthon generates a catemer which is found in all four polymorphs of methyl paraben. In this set, no common SCs are associated with this synthon as the spatial geometries of the resulting O–H···O=C bonded chains are all fundamentally different from each other (Figure 4).
- Lin X. Chin. J. Struct. Chem. 1986, 5, 281–286. [Google Scholar]
- Herrera A. M.; Bernès S.; López D. Acta Crystallogr., Sect. E.: Struct Rep. Online 2003, 59, o1522–o1524. [Google Scholar]
- Doriguetto A. C.; de Paula Silva C. H. T.; Rando D. G.; Ferreira E. I.; Ellena J. Acta Crystallogr., Sect. C: Cryst. Struct. Commun. 2004, C60, o69–o71. [DOI] [PubMed] [Google Scholar]
- Brisse F.; Pérez S. Acta Crystallogr., Sect. B: Struct. Sci. 1976, 32, 2110–2115. [Google Scholar]
- Yathirajan H. S.; Narasegowda R. S.; Nagaraja P.; Bolte M. Acta Crystallogr., Sect. E.: Struct Rep. Online 2005, 61, o179–o181. [Google Scholar]
- Dai C.; Yuan Z.; Collings J. C.; Fasina T. M.; Thomas R. L.; Roscoe K. P.; Stimson L. M.; Yufit D. S.; Batsanov A. S.; Howard J. A. K.; Marder T. B. CrystEngComm 2004, 6, 184–188. [Google Scholar]
- Yathirajan H. S.; Bindya S.; Sarojini B. K.; Narayana B.; Bolte M. Acta Crystallogr., Sect. E.: Struct Rep. Online 2007, 63, o1334–o1335. [DOI] [PMC free article] [PubMed] [Google Scholar]
- Saeed A.; Rafique H.; Flörke U. Acta Crystallogr., Sect. E.: Struct Rep. Online 2008, 64, o821. [DOI] [PMC free article] [PubMed] [Google Scholar]
- Lin X. Chin. J. Struct. Chem. 1983, 2, 219–223. [Google Scholar]
- Chan E. J.; Rae A. D.; Welberry T. R. Acta Crystallogr., Sect. B: Struct. Sci. 2009, 65, 509–515. [DOI] [PubMed] [Google Scholar]
- Bolte M.; Wissler J. Acta Crystallogr., Sect. E.: Struct Rep. Online 2006, 62, o1192–o1193. [Google Scholar]
- Brock C. Acta Crystallogr., Sect. C: Cryst. Struct. Commun. 1987, 43, 1784–1786. [Google Scholar]
- Burns J. H.; Hagaman E. W. Acta Crystallogr., Sect. C: Cryst. Struct. Commun. 1993, 49, 1393–1396. [Google Scholar]
- Zhou Y.; Matsadiq G.; Wu Y.; Xiao J.; Cheng J. Acta Crystallogr., Sect. E.: Struct Rep. Online 2010, 66, o485. [DOI] [PMC free article] [PubMed] [Google Scholar]
- Griffiths G. I. G.; Misquitta A. J.; Fortes A. D.; Pickard C. J.; Needs R. J. J. Chem. Phys. 2012, 137, 064506. [DOI] [PubMed] [Google Scholar]
- Bondi A. J. Phys. Chem. 1964, 68, 441–451. [Google Scholar]
- Stone A. J.; Dullweber A.; Engkvist O.; Fraschini E.; Hodges M. P.; Meredith A. W.; Nutt D. R.; Popelier P. L. A.; Wales D. J.. ORIENT: A Program for Studying Interactions between Molecules, version 4.6; University of Cambridge: Cambridge, U.K., 2006.
- Klimeš J.; Michaelides A. J. Chem. Phys. 2012, 137, 120901–120912. [DOI] [PubMed] [Google Scholar]
- Desiraju G. R. Angew. Chem., Int. Ed. 1995, 34, 2311–2327. [Google Scholar]
- Bond A. D. CrystEngComm 2010, 12, 2492–2500. [Google Scholar]
- a Spackman M. A.; Jayatilaka D. CrystEngComm 2009, 11, 19–32. [Google Scholar]; b McKinnon J. J.; Jayatilaka D.; Spackman M. A. Chem. Commun. 2007, 3814–3816. [DOI] [PubMed] [Google Scholar]
- Bernstein J.; Dunitz J. D.; Gavezzotti A. Cryst. Growth Des. 2008, 8, 2011–2018. [Google Scholar]
- Differential scanning calorimetry experiments have shown an exothermic solid–solid transition from 1-III to 1-I (Supporting Information, Figure S14). It follows from the order of melting points and the exothermic transition on heating that the two polymorphs are monotropically related (heat of transition rule; see ref (66)).
- Burger A.; Ramberger R. Microchim. Acta 1979, 72, 259–271. [Google Scholar]
Associated Data
This section collects any data citations, data availability statements, or supplementary materials included in this article.


