Abstract
Objective
Despite numerous examinations of factors affecting P300 speller performance, the impact of stimulus presentation parameters remains incompletely understood. This study examines the effects of four distinct stimulus presentation parameters (stimulus-off time [ISI*], interstimulus interval [ISI], flash duration, and flash-duration: ISI ratio) on the accuracy and efficiency of the P300 speller performance.
Methods
EEG data from a 32-electrode set were recorded from six subjects using a row-column paradigm of the speller task and analyzed offline.
Results
P300 speller accuracy is affected by the number of trial repetitions (F(14,354)= 69.002, p<0.0001), as expected. In addition, longer ISI and ISI* times resulted in higher accuracy and characters per minute [CPM] rates. Subsets of the entire group (i.e. good vs. poor performers) were compared to show consistency of performance trends despite great variance among subjects. Moreover, the same significant effects were observed whether using the entire 32-electrode dataset or the reduced 8-channel set described by Sharborough et al., 1991.
Conclusions
Despite variability in user performance, both ISI* and ISI can affect P300 speller performance.
Significance
P300 system optimization must consider critical stimulus timing features including ISI* and ISI. Further characterization of the impact of these timing features in online experiments is warranted and the differential effect on accuracy and CPM should be more comprehensively explored.
Keywords: P300, Brain-computer interface, Neuroprosthesis
1. Introduction
People devastated by severe neuromuscular disease, such as amyotrophic lateral sclerosis, high spinal cord injuries, or brainstem strokes, share the possible ultimate fate of the “locked-in” syndrome in which cognitive function is maintained, but voluntary movement and communication abilities are impaired.
The P300-based speller, originally introduced by Farwell and Donchin (1988), enables locked-in patients to select characters from a matrix presented on a computer screen by analyzing and classifying electroencephalographic (EEG) signals. Flashing of an attended character elicits an event-related potential (ERP) that distinguishes target from non-target characters. Although traditionally referred to as a P300 speller, classification usually includes features both from the occipital lobe (visual-evoked potentials) as well as the P300 response, a positive deflection in the EEG over the parietal cortex that appears about 300 ms after an “oddball” stimulus (Townsend et al., 2011).
Traditionally, a fixed, or preset, number of evoked responses are averaged in order to increase the signal-to-noise ratio (SNR). In the most commonly used “rows and columns” version (RCP) of the P300 speller, each row and column flashes once in every trial (i.e., 12 flashes for a 6×6 character matrix) with up to 15 trials repeated for each selection. This sequence results in relatively slow typing speed, motivating many studies to optimize system efficiency by changing grid size (Sellers et al., 2006), interstimulus interval (ISI) (McFarland et al., 2003; McFarland et al., 2011), signal processing methods (Krusienski et al., 2006; Kaper et al., 2004), and flashing paradigm (Townsend et al., 2011; Jin et al., 2011). Townsend et al. (2011) modified the standard RCP and suggested a novel checkerboard paradigm (CBP). The paradigm flashes six separate characters from random locations in the matrix instead of grouping characters by row or column, eliminating adjacency errors caused by sequential stimulation of adjacent rows and columns. With five complete repetitions, which included ten target flashes, the mean online accuracy improved from 77% using the RCP to 92% using the CBP. Mean bit rate was also significantly increased from 19 bits/min for the RCP up to 23 bits/min for the CBP (Townsend et al., 2011).
While the CBP significantly improves performance, the effect of stimulus presentation parameters, including flash duration and interstimulus intervals, on the efficiency and accuracy of the original RCP remain relatively under-characterized. Specifically, strategies to improve performance have included modifications to flashing paradigms to increase target-to-target intervals so as to improve the p300 “oddball” response and prevent overlapping responses that can complicate target classification (Jin et al., 2011; Gonsalvez and Polich, 2002). A handful of studies have specifically analyzed the effect of stimulus presentation parameters, including interstimulus interval and flash duration on accuracy rates and system performance. Allison and colleagues, for example, investigated the effect of two different ISI (125 msec and 500 msec) on accuracy rates and reported improved accuracy with longer ISI but did not explore the effect of ISI on bit rate nor the potential impact of other stimulus timing parameters (e.g., flash duration or stimulus “off” time) on system accuracy or performance (Allison and Pineda, 2006). In the same year, Sellers and colleagues explored the effect of ISI on accuracy on P300 performance and found that shorter ISI were generally associated with superior accuracy and bit rates (Sellers et al., 2006). Like Allison and colleagues, however, they did not explore in detail the impact of other potentially important stimulus timing parameters.
McFarland and colleagues presented the most comprehensive study to date of the effect of stimulus timing parameters on P300 performance (McFarland et al., 2011), conducting two separate experiments to investigate these issues. In their first experiment, ISI was varied and flash duration was maintained at a constant 50% of ISI and the authors found that longer ISI resulted in improved accuracy. To address the question of whether this differential response pattern was in fact due to ISI effects, flash duration effect (because each ISI had a distinct flash duration), or due to changes in stimulus “off” time, the authors conducted a second set of experiments in which these factors were varied but found on statistical testing only a main effect of ISI (McFarland et al., 2011). These studies however were done with the CBP flashing paradigm and it is unclear how these observations can be extended to RCP flashing paradigms given that CBP results in different patterns of evoked potentials compared to RCP (Townsend et al, 2010) and stimulus timing parameters have previously been shown to differentially affect different flashing paradigms (Sellers et al., 2006). Therefore, there remains uncertainty of the effect of most stimulus timing parameters on RCP flashing paradigm. Moreover, there is conflicting results in the literature regarding the effect of ISI on P300 accuracy (Allison and Pineda, 2006; Sellers et al., 2006). There was therefore a need to further investigate the effects of these parameters on P300 performance.
Modest improvements in RCP bit rate have been achieved by modifying stimulus presentation parameters and thereby reducing the time required per trial (e.g., shorter ISI) while maintaining or improving system accuracy. Most such studies, however, have used fixed numbers of trials. In addition to aiming to characterize the effects of stimulus timing parameters on P300 speller accuracy, we hypothesized that greater improvements in efficiency could be achieved by determining stimulus presentation parameters that optimize bit rate (or characters per minute, CPM) rather than focusing on accuracy exclusively. This approach theoretically allows selection of stimulus presentation parameters that may in fact require more time per trial (e.g., longer ISI), but could still improve system efficiency by requiring fewer repetitions or trials per character selection.
We identified four potentially important and modifiable stimulus presentation parameters: flash duration, ISI (time from the onset of one flash to the next flash), ISI* (stimulus-off time or [ISI – flash duration]), and ratio between flash duration and ISI [Ratio]. Whereas longer ISI has been associated with improved accuracy, flash duration and ISI* have been reported to not affect accuracy (McFarland et al., 2011). However, the impact of these factors on system performance without a fixed number of trials has not been studied systematically. Using the standard stepwise linear discriminant analysis (SWLDA) and standard row/column paradigm (RCP) in an offline analysis, this study examined effects of different stimulus presentation parameters on speed and accuracy by using four specifically designed stimulus timing patterns (Krusienski et al, 2006), finding that despite significant interindividual variability that both ISI and ISI* can significantly affect both accuracy and overall performance.
2. Methods
Six adult males ages 22 to 35 participated in this IRB-approved study. Only one subject had prior BCI experience.
2.1 Data Collection
The experiment data were collected in a single two-hour session with each subject. EEG signals were recorded with a 32-electrode cap (Fpz, Fz, FC1, FCz, FC2, FC4, FC6, C4, C6, CP4, CP6, FC3, FC5, C3, C5, CP3, CP5, CP1, P1, Cz, CPz, Pz, POz, CP2, P2, PO7, PO3, O1, Oz, O2, PO4, PO8) and referenced to the right or left mastoid. The signals were amplified with two g.tec (Guger technologies) 16-channel USB biosignal amplifiers, digitized at 256 Hz, and filtered between 0.1 and 60 Hz. The BCI2000 general-purpose system for BCI research was used for data acquisition and experimental design (Schalk et al., 2004).
Table 1 shows the four timing patterns used to vary the parameters of flash duration (ms), ISI* (ms), ISI (ms), and ratio between flash duration and ISI. In order to identify the effect of flash duration, pattern D was designed to have twice as long of a flash duration as patterns A, B, and C. The effects of ISI* and ISI can be seen by comparing patterns A, B, and C, in which the flash duration is held constant. ISI* is held the same in patterns B and C, while ISI is the same in patterns C and D, to allow comparisons between ISI and ISI* effects. The ratio between flash duration and ISI equaled 1:2 for patterns A and D and differed in patterns B and C, allowing assessment of performance based on ratio. While the planned comparison of effects are not completely independent and confound interpretation to some extent, patterns were selected to enable efficient data collection while providing constraints across each timing feature that might provide insight into each feature’s impact on system performance.
Table 1.
Stimulus timing patterns used for all six subjects.
| Pattern | Flash duration (ms) | ISI* (ms) | ISI (ms) = Flash dur + ISI* | Ratio = Flash dur: ISI |
|---|---|---|---|---|
| (A) | 31.25 | 31.25 | 62.5 | 1:2 |
| (B) | 31.25 | 62.5 | 93.75 | 1:3 |
| (C) | 31.25 | 93.75 | 125 | 1:4 |
| (D) | 62.5 | 62.5 | 125 | 1:2 |
Each subject was instructed to stare at an LCD monitor about 1 m away with a 6×6 matrix display of characters and focus on the target character, attending to the number of times it flashed. Each character flashed within an entire row or column in the RCP introduced by Farwell and Donchin (1988). Each word to be spelled consisted of five letters and was presented above the matrix with the current target letter shown in parentheses at the end of the word. Every row and column flashed once randomly (12 flashes) per trial. Fifteen trials (or repetitions) were conducted per letter selection. No feedback was given during these trials. In order to ensure attentiveness, subjects were asked to count each time the target letter flashed. Subjects spelled a total of 15 words in the single session, three words under each pattern except for pattern C with a flash duration of 31.25ms and ISI* of 93.75ms, which had six words.
2.2 Data Analysis
BCI2000 was used for data acquisition and analysis was performed offline using MATLAB (Schalk et al., 2004). SWLDA, a classification algorithm that selects a set of signal features to include in a discriminant function, was used to extract the P300 event-related potentials (ERPs) (Krusienski et al., 2006). We used leave-one-out cross-validation by letter to assess accuracy. Under each pattern, the linear classifier was trained on 14 or 29 letters and tested on the excluded letter, and then repeated in the set of letters spelled in each stimulus timing pattern. The signals in the training set are assigned one of two class labels based on whether the signals corresponded to flashes containing the target character or non-target characters. Each new signal is reduced to a score that reflects how similar it is to the target class. The algorithm uses ordinary least-squares regression to predict class labels for the training set. It adds the features that are most significant in the forward stepwise analysis and removes the least significant features in the backward analysis step. These steps are repeated until either a set number of features is met or it reaches a state where no features are added or removed (Krusienski et al., 2006).
To assess whether the observed results could be generalized to the previously described and published reduced 8-electrode set described by Sharborough et al. (1991), results were also produced for a subset of eight channels (Fz, Cz, PO3, Pz, PO4, PO7, PO8, Oz) in an identical manner as that described for the entire channel set, in order to compare results with that obtained with the larger 32-channel set.
The number of characters per minute (CPM) was computed for each trial as the difference between the number correct (P) and the number wrong (1-P) divided by the total time in minutes, excluding the time between trials (McFarland et al., 2010). Since P-(1-P) =2P-1, . CPM, also known as practical bit rate from Townsend et al. (2011), accounts for error correction, which requires a minimum of two additional selections: a backspace then a correct selection.
3. Results
3.1 Effect of Stimulus Timing Patterns on Accuracy
Analysis of the entire dataset using a mixed model revealed a significant effect of trials or sets of flashes (F(14,354)= 69.002, p<0.0001) and pattern used (F(3,354)=117.512,p<0.0001), as well as a significant interaction between these factors (F(3,354)=3.931,p<0.009). Performance under each of the four patterns was further investigated using pairwise comparisons, showing that each pair showed a significant difference in performance (p<0.0001) except for patterns C and D, which both had an ISI of 125ms with differing flash durations of 31.25ms and 62.5ms. Average accuracy for the pattern with the shortest flash duration of 31.25ms and ISI of 62.5ms was lower than performance for the pattern with a 31.25ms flash duration and 93.75ms, which had lower accuracy than the two patterns with highest accuracy values (Figure 1A).
Figure 1.
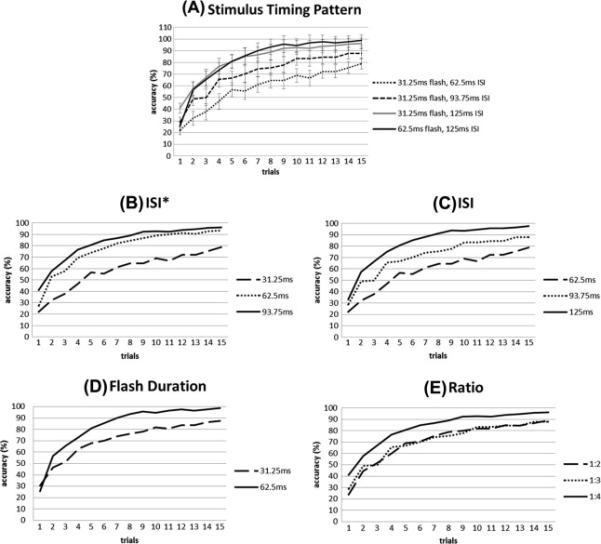
Average classification accuracy for all subjects grouped by (A) stimulus timing pattern, (B) ISI*, (C) ISI, (D) flash duration, and (E) ratio of flash duration to ISI. SEM error bars are included in (A).
3.1.1 Effect of Stimulus Presentation Parameters on Accuracy
ISI*
The parameter ISI* (F(2,264)=157.321, p<0.0001) significantly affected accuracy across the fifteen trials. Pairwise comparisons showed that performance under each of the three ISI* values: 31.25ms, 62.5ms, and 93.75ms, were significantly different. The longest ISI* of 93.75ms was associated with the highest accuracy rates, while the shortest ISI* of 31.25ms was associated with the lowest accuracy values (Figure 1B).
ISI
Variations in ISI (F(2,264)=52.931, p<0.0001) were also significantly associated with accuracy across all trials . Similar to the ISI* parameter, pairwise comparisons again showed that performance under the separate ISI values statistically differed, with the longest ISI and shortest ISI resulting in the highest and lowest accuracy rates, respectively (Figure 1C).
Flash Duration
Flash duration (F(1,174)=105.041, p<0.0001) was also a significant factor in determining accuracy. The stimulus timing pattern with the longer flash duration of 62.5ms demonstrated significantly higher accuracy rates than the other three patterns with shorter flash durations of 31.25ms (Figure 1D).
Ratio
Ratio of flash duration to ISI (F(2,264) = 54.982, p < 0.0001) was also found to be significantly associated with accuracy. Stimulus timing patterns A and D with a flash duration to ISI ratio of 1:2 and pattern B with a ratio of 1:3 showed statistically identical performance. Pattern C with a flash duration of 31.25ms and ISI of 125ms, giving a ratio of 1:4 showed significantly higher accuracy values (Figure 1E).
3.1.2 Consistency of Accuracy between Good and Bad Performers
To assess the effect of stimulus timing pattern on subsets of the subjects, we performed secondary analyses. The six subjects were divided in into the top three performers (Figure 2A) and the bottom three performers (Figure 2B). Overall results from the entire group, good performers, and bad performers remained consistent as the lowest accuracy rates in each subset resulted from the pattern with the shortest 31.25ms flash duration and 62.5ms ISI. The two patterns associated with the best accuracy (both with an ISI of 125ms) were statistically indistinguishable, but the two patterns with shorter ISIs at 62.5ms and 93.75ms showed significantly different results from each other and from the former two patterns.
Figure 2.
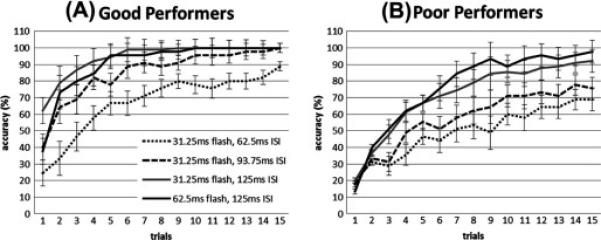
Average classification accuracies grouped by timing pattern comparing good performers (A) to bad performers (B).
3.2 Effect of Stimulus Timing Patterns on CPM
Statistical analysis using a mixed model revealed significant effects of stimulus timing pattern on CPM rates (F(3,354) = 2.888, p < 0.036). Pairwise comparisons showed that accuracy under pattern A with flash duration of 31.25ms and ISI of 62.5ms was significantly different from patterns C and D (p < 0.008 and p < 0.027, respectively), which both had 125ms long ISIs. Patterns C and D, however, were not statistically significant. The timing pattern with a flash duration of 31.25 ms and an ISI of 125 ms resulted in the highest average group CPM values within the first five flash repetitions after which, the timing pattern with a flash duration of 62.5ms and ISI of 125ms was associated with higher CPM (Figure 3A).
Figure 3.
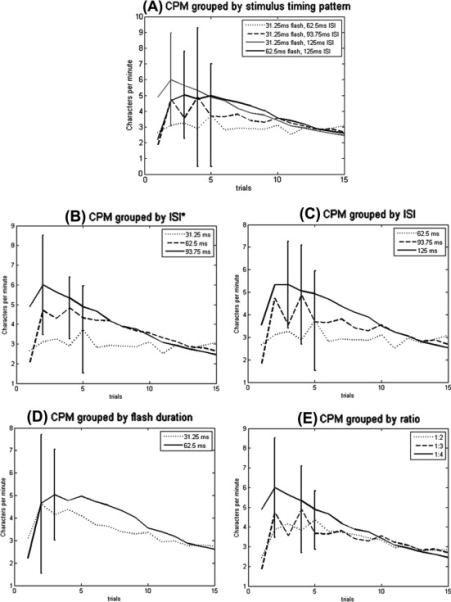
Average characters per minute for all subjects grouped by (A) stimulus timing pattern, (B) flash duration, (C) ISI*, (D) ISI, and (E) ratio of flash duration to ISI. SEM error bars are included for the largest CPM point of each average trend line.
3.2.1 Significance of Stimulus Presentation Parameters on CPM
ISI*
ISI* was significantly affected observed CPM (F(2,264) = 3.950, p < 0.02). Consistent with accuracy results, high CPM rates resulted from the longest ISI*, which were significantly different from CPM rates from the shortest ISI* (p < 0.006) (Figure 3B).
ISI
The effect of ISI (F(2,264) = 2.995, p < 0.052) on CPM was marginally significant. Post-hoc analysis revealed that performance under the longest ISI of 125ms was significantly better than under the shortest ISI of 62.5ms (p < 0.015) (Figure 3C).
Flash duration and ratio between the flash duration and ISI did not significantly affect observed CPM rates.
3.2.2 Consistency of CPM on Good and Bad Performers
As with the analysis of accuracy rates, the effect of each factor was also assessed in subsets of the subjects studied: good and poor performers (Figure 4A and 4B, respectively). The effect of stimulus timing patterns in “good performers” mirrored the overall results (Figure 3A). Interestingly however, the effect of stimulus timing patterns on CPM in poor performers was different, with timing pattern D (with the longest flash duration of 62.5ms and ISI of 125ms) consistently displaying superior results. This is in contrast to the good performers in which pattern C (with a 31.25ms flash duration and 125ms ISI ) tended to have superior CPM rates for the first five trials.
Figure 4.
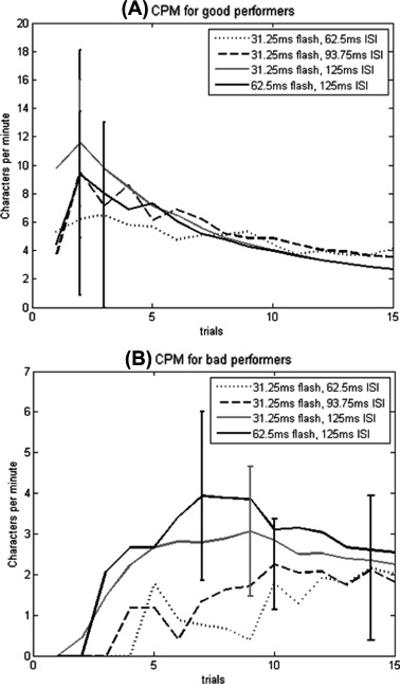
Average characters/min grouped by timing pattern comparing good performers (A) to bad performers (B).
3.3 P300 Waveforms
Average amplitudes and latencies for the P300 waveforms at electrode Pz during each stimulus timing pattern are shown in Figure 5. The P300 peaks begin at about 300 ms and peaks at approximately 400ms for every pattern, and the magnitude of the peak increases with greater ISI, consistent with our accuracy and CPM results. The peaks in the non-target waveforms likely represent visual-evoked potentials (VEPs) resulting from and being temporally consistent with ISI for each timing parameter tested.
Figure 5.

Average group waveforms at Pz for each stimulus timing pattern. Waveforms for targets are represented by the solid black line and waveforms for non-targets are represented by the dotted line.
Figure 6 shows the average evoked response of the good performers compared to the poor performers. The P300 peak for the good performers has higher amplitude than that for the poor performers, which provides some explanation for the differences in accuracy and CPM results between groups.
Figure 6.
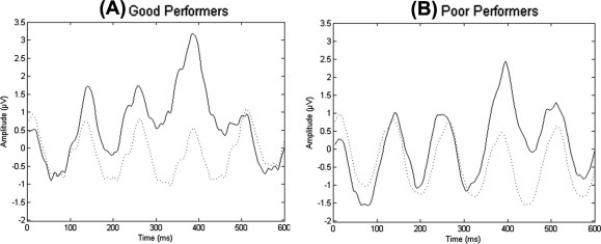
Average waveforms at Pz for good performers (solid black) compared to poor performers (dotted black) under pattern C with a flash duration of 31.25ms and ISI of 125ms.
3.4 8 Channel vs. 32 Channel Analysis
A subset of the eight channels from the 32-channel set used for EEG data collection, based on that described by Sharborough et al. (1991), was used to classify accuracy and determine CPM values. The standard set including Fz, Cz, P3, Pz, P4, PO7, PO8, and Oz (Sharborough et al., 1991) was slightly altered due to the constraints of our original 32-channel set. The reduced channel set that produced the results in Figure 7 contained the eight channels: Fz, Cz, PO3, Pz, PO4, PO7, PO8, and Oz. The results demonstrated that a reduced channel set did not significantly affect the accuracy or CPM values for three of the four stimulus timing patterns (Figure 7).
Figure 7.
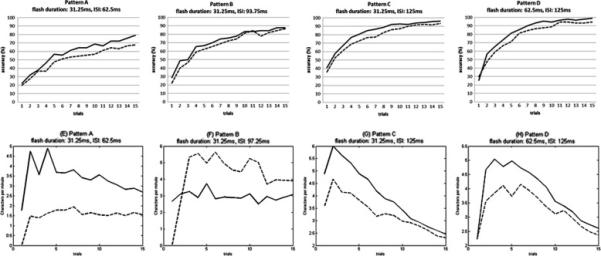
Average classification accuracy (A-D) and CPM (E-H) under the 32-channel set (represented by the solid black line) compared to the 8-channel set (represented by the dashed black line) for each of the four patterns.
4. Discussion
4.1 Significance of Stimulus Presentation Parameters
The P300 speller is potentially a robust communication system for individuals with severely impairing neuromuscular disease that prevents verbal or manual communication. Yet, studies investigating the factors that can optimize system efficiency are few. In this analysis, we investigate four potentially modifiable stimulus presentation parameters to determine their effect on system performance, not only on accuracy, but also CPM.
We confirm prior reports of the significant impact of ISI on accuracy and CPM rates (McFarland et al., 2011; Allison and Pineda, 2006; Sellers et al., 2006, Gonsalvez and Polich, 2002; Croft et al., 2003). Observing the physical waveforms in figure 5, the P300 peaks under patterns C and D with a 125ms ISI show much larger amplitudes compared to patterns A and B with shorter ISIs of 62.5ms and 93.75ms, suggesting that the larger P300 waveforms account for higher accuracy. Gonsalvez and Polich (2002) reported that P300 amplitudes are positively correlated with target-to-target intervals (TTIs). Since longer ISIs necessarily lead to longer TTIs, our results indicating longer ISIs increase accuracy reflect the same conclusion. While Sellers et al. (2006) found apparently opposite results that a shorter 175ms ISI compared to a longer 350ms ISI yielded highest accuracies, the two ISIs tested were both longer than any of the ISI values used in the current study. Taken together, these findings suggest a limit to the beneficial effects of increasing ISI on observed accuracy.
In contrast to previous reports however, we report the new finding that longer ISI* may also significantly improve accuracy and CPM rates (McFarland et al., 2011). While longer ISI* and ISI were both associated with superior CPM rates, comparing the two patterns C and D with a 125ms ISI shows that the timing pattern with a 93.75ms ISI* performs better than that with a 62.5ms ISI*, at least up to five trials where the last CPM curve peaks. Since patterns C and D have the same ISI, any difference in CPM would necessarily depend on differences in accuracy. In observing the P300 waveforms in figure 5, there appears to be a larger difference between non-target and target waveforms under pattern C compared to pattern D. This difference may account for the slightly higher accuracy and significantly higher CPM for pattern C within the first 5 trials.
Likewise, our results indicate that flash duration can impact accuracy, which is inconsistent with previous reports (McFarland et al., 2011). While this contrast in results may be due to differences in experiment paradigms or specific flash lengths tested, flash duration has proved to be important in certain cases, and therefore, cannot be completely ignored.
While the effects of ISI, ISI*, and flash duration cannot be completely separated since the values of ISI* and flash duration are included in the value of ISI, we have shown that ISI* has the same significant and positive effect as ISI on accuracy and CPM, while flash duration only affects accuracy in the cases we tested.
While the reason that these separate though not independent parameters would have different impacts on accuracy and CPM is not necessarily clear. Given the P300 response is an odd-ball response and depends on the relative rarity of the target response, one would suspect that both longer ISI and ISI* would result in a more rare event in the temporal domain. While the impact of increasing ISI has been previously reported and it follows that a target event will occur more infrequently if there is more time between repetitions, we propose that having longer ISI* given a constant ISI makes exposure to the target event more rare and therefore can elicit a more pronounced (and useful) P300 response.
4.2 Accuracy vs. CPM
In optimizing the P300-based BCI system, the goal is to maximize both accuracy and CPM, which are correlated, but do not necessarily improve together. In this study, CPM rates peaked around two or five trials (except for poor performers – figure 5B), and accuracy rates plateaued around eight trials. Both results suggest that 15 trials are more than what is necessary to achieve current peak accuracy and CPM rates, and adversely add time and decrease speed. Reducing the number of trials would increase CPM, optimizing system performance even if accuracy rates have not yet been optimized. The number of trials could either be set to a reduced number, or a dynamic system changing the number of trials as individually needed could be implemented (Speier et al., 2012). Serby et al. (2005) demonstrated a dynamic system that would run an additional trial each time the set threshold was not reached. The study improved accuracy and symbols/min results compared to Farwell and Donchin (1988).
The preference between higher accuracy at a slower rate compared to a faster rate with lower accuracy may depend on the user. Usability of the P300 speller is highest in the 70-95% accuracy range (Citi et al., 2010), proposing that perfect accuracy is not necessary to convey a user’s message, allowing for mistakes and a faster bit rate. Futures studies may aim to assess the ability of users to communicate meaningful messages rather than or in addition to using traditional engineering methods to assess performance.
4.3 Good vs. Poor Performers
Subjects were divided into two groups due to visible disparity between their performances. Despite large differences in accuracy and CPM, both subsets showed the same effects by the significant parameters, ISI and ISI*, demonstrating that these results are applicable to all subjects regardless of performance. As shown in the CPM results, while an ISI of 62.5ms results in poor performance across all subjects, good performers can still do well with a middle length ISI of 93.75ms (Figure 5A). The pattern with the longest flash duration of 62.5ms and ISI of 125ms, which shows the greatest accuracy, actually gives the lowest CPM values by trial 15. While the cause of performance variance among subjects has yet to be identified, it is important to know that performance does not affect parameter analysis. Possible factors contributing to performance variance include attention and motivation. Future research interests lie in determining or predicting the ability of an individual to perform well based on certain measures of attention or motivation.
4.4 32-Channel Set vs. 8-Channel Set
Results from the reduced electrode set did not differ significantly compared to results from using 32 electrodes. Despite consistent results from this comparative analysis using the historically reported reduced 8-electrode set, a more comprehensive analysis of the effect of spatial parameters on system performance is likely needed in future studies. The selection of electrodes should be dictated either by (1) physiological assumptions about the origin of the signal or (2) data-driven approaches that objectively identify which electrodes provide the greatest discriminatory pattern between attended and non-attended stimuli, using methods such as principle or independent component analysis. By identifying the essential components need for target identification, the goal would be to find a reduced channel set that does not diminish accuracy or CPM, but hopefully increases both.
4.5 Limitations
For purposes of this investigation, the timing parameters used in this study were designed to contrast as many factors as possible in order to gain insight into the impact of these timing factors on accuracy and CPM rates. As a result, the timing parameters used were not completely independent of one another, thereby confounding results and interpretation to some extent, possibly resulting in false-negative or false-positive results. Moreover, the current analyses were done in offline analyses and remain to be further characterized and validated in online analyses. Nonetheless, the current results can be used as a starting point for the design of more rigorous and comprehensive analyses of these identified factors. Despite these limitations, this study highlights the need to optimize stimulus presentation parameters not only with respect to accuracy, but also CPM. Since reducing the number of trials would increase CPM values by greatly decrease the amount of time needed, future designs must consider using fewer trials, possibly in a dynamic manner.
4.6 Conclusion
ISI and ISI* were shown to be the most significant parameters in determining P300 speller system accuracy and efficiency. The accuracy and CPM of the P300 speller increased as ISI* and ISI increased. The flash duration and ratio parameters proved to minimally modulate performance. To optimize CPM, which is a surrogate of system performance, a system with fewer trials or a dynamic system must be implemented. The discrepancy between good and bad performers remains to be investigated. Advancement from the standard reduced channel set would be an optimal channel set that will be explored in further research.
Highlights.
In contrast to previous reports, we report that both stimulus-off time and interstimulus interval can significantly affect both accuracy and characters per minute.
System performance varies greatly among users, and therefore needs further characterization in order to individually optimize the speller.
Optimization of stimulus timing parameters should not only consider accuracy rates, but also characters per minute, considering that reductions in accuracy may be more than offset than the time saved resulting in overall improvements in system efficiency.
Acknowledgments
Funding: This work is supported by funds provided by National Institute Of Biomedical Imaging And Bioengineering under Award Number K23EB014326 (NP), the UCLA Scholars in Translational Medicine Program, and the UCLA Department of Neurosurgery Visionary Ball
References
- Allison BZ, Pineda JA. Effects of SOA and flash pattern manipulations on ERPs, performance, and preference: Implications for a BCI system. Psychophysiol. 2006;59:127–140. doi: 10.1016/j.ijpsycho.2005.02.007. [DOI] [PubMed] [Google Scholar]
- Citi L, Poli R, Cinel C. Documenting, modeling and exploiting P300 amplitude changes due to variable target delays in Donchin’s speller. J Neural Eng. 2010;7:056006. doi: 10.1088/1741-2560/7/5/056006. [DOI] [PubMed] [Google Scholar]
- Croft RJ, Gonsalvez CJ, Gabriel C, Barry RJ. Target-to-target interval versus probability effects on P300 in one- and two-tone tasks. Psychophysiol. 2003;40:322–8. doi: 10.1111/1469-8986.00036. [DOI] [PubMed] [Google Scholar]
- Farwell LA, Donchin E. Talking off the top of your head: toward a mental prosthesis utilizing event-related brain potentials. EEG Clin Neurophysiol. 1988;70:510–23. doi: 10.1016/0013-4694(88)90149-6. [DOI] [PubMed] [Google Scholar]
- Gonsalvez CJ, Polich J. P300 amplitude is determined by target-to-target interval. Psychophysiol. 2002;39:388–396. doi: 10.1017/s0048577201393137. [DOI] [PubMed] [Google Scholar]
- Jin J, Horki P, Brunner C, Wang X, Neuper C, Pfurtscheller G. A new P300 stimulus presentation pattern for EEG-based spelling systems. Biomedizinische Technik. 2010;55:203–10. doi: 10.1515/BMT.2010.029. [DOI] [PubMed] [Google Scholar]
- Kaper M, Meinicke P, Grossekathoefer U, Lingner T, Ritter H. BCI competition 2003-data set IIb: support vector machines for the P300 speller paradigm. IEEE Trans Biomed Eng. 2004;51:1073–6. doi: 10.1109/TBME.2004.826698. [DOI] [PubMed] [Google Scholar]
- Krusienski D, Sellers EW, Cabestaing F, Bayoudh S, McFarland DJ, Vaughan TM, et al. A comparison of classification techniques for the P300 speller. J Neural Eng. 2006;3:299–305. doi: 10.1088/1741-2560/3/4/007. [DOI] [PubMed] [Google Scholar]
- McFarland DJ, Sarnacki WA, Wolpaw JR. Brain-computer interface (BCI) operation: optimizing information transfer rates. Biol Psychol. 2003;63:237–51. doi: 10.1016/s0301-0511(03)00073-5. [DOI] [PubMed] [Google Scholar]
- McFarland DJ, Sarnacki WA, Townsend G, Vaughan TM, Wolpaw JR. The P300-based brain-computer interface (BCI): Effects of stimulus rate. Clin Neurophysiol. 2011;122:731–37. doi: 10.1016/j.clinph.2010.10.029. [DOI] [PMC free article] [PubMed] [Google Scholar]
- Schalk G, McFarland DJ, Hinterberger T, Birbaumer N, Wolpaw JR. BCI2000: a general-purpose brain-computer interface (BCI) system. IEEE Trans Biomed Eng. 2004;51:1034–43. doi: 10.1109/TBME.2004.827072. [DOI] [PubMed] [Google Scholar]
- Sellers EW, Krusienski DJ, McFarland DJ, Vaughan TM, Wolpaw JR. A P300 event-related brain-computer interface (BCI): The effects of matrix size and interstimulus interval on performance. Biol Psychol. 2006;73:242–52. doi: 10.1016/j.biopsycho.2006.04.007. [DOI] [PubMed] [Google Scholar]
- Serby H, Yom-Tov E, Inbar G. An improved P300-based brain-computer interface. IEEE Trans Rehabil Eng. 2005;13:89–98. doi: 10.1109/TNSRE.2004.841878. [DOI] [PubMed] [Google Scholar]
- Sharbrough F, Chatrian GE, Lesser RP, Luders H, Nuwer M, Picton W. AEEGS guidelines for standard electrode position nomenclature. Clin Neurophysiol. 1991;8:202–4. [Google Scholar]
- Speier W, Arnold C, Lu J, Taira RK, Pouratian N. Natural language processing with dynamic classification improves P300 speller accuracy and bit rate. J Neural Eng. 2012;9:016004. doi: 10.1088/1741-2560/9/1/016004. [DOI] [PMC free article] [PubMed] [Google Scholar]
- Townsend G, LaPallo BK, Boulay CB, Krusienski DJ, Frye GE, Hauser CK, et al. A novel P300-based brain-computer interface stimulus presentation paradigm: Moving beyond rows and columns. Clin Neurophysiol. 2010;121:1109–20. doi: 10.1016/j.clinph.2010.01.030. [DOI] [PMC free article] [PubMed] [Google Scholar]


