

Abstract
The cortical regions specialized in speech–language exhibit a left–right asymmetry, e.g., a larger cortical size in the left auditory cortex and Wernicke's area. The possibility of developmental asymmetry in axonal fibers interconnecting speech–language cortical areas can be investigated by in vivo diffusion tensor imaging. Fifteen right‐handed native English speakers showed a markedly significant asymmetry (P < 0. 0005) in the relative anisotropy of water diffusion in the subinsular white matter, greater on the left. Additionally, the first principal diffusivity was greater and the second and third principal diffusivities were smaller on the left than right side. These results suggest the subinsular axonal structures developed differently between the left and right sides. A possible association between the hemispheric specialization in language and speech and the subinsular axonal fiber development is discussed. Hum. Brain Mapp. 20:82–90, 2003. © 2003 Wiley‐Liss, Inc.
Keywords: speech, language, symmetry, left–right
INTRODUCTION
The interhemispheric differences in gyral morphology of cerebral regions considered to be the neurobiological substrate of speech and language have been studied. Asymmetry of the primary auditory cortex, planum temporale, Wernicke's area, and angular gyrus has been found (Galaburda et al., 1978a, b; Gewchwind and Levitsky, 1968; Penhune et al., 1996; Watkins et al., 2001). The asymmetry of these anatomic regions mainly concerns the size of the cortex, larger in the left side, implying an association of the cortical organization with the hemispheric functional lateralization. Specific neurological disorders associate with diminished or reversed asymmetry, e.g., a significant reduction in the left–right asymmetry of the planum temporale or of perisylvian regions in dyslexic compared to the normal subjects (Hynd et al., 1990) and in children with specific language impairment (Plante et al., 1996). Axonal white matter fibers connecting cortical regions involved in speech, language, and reading may develop interhemispheric asymmetry in the size, the microstructural organization, the degree of axon myelination, or the integrity of axonal cell membranes. A variation in reading ability among the normal readers and the developmental dyslexics has been attributed to, at least in part, the strength of communication between cortical regions involved in visual, auditory, and language processing (Klingberg et al., 2000). A disruption of critical white matter tracts that consequently impair the communication between cortical regions can result in disconnection syndromes such as conduction aphasia (Damasio and Damasio, 1980; Geschwind, 1965).
The insular cortex, buried in the lateral sulcus and covered by operculum, has been suggested to be involved in certain aspects of language and speech, although its precise role in language remains to be determined (Grasby et al., 1994; Ojemann, 1979). An infarct in the left insular cortex has been reported to impair speech (Metter et al., 1988; Shuren, 1993), and the speech deficit may be particularly in motor planning of articulatory movement (Dronkers, 1996). A study of lesion location in conduction aphasia has revealed the possible association of the syndrome with damage to the insular cortex and the underlying white matter fibers (Damasio and Damasio, 1980). Also, a bilateral reduction of insular volumes has been reported in dyslexia (Hynd et al., 1990). The insula interconnects via the extreme capsule and perhaps also the external capsule, to the temporal pole, primary auditory, and auditory association cortex, superior temporal gyrus, the temporal operculum, anterior inferior parietal cortex, parietal operculum, and primary somatosensory cortex (Augustine, 1985, 1996). The inferior frontal gyrus and lateral pre‐motor region also receives projections from the insular cortex (Augustine, 1985, 1996). Thus, it is plausible that the extreme capsule and/or external capsule beneath the insular cortex are developed asymmetrically in the size, microstructure, or myelination in response to its functional specialization.
In vivo diffusion tensor imaging (DTI) is a technique capable of measuring random displacement (diffusion) of a water molecule in tissue (Basser and Pierpaoli, 1996; Basser et al., 1994; Le Bihan, 1995; Pierpaoli and Basser, 1997). Diffusion of water molecules in tissue is more or less restricted to either intracellular or extracellular space, depending upon water permeability of cell membrane. Thus, tissue water diffusion is sensitive to the diffusible space, the three‐dimensional tissue microstructure, and the permeability of cell membrane. In white matter, because of axonal structures and myelin sheaths wrapping around axons and reducing axon membrane permeability, water molecules have smaller diffusivities in the directions perpendicular to the axonal long‐axis than along the axis. This three‐dimensional dependence of diffusion (anisotropy) can be determined by in vivo DTI. In vivo DTI has been applied to investigate the orientation, organization, myelination, interconnection, or size of white matter fiber tracts in humans and animals in diseased and normal conditions (Ellis et al., 1999; Finsterbusch and Frahm, 1999; Horsfield et al., 1998; Jones et al., 1999; Klingberg et al., 1999; Krakow et al., 1999; Mori et al., 2001; Neil et al., 1998; Pajevic and Pierpaoli, 1999; Peled et al., 1998; Sorensen et al., 1999; Stieltjes et al., 2001; Werring et al., 1999; Xue et al., 1999). A direct comparison of high‐resolution DTI fiber mapping and histology measurements in a block of excised canine myocardium showed the excellent correspondence of the orientation of the local myocardial fibers with the measured largest eigenvector of the diffusion tensor, underscoring the potential of DT imaging as a noninvasive methodology to characterize tissue fiber architecture (Hsu et al., 1998). In the present study, we investigated anisotropy of water diffusion in the extreme/external capsule beneath the insular cortex by in vivo DTI, to assess the microstructural organization of the axonal fiber bundles.
MATERIALS AND METHODS
Subjects
Fifteen normal right‐handed subjects participated in the study. Initially, seven subjects (1 female, 6 male, ages 23 to 70 years) had diffusion tensor image (DTI) scans on a 1.5 Tesla (T) clinical scanner (NV/i scanner, General Electric Medical Systems, Milwaukee, WI). Based upon the preliminary data obtained from the seven subjects, a further investigation was carried out in the additional eight subjects (4 men, 4 women, ages from 22 to 71 years) on a 3.0 T clinical scanner (VH/i scanner, General Electric Medical Systems). In the additional investigation, the sex ratio of subjects was properly controlled, the imaging protocol included high‐resolution anatomic scans, and DTI had a greater in‐plane spatial resolution than in the initial study. Both scanners have gradient systems capable of a maximum gradient strength 40 mT/m and a slew rate of 150 T/m/sec, and can produce DTI images with similar parameters but not identical. Handedness of the subjects was assessed by the Edinburgh Handedness Inventory (Oldfield, 1971). Only the subjects who were strongly right‐handed with a handedness index greater or equal to 75% were included in study. The University Committee on Research Involving Human Subjects at Michigan State University approved the study. Informed consent was obtained from all subjects prior to study.
MRI Protocol at 1.5T
A total of 46 axial slices of DTI was acquired using a spin echo Echo‐Planar‐Imaging (EPI) pulse sequence with TE/TR = 69.3/10,000 msec, in‐plane resolution 2.3 mm, slice thickness 3 mm, gap 0 mm, and NEX 6. Diffusion encoding was accomplished in six non‐colinear directions with b value 1,000 sec/mm2.
MRI Protocol at 3T
An additional eight subjects were scanned on a 3T scanner to (1) verify what was observed on the 1.5T magnet, and (2) investigate whether partial volume effects affect findings of diffusion tensor imaging by utilizing high‐resolution anatomic images. Twenty axial slices of DTI were acquired using a spin echo EPI pulse sequence with a spatial‐spectral‐selection RF pulse. The parameters were chosen to approximate the 1.5 T parameters as closely as possible with TE/TR = 89/8,000ms, in‐plane nominal resolution 1.17 mm, slice thickness 4 mm with 0.5 mm gap, b = 1,000 s/mm2, diffusion encoding directions = 6, and NEX = 4. Also, for all eight subjects axial high‐resolution T2‐weighted images were collected at the same anatomic sections of the DTI using a fast spin echo pulse sequence, with effective TE = 105 msec, TR = 5,500 msec, in‐plane resolution 0.4 mm, slice thickness 4.0 mm, and 0.5 mm gap. For five subjects, high‐resolution fast inversion recovery (IR) T1‐weighted images were acquired in the same planes of DTI with TI = 860 msec, effective TE = 8.8 msec, TR = 2,200 msec, in‐plane resolution 0.4 mm, slice thickness 4.0 mm, and 0.5 mm gap.
Data Analysis
After images were assessed and corrected for possible in‐plane translation and rotation automatically (Cao et al., 1993), six diffusion tensor elements were calculated from diffusion‐weighted images encoded in six non‐colinear directions by singular value decomposition (Basser and Pierpaoli, 1996). Subsequently, the relative anisotropy of diffusion (RA), and three eigenvalues and eigenvectors of the diffusion tensor were computed voxel‐by‐voxel (Pierpaoli and Basser, 1996). The RA is an index to depict the degree of spatial dependency of water diffusion, and its value ranges from 0 to 1.414 with 0 for isotropy of water diffusion—water molecules have an equal probability of random displacement in any direction— and 1.414 for a maximum degree of the anisotropy—water diffusion is completely restricted to two directions. The magnitude of water diffusion is denoted by the three eigenvalues (three major diffusivities) in three orthogonal directions with a greater diffusivity for less restricted diffusion. The directions of diffusion are depicted by the three eigenvectors, the first of which is corresponding to the largest eigenvalue. Thus, in white matter the first eigenvector is oriented along the axis of fiber bundles, while the second and third eigenvectors are perpendicular to the fiber axis.
Quantitative Analysis
Quantitative analysis of the diffusion tensor was applied to assess the integrity and microscopic organization of white matter. This may be affected by the degree of myelination, the axonal micro‐organization, and/or the size of subinsular white matter fiber tracts. Regions of interest (ROI) were chosen in the space that is lateral to putamen and medial to insular cortex corresponding to the external capsule, extreme capsule, and claustrum, which are not resolved individually on the DTI. The ROIs were selected on the corresponding T2W b = 0 images from the DTI sequence where the voxels between the putamen and insular cortex were resolved (see Fig. 1). The ROI analysis was not applied to the slices that did not show putamen. The selected ROI was transferred automatically to RA, and eigenvalue images, and then means, standard deviations and the numbers of voxels were calculated in each ROI. The data obtained from the multiple slices were pooled. Differences of RA and eigenvalues between the left and right subinsular white matter were assessed by a paired t‐test.
Figure 1.
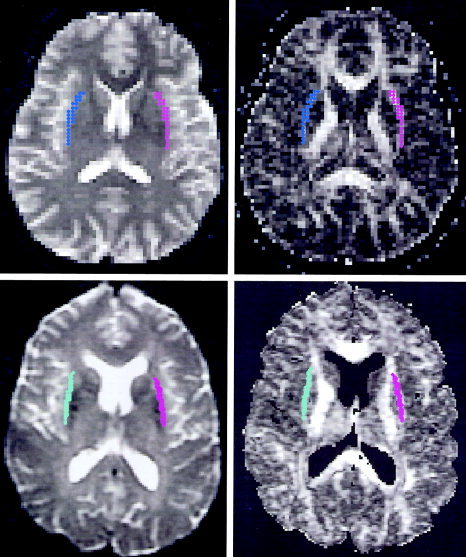
T2W (b = 0) (left) and relative anisotropic diffusion (right) images acquired at 1.5 T (top) and 3.0 T (bottom). In the RA image, white matter showed greater RA (bright voxels) than grey matter. The regions of interest (labeled by colors) were selected to be lateral to putamen and medial to insular cortex on T2W images (left), and automatically transferred into RA images (right). The mean and standard deviation of RA and the number of voxels in each ROI were calculated.
RESULTS
Water Diffusion in Subinsular WM
Water diffusion in the subinsular white matter at 1.5 T showed a significant left–right asymmetry (Table I). The relative anisotropy (RA) of diffusion was significantly greater on the left side than on the right with the mean difference 0.14 ± 0.007 (P < 0. 0005, n = 7). The three eigenvalues of the diffusion tensor also showed significant differences between left and right, the first eigenvalues greater and the second and third eigenvalues smaller in the left side (Table I), suggesting that water molecules in the left subinsular white matter diffuse more freely along the fiber bundles and more restrictedly perpendicular to the fiber bundles than in the right homologous structure. The subinsular white matter space selected for analysis included structures of the external capsule, extreme capsule, and claustrum that were not resolved individually on the diffusion tensor images (Fig. 1). Although the regions of interest were selected according to the rules described in Materials and Methods, a determination of the region boundary often relied on an operator's decision. Thus, two investigators analyzed the data independently, and obtained similar results. The mean difference of RA obtained by the second operator was 0.14 ± 0.014 (P < 0. 0005), which was the same as one obtained by the first operator, suggesting that the observed significant finding is independent of the operator's judgment of the region boundary.
Table I.
DTI data at 1.5T
| RA(L) | RA(R) | ΔRA | Eig1(L) | Eig1(R) | ΔEig1 | Eig2(L) | Eig2(R) | ΔEig2 | Eig3(L) | Eig3(R) | ΔEig3 | |
|---|---|---|---|---|---|---|---|---|---|---|---|---|
| 1 | 0.38 | 0.26 | 0.12 | 1.146 | 1.035 | 0.111 | 0.646 | 0.707 | −0.061 | 0.426 | 0.541 | −0.114 |
| 2 | 0.42 | 0.25 | 0.18 | 1.144 | 0.993 | 0.151 | 0.596 | 0.693 | −0.096 | 0.385 | 0.537 | −0.152 |
| 3 | 0.39 | 0.25 | 0.14 | 1.129 | 1.006 | 0.123 | 0.584 | 0.697 | −0.113 | 0.376 | 0.490 | −0.113 |
| 4 | 0.35 | 0.22 | 0.13 | 1.175 | 1.009 | 0.166 | 0.624 | 0.738 | −0.114 | 0.420 | 0.524 | −0.103 |
| 5 | 0.37 | 0.25 | 0.12 | 1.138 | 1.017 | 0.120 | 0.650 | 0.692 | −0.042 | 0.449 | 0.548 | −0.099 |
| 6 | 0.36 | 0.23 | 0.14 | 1.104 | 0.990 | 0.113 | 0.585 | 0.686 | −0.101 | 0.365 | 0.493 | −0.127 |
| 7 | 0.32 | 0.18 | 0.15 | 1.237 | 1.028 | 0.208 | 0.684 | 0.769 | −0.084 | 0.451 | 0.601 | −0.150 |
| Mean | 0.37 | 0.23 | 0.14 | 1.153 | 1.011 | 0.142 | 0.624 | 0.712 | −0.088 | 0.410 | 0.533 | −0.122 |
| SEM | 0.01 | 0.01 | 0.007 | 0.016 | 0.006 | 0.013 | 0.014 | 0.011 | 0.010 | 0.013 | 0.014 | 0.008 |
| t | 19.04 | 10.46 | −8.54 | −15.19 | ||||||||
| P | 0. 0005 | 0. 0005 | 0. 0005 | 0. 0005 |
Eigenvalues of a diffusion tensor are given in 10−3 mm2/sec.
Eig1, the first eigenvalue of a diffusion tensor; Eig2, the second eigenvalue; Eig3, the third eigenvalue; L, left; R, right.
Anticipating the possibility that the left–right asymmetry of the relative anisotropy of diffusion may be due to partial‐volume averaging of the claustrum, the putamen, and/or the insular cortex, an additional investigation was carried out on a 3.0 T scanner, and the image protocol was modified to improve in‐plane resolution. The RA and the eigenvalues obtained at the 3T magnetic field strength were similar in magnitude and direction to the results at 1.5T (Table II). The asymmetry of the RA and three eigenvalues between the left and right were significant and in the same direction at both field strengths. In this small sample, no significant sex difference in the RA was detected (P > 0.2).
Table II.
DTI data at 3T
| RA(L) | RA(R) | ΔRA | Eig1(L) | Eig1(R) | ΔEig1 | Eig2(L) | Eig2(R) | ΔEig2 | Eig3(L) | Eig3(R) | ΔEig3 | No. Vox (L) | No. Vox (R) | |
|---|---|---|---|---|---|---|---|---|---|---|---|---|---|---|
| 1 | 0.37 | 0.24 | 0.13 | 1.403 | 1.227 | 0.177 | 0.753 | 0.796 | −0.043 | 0.385 | 0.566 | −0.181 | 81 | 80 |
| 2 | 0.33 | 0.20 | 0.13 | 1.350 | 1.114 | 0.236 | 0.793 | 0.888 | −0.095 | 0.404 | 0.539 | −0.136 | 74 | 71 |
| 3 | 0.37 | 0.21 | 0.16 | 1.421 | 1.195 | 0.226 | 0.802 | 0.880 | −0.078 | 0.418 | 0.611 | −0.193 | 94 | 85 |
| 4 | 0.32 | 0.24 | 0.09 | 1.356 | 1.261 | 0.095 | 0.789 | 0.830 | −0.041 | 0.454 | 0.597 | −0.143 | 76 | 83 |
| 5 | 0.31 | 0.19 | 0.12 | 1.415 | 1.157 | 0.258 | 0.818 | 0.892 | −0.074 | 0.498 | 0.610 | −0.111 | 97 | 97 |
| 6 | 0.37 | 0.30 | 0.07 | 1.375 | 1.241 | 0.134 | 0.773 | 0.819 | −0.046 | 0.374 | 0.444 | −0.070 | 99 | 91 |
| 7 | 0.37 | 0.22 | 0.15 | 1.472 | 1.203 | 0.269 | 0.731 | 0.908 | −0.177 | 0.446 | 0.557 | −0.111 | 66 | 87 |
| 8 | 0.37 | 0.28 | 0.09 | 1.434 | 1.299 | 0.135 | 0.710 | 0.779 | −0.069 | 0.406 | 0.509 | −0.103 | 55 | 57 |
| Mean | 0.35 | 0.24 | 0.12 | 1.403 | 1.212 | 0.191 | 0.771 | 0.849 | −0.078 | 0.423 | 0.554 | −0.131 | 80 | 81 |
| SEM | 0.01 | 0.01 | 0.01 | 0.015 | 0.021 | 0.023 | 0.013 | 0.017 | 0.016 | 0.014 | 0.020 | 0.015 | 5.5 | 4.4 |
| t | 10.38 | 8.32 | −4.97 | −9.02 | ||||||||||
| P | 0. 0005 | 0. 0005 | 0.002 | 0. 0005 | n.s |
Eigenvalues of a diffusion tensor are given in 10−3 mm2/sec. Voxel size = 1.17 × 1.17 × 4.5 = 6.2 mm3.
Eig1, the first eigenvalue of a diffusion tensor; Eig2, the second eigenvalue; Eig3, the third eigenvalue; L, left; R, right.
The claustrum was spatially resolved from the external capsule and extreme capsule on the high‐resolution fast spin echo IR T1‐weigted images, while the contrast on the high‐resolution T2‐weighted images was not sufficient to clearly delineate claustrum from adjacent white matter (Fig. 2). The IR T1‐weighted images revealed that claustrum did not appear in the superior portion of the subinsular space. Thus, using the IR T1‐weighted images, we identified the slices on which claustrum did not appear and compared the RA difference between the left and right sides. The means of RA were 0.32 ± 0.02 and 0.22 ± 0.02 for the respective left and right sides. The mean of the RA differences between the left and right was 0.10 ± 0.007, and was significant from zero (P < 0. 0005, t = 14.2, paired t test), which was similar to one obtained from all the slices in which claustrum was included (see Table II). Thus, excluding the claustrum from the analysis did not alter the observed asymmetry.
Figure 2.
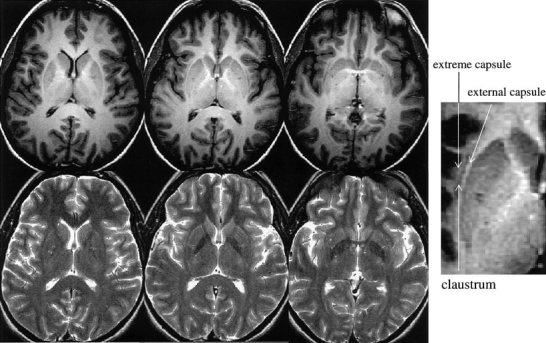
High‐resolution IR T1W (top) and T2W (bottom) images acquired at 3.0 T. Claustrum was differentiated from extreme capsule and external capsule on the IR T1W images better than on T2W images. Claustrum does not appear on the superior portion of the subinsular space; see the image on the top left panel.
A further analysis was done to assess the influence of partial volume averaging of voxels of putaman and insular cortex on the measured asymmetry of RA. If there were no left–right asymmetry of anisotropic diffusion and the small RA in the right side were solely due to partial volume averaging of putamen or insular cortex, the volume of gray matter averaged in the selected right subinsular space necessary to account for the asymmetry can be estimated. We observed RAs of 0.32 and 0.22 for the respective left and right sides on the slices where claustrum did not appear. We measured RA of 0.089 in the putamen, which was used for grey matter in the estimation. If the observed asymmetry was solely due to partial volume averaging with grey matter, the grey matter volume averaged in the selected right subinsular space would have had to be 32% greater than in the left side (see Appendix for details of the calculation). A similar result of 32% greater partial volume averaging in the right than the left side would be necessary to create the observed asymmetry in all the slices (Table II).
The mean volumes selected in DTI analysis were 81.0 ± 5.5 and 80.0 ± 4.4 voxels for the left and right subinsular spaces, respectively (see Table II). Using the high‐resolution IR T1‐weighted images, the area of subinsular white matter, defined between putamen and insular cortex, was estimated on the slices on which claustrum did not appear. The averaged areas were 31.9 ± 2.7 mm2 and 30.7 ± 2.3 mm2 for the right and left sides, respectively. The difference of the areas between the right and left sides was 1.2 mm2, less than 4% of the area of the left or right side and within the measurement error of the technique. These analyses show that although the absolute values of the RA and diffusion eigenvalues determined in study might be slightly affected by partial‐volume averaging of putamen or insular cortex, the small volume difference between left and right subinsular space cannot itself account for the observed statistically significant asymmetry of anisotropic water diffusion.
DISCUSSION
We observed a left–right asymmetry of relative anisotropy of water diffusion in white matter beneath the insular cortex. Considering the size of subinsular white matter space relative to an available spatial resolution in a diffusion tensor image, partial‐volume averaging of voxels in adjacent grey matter or claustrum over selected regions of interest in the subinsular white matter space could result in a measured asymmetry of anisotropy diffusion, due to greater partial‐volume averaging in the right side. Two investigations have been done to rule out the possibility of the observed asymmetry of anisotropic diffusion solely due to partial‐volume averaging grey matter in the analysis. Claustrum, embedded between the external capsule and extreme capsule, was not resolved individually on the diffusion tensor images, and thus was included in the analysis of diffusion tensors. If the anisotropy of water diffusion in the claustrum were small, a potential greater size of claustrum on the right side could solely result in the observed left–right asymmetry of relative anisotropy of water diffusion in the subinsular space. This possibility is unlikely given the analysis of the slices where claustrum did not appear still shows persistent significant left–right asymmetry of anisotropic diffusion in the subinsular white matter, and is similar to that obtained in the analysis of all the slices, including those containing the claustrum. Our second analysis showed that the size difference between the left and right subinsular space was small, and partial‐volume averaging of voxels in adjacent grey matter cannot reconcile the left–right asymmetry of anisotropy of water diffusion in the subinsular space, which would require a dramatic area difference as large as 32% to account for the observed asymmetry.
Asymmetry of anisotropic water diffusion as observed in the subinsular space is not apparent in the whole brain. Samples of other brain regions (e.g., white matter fibers in the frontal region and the associate fibers connecting to grey matter in the precentral gyrus) do not show any significant asymmetry of anisotropic water diffusion.
The relative anisotropy of water diffusion as well as the three major diffusivities in the subinsular space of the normal right‐handed subjects showed a marked left–right asymmetry. Anisotropic water diffusion in white matter fibers has been initially thought mainly due to the myelin sheath restricted water diffusion across axonal fiber tracks. However, the microscopic picture that causes the anisotropic water diffusion remains unclear. Myelin loss and axonal damage are both observed in white matter injury. A recent study of shiverer mice reveals that dysmyelination without axonal damage only increases the water diffusivity perpendicular to the axonal fiber axis but does not alter the diffusivity along the axonal fiber tracks (Song et al., 2002). The authors of the study further suggested that changes in diffusivities perpendicular to and along the axonal fiber axis might have potential to differentiate myelin loss from axonal injury. A probable explanation in normal subjects for asymmetry of anisotropic water diffusion may be differences in white matter fiber orientation or microstructural organization.
The cortical connection and functional role of the subinsular white fibers are interesting although not a primary focus of the present study. It is clearly visible on the first‐eigenvector images that several groups of fiber bundles from the insular cortex emerge or interconnect into the subinsular white matter and putamen (Fig. 3). The insular cortex anatomically connects to the inferior frontal cortex, superior temporal gyrus, and parietal lobe, which has been determined with the aid of a variety of techniques (Augustine, 1985, 1996). The external capsule and extreme capsule are shown to be the substrate providing connectivity of the insula to the anterior and posterior cortical regions. For instance, the auditory cortex (the middle portion of the superior temporal gyrus) predominantly projects to the lateral frontal cortex and the dorsal aspect of the medial frontal lobe via the extreme capsule (Petrides and Pandya, 1988). Fibers originated from the posterior portion of the superior temporal gyrus and projected to the lateral frontal cortex run initially via the extreme capsule and then cross the claustrum as they ascend to enter the external capsule before continuing their course to the frontal lobe (Petrides and Pandya, 1988). In a recent study of poor readers who had developmental dyslexia, anisotropy of water diffusion in the bilateral temporoparietal white matter regions was decreased, while the reading score only correlated to the anisotropy diffusion in the left side (Klingberg et al., 2000). The location of this abnormal anisotropy diffusion is coincident in the posterior part of the subinsular space and adjacent to the posterior limb of the internal capsule. Abnormalities in white matter microstructure and its consequent disruption in the cortical communication have been considered to be a plausible explanation for the multimodal deficits in the processing of rapidly changed auditory and visual stimuli in developmental dyslexics (Klingberg et al., 2000). Also, the destruction of the insular cortex and particularly the extreme capsule has been suggested as an alternative explanation of conduction aphasia that is thought to be caused by a disruption of communication between anterior and posterior cortical language regions (Damasio and Damasio, 1980). These studies are indicative of functional lateralization in the area that we investigated. The possibility of an association between the left–right asymmetry of microstructure in the subinsular region and the left‐hemispheric lateralization in language and speech could be further investigated by combining language and speech functional MR experiments with diffusion tensor imaging studies in the same population.
Figure 3.
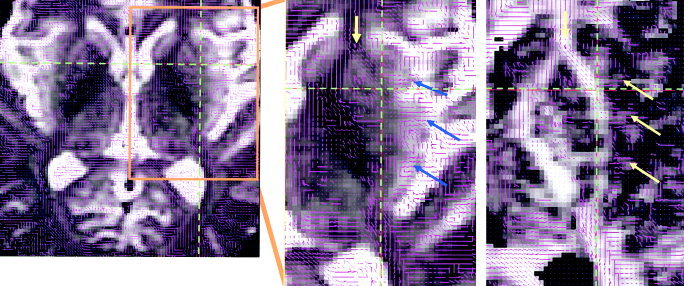
The first eigenvectors of diffusion tensors denoted by lines overlaid on axial T2 weighted images (left and middle) and RA images (right). The blue and yellow arrows point to the fibers that originated from insular cortex and are emerging into or interconnecting with the subinsular white matter fibers.
Acknowledgements
This work was supported in part by the National Institute of Neurological Disorders and Stroke (1R21 NS41369‐01) and American Heart Association established Investigator Award (9940132N) to Y.C.
If a fractional volume f of grey matter mixing with a fractional volume (1‐f) of white matter in the left side results in what we observed in the right side, we have the following relationship:
| (1) |
Where  is a diffusion tensor, and g, L, and R label, respective, grey matter, white matter in the left side, and white matter in the right side. According to equation (1), we have a similar relationship for each of six independent elements or eigenvalues of the diffusion tensor.
| (2) |
Using the notations defined by Ulug et al. (1999), we have
| (3) |
where
| (4) |
and
| (5) |
where λ1, λ2, λ3 are the three eigenvalues of the diffusion tensor, D av is the average of the three eigenvalues, and D surf is the surface area of the diffusion ellipsoid. D av is approximately the same in grey matter and white matter, e.g., 0.87, 0.86, and 0.87 for the putamen, the left subinsula, and the right subinsula, respectively. From equation (2), we have
| (6) |
| (7) |
| (8) |
When adding equations (6)‐(8) together, using equations (4) and (5), and assuming three eigenvalues in grey matter are equal, we have
| (9) |
From equations (3) and (9), we have
| (10) |
Using RA indices of 0.09, 0.32, and 0.22 for respective grey matter, white matter in the left side and white matter in the right side, we have f = 0.32. Therefore, a grey matter volume averaged in the selected right subinsular space has to be 32% greater than in the left side in order to make up the observed asymmetry.
REFERENCES
- Augustine JR (1985): The insular lobe in primates including humans. Neurol Res 7: 2–1. [DOI] [PubMed] [Google Scholar]
- Augustine JR (1996): Circuitry and functional aspects of the insular lobe in primates including humans. Brain Res Brain Res Rev 22: 229–244. [DOI] [PubMed] [Google Scholar]
- Basser PJ, Pierpaoli C (1996): Microstructural and physiological features of tissues elucidated by quantitative‐diffusion‐tensor MRI. J Magn Reson B 111: 209–219. [DOI] [PubMed] [Google Scholar]
- Basser PJ, Mattiello J, LeBihan D (1994): Estimation of the effective self‐diffusion tensor from the NMR spin echo. J Magn Reson B 103: 247–254. [DOI] [PubMed] [Google Scholar]
- Cao Y, Towle VL, Levin DN, Balter JM (1993): Functional mapping of human motor cortical activation by conventional MRI at 1.5 T. J Mag Res Imag 3: 869–875. [DOI] [PubMed] [Google Scholar]
- Damasio H, Damasio AR (1980): The anatomical basis of conduction aphasia. Brain 103: 337–350. [DOI] [PubMed] [Google Scholar]
- Dronkers NF (1996): A new brain region for coordinating speech articulation. Nature 384: 159–161. [DOI] [PubMed] [Google Scholar]
- Ellis CM, Simmons A, Jones DK, Bland J, Dawson JM, Horsfield MA, et al. (1999): Diffusion tensor MRI assesses corticospinal tract damage in ALS [In Process Citation]. Neurology 53: 1051–1058. [DOI] [PubMed] [Google Scholar]
- Finsterbusch J, Frahm J (1999): Diffusion‐weighted single‐shot line scan imaging of the human brain. Magn Reson Med 42: 772–778. [DOI] [PubMed] [Google Scholar]
- Geschwind N, Levitsky W (1968): Human brain: left–right asymmetries in temporal speech region. Science 161: 186–187. [DOI] [PubMed] [Google Scholar]
- Galaburda AM, LeMay M, Kemper TL, Geschwind N (1978): Right‐left asymmetrics in the brain. Science 199: 852–856. [DOI] [PubMed] [Google Scholar]
- Galaburda AM, Sanides F, Geschwind N (1978): Human brain. Cytoarchitectonic left–right asymmetries in the temporal speech region. Arch Neurol 35: 812–817. [DOI] [PubMed] [Google Scholar]
- Geschwind N (1965): Disconnection syndroms in animals and man. Brain 88: 585–644. [DOI] [PubMed] [Google Scholar]
- Grasby PM, Frith CD, Friston KJ, Simpson J, Fletcher PC, Frackowiak RS, et al. (1994): A graded task approach to the functional mapping of brain areas implicated in auditory‐verbal memory. Brain 117: 1271–1282. [DOI] [PubMed] [Google Scholar]
- Horsfield MA, Larsson HB, Jones DK, Gass A (1998): Diffusion magnetic resonance imaging in multiple sclerosis. J Neurol Neurosurg Psychiatry 64 (Suppl 1): S80–84. [PubMed] [Google Scholar]
- Hsu EW, Muzikant AL, Matulevicius SA, Penland RC, Henriquez CS (1998): Magnetic resonance myocardial fiber‐orientation mapping with direct histological correlation. Am J Physiol 274: H1627–1634. [DOI] [PubMed] [Google Scholar]
- Hynd GW, Semrud‐Clikeman M, Lorys AR, Novey ES, Eliopulos D (1990): Brain morphology in developmental dyslexia and attention deficit disorder/hyperactivity. Arch Neurol 47: 919–926. [DOI] [PubMed] [Google Scholar]
- Jones DK, Simmons A, Williams SC, Horsfield MA (1999): Non‐invasive assessment of axonal fiber connectivity in the human brain via diffusion tensor MRI. Magn Reson Med 42: 37–41. [DOI] [PubMed] [Google Scholar]
- Klingberg T, Vaidya CJ, Gabrieli JD, Moseley ME, Hedehus M (1999): Myelination and organization of the frontal white matter in children: a diffusion tensor MRI study [In Process Citation]. Neuroreport 10: 2817–2821. [DOI] [PubMed] [Google Scholar]
- Klingberg T, Hedehus M, Temple E, Salz T, Gabrieli JD, Moseley ME, et al. (2000): Microstructure of temporo‐parietal white matter as a basis for reading ability: evidence from diffusion tensor magnetic resonance imaging. Neuron 25: 493–500. [DOI] [PubMed] [Google Scholar]
- Krakow K, Wieshmann UC, Woermann FG, Symms MR, McLean MA, Lemieux L, et al. (1999): Multimodal MR imaging: functional, diffusion tensor, and chemical shift imaging in a patient with localization‐related epilepsy [In Process Citation]. Epilepsia 40: 1459–1462. [DOI] [PubMed] [Google Scholar]
- Le Bihan D (1995): Molecular diffusion, tissue microdynamics and microstructure. NMR Biomed 8: 375–386. [DOI] [PubMed] [Google Scholar]
- Metter EJ, Riege WH, Hanson WR, Jackson CA, Kempler D, van Lancker D (1988): Subcortical structures in aphasia. An analysis based on (F‐18)‐ fluorodeoxyglucose, positron emission tomography, and computed tomography. Arch Neurol 45: 1229–1234. [DOI] [PubMed] [Google Scholar]
- Mori S, Itoh R, Zhang J, Kaufmann WE, van Zijl PC, Solaiyappan M, et al. (2001): Diffusion tensor imaging of the developing mouse brain. Magn Reson Med 46: 18–23. [DOI] [PubMed] [Google Scholar]
- Neil JJ, Shiran SI, McKinstry RC, Schefft GL, Snyder AZ, Almli CR, et al. (1998): Normal brain in human newborns: apparent diffusion coefficient and diffusion anisotropy measured by using diffusion tensor MR imaging. Radiology 209: 57–66. [DOI] [PubMed] [Google Scholar]
- Ojemann G (1979): Individual variability in cortical localization of language. J. Neurosurg 50: 164–169. [DOI] [PubMed] [Google Scholar]
- Oldfield RC (1971): The assessment and analysis of handedness. The Edinburgh Inventory. Neuropsychologia 9: 97–113. [DOI] [PubMed] [Google Scholar]
- Pajevic S, Pierpaoli C (1999): Color schemes to represent the orientation of anisotropic tissues from diffusion tensor data: application to white matter fiber tract mapping in the human brain. Magn Reson Med 42: 526–540. [PubMed] [Google Scholar]
- Peled S, Gudbjartsson H, Westin CF, Kikinis R, Jolesz FA (1998): Magnetic resonance imaging shows orientation and asymmetry of white matter fiber tracts. Brain Res 780: 27–33. [DOI] [PubMed] [Google Scholar]
- Penhune VB, Zatorre RJ, MacDonald JD, Evans AC (1996): Interhemispheric anatomical differences in human primary auditory cortex: probabilistic mapping and volume measurement from magnetic resonance scans. Cereb Cortex 6: 661–672. [DOI] [PubMed] [Google Scholar]
- Petrides M, Pandya DN (1988): Association fiber pathways to the frontal cortex from the superior temporal region in the rhesus monkey. J Comp Neurol 273: 52–66. [DOI] [PubMed] [Google Scholar]
- Pierpaoli C, Basser PJ (1996): Toward a quantitative assessment of diffusion anisotropy [published erratum appears in Magn Reson Med 1997 Jun;37(6):972]. Magn Reson Med 36: 893–906. [DOI] [PubMed] [Google Scholar]
- Plante E, Boliek C, Binkiewicz A, Erly WK (1996): Elevated androgen, brain development and language/learning disabilities in children with congenital adrenal hyperplasia. Dev Med Child Neurol 38: 423–437. [DOI] [PubMed] [Google Scholar]
- Shuren J (1993): Insula and aphasia. J Neurol 240: 216–218. [DOI] [PubMed] [Google Scholar]
- Song SK, Sun SW, Ramsbottom MJ, Chang C, Russell J, Cross AH (2002): Dysmyelination revealed through MRI as increased radial (but unchanged axial) diffusion of water. Neuroimage 17: 1429–1436. [DOI] [PubMed] [Google Scholar]
- Sorensen AG, Wu O, Copen WA, Davis TL, Gonzalez RG, Koroshetz WJ, et al. (1999): Human acute cerebral ischemia: detection of changes in water diffusion anisotropy by using MR imaging. Radiology 212: 785–792. [DOI] [PubMed] [Google Scholar]
- Stieltjes B, Kaufmann WE, van Zijl PC, Fredericksen K, Pearlson GD, Solaiyappan M, et al. (2001): Diffusion tensor imaging and axonal tracking in the human brainstem. Neuroimage 14: 723–735. [DOI] [PubMed] [Google Scholar]
- Ulug AM, van Zijl PC (1999): Orientation‐independent diffusion imaging without tensor diagonalization: anisotropy definitions based on physical attributes of the diffusion ellipsoid. J Magn Reson Imaging 9: 804–813. [DOI] [PubMed] [Google Scholar]
- Watkins KE, Paus T, Lerch JP, Zijdenbos A, Collins DL, Neelin P, et al. (2001): Structural asymmetries in the human brain: a voxel‐based statistical analysis of 142 MRI scans. Cereb Cortex 11: 868–877. [DOI] [PubMed] [Google Scholar]
- Werring DJ, Clark CA, Barker GJ, Thompson AJ, Miller DH (1999): Diffusion tensor imaging of lesions and normal‐appearing white matter in multiple sclerosis. Neurology 52: 1626–1632. [DOI] [PubMed] [Google Scholar]
- Xue R, van Zijl PC, Crain BJ, Solaiyappan M, Mori S (1999): In vivo three‐dimensional reconstruction of rat brain axonal projections by diffusion tensor imaging. Magn Reson Med 42: 1123–1127. [DOI] [PubMed] [Google Scholar]