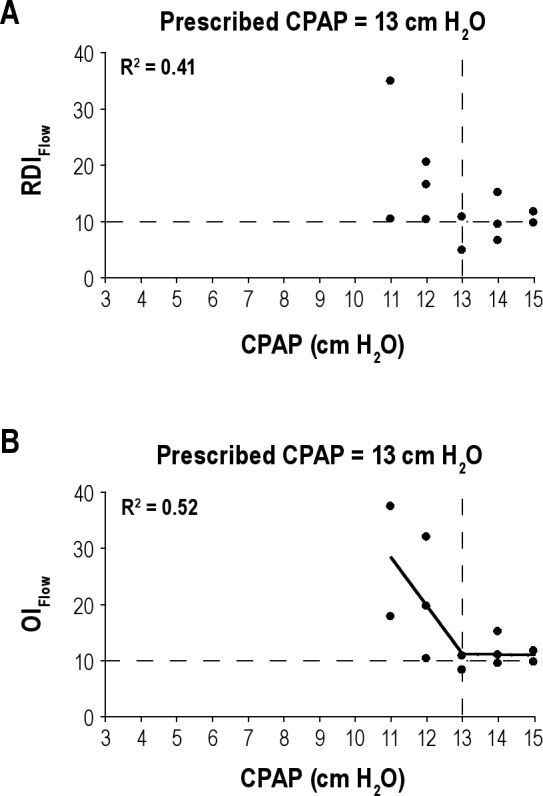
Figure 3.

(A) Example of RDIFlow plotted (on the y-axis) against the CPAP (x-axis) on 12 nights in a representative patient. Each solid circle represents the RDIFlow on a single night and at a given CPAP. No linear regression line is shown as the R2 < 0.5, although an inflection is visually suggested at 13 cm H2O. The vertical dashed line marks the prescribed CPAP from in-laboratory manual titration and the horizontal dashed line is a reference for an RDIFlow = 10 events/h. (B) Example of OIFlow plotted (on the y-axis) against the CPAP (x-axis) on 12 nights in a representative patient. Each solid circle represents the OIFlow on a single night and at a given CPAP. Using two-step piecewise linear regression (solid line) the R2 = 0.52 and the PressureIPMultingiht = 13 cm H2O. The vertical dashed line marks the prescribed CPAP and was the same as the PressureIPMultinight. The vertical dashed line marks the prescribed CPAP from in-laboratory manual titration and the horizontal dashed line is a reference for an OIFlow = 10. CPAP, continuous positive airway pressure; OI, obstruction index; RDI, respiratory disturbance index.
