

Abstract
Lung adenocarcinoma is the most common type of primary lung cancer. The purpose of this study was to delineate gene expression patterns for survival prediction in lung adenocarcinoma. Gene expression profiles of 82 (discovery set) and 442 (validation set 1) lung adenocarcinoma tumor tissues were analyzed using a systems biology-based network approach. We also examined the expression profiles of 78 adjacent normal lung tissues from 82 patients. We found a significant correlation of an expression module with overall survival (adjusted hazard ratio or HR=1.71; 95% CI=1.06-2.74 in discovery set; adjusted HR=1.26; 95% CI=1.08-1.49 in validation set 1). This expression module contained genes enriched in the biological process of the cell cycle. Interestingly, the cell cycle gene module and overall survival association were also significant in normal lung tissues (adjusted HR=1.91; 95% CI, 1.32-2.75). From these survival-related modules, we further defined three hub genes (UBE2C, TPX2 and MELK) whose expression-based risk indices were more strongly associated with poor 5-year survival (HR=3.85, 95% CI=1.34-11.05 in discovery set; HR=1.72, 95% CI=1.21-2.46 in validation set 1; and HR=3.35, 95% CI=1.08-10.04 in normal lung set). The 3-gene prognostic result was further validated using 92 adenocarcinoma tumor samples (validation set 2); patients with a high-risk gene signature have a 1.52 fold increased risk (95% CI, 1.02–2.24) of death than patients with a low-risk gene signature. These results suggest that network-based approach may facilitate discovery of key genes that are closely linked to survival in patients with lung adenocarcinoma.
Keywords: Lung cancer, survival, gene expression profiling, cell cycle, systems biology
Introduction
Adenocarcinoma is the most frequent type of lung cancer. Gene expression profiling analysis has been extensively used to identify molecular signatures in predicting patient's prognosis and survival [1]. These analyses have identified prognostically different tumor subgroups [2-5]; the results supported the combined use of clinical and molecular information when building prognostic models for lung cancer. However, given differences in study design, assay platform, and patient selection, the results of these studies lacked consistency both in terms of the number of genes in the predictors and in the specific genes included in each signature. So far, we have very limited knowledge on the specific survival-related key genes.
Traditionally, microarray-based expression profiling analysis treats thousands of genes independently, ignoring potential relationships among these genes. In recent years, a systems biology-based network analysis approach [6, 7] has been proposed and used in various scenarios to dissect disease-related transcriptional networks and identify key genes that contribute to the disease phenotypes [8-11]. By focusing on correlated gene modules rather than on individual genes, the network approach may greatly alleviate the multiple testing problems inherent in microarray data analysis. In this study, we applied a weighted gene co-expression network analysis (WGCNA) approach [6, 7] to identify survival-related expression modules and gene signatures in lung adenocarcinoma.
Patients and Methods
Patients
For the Mayo Clinic discovery set, patients with lung cancer were identified and recruited between January, 1997, and September, 2008. Never smokers were defined as individuals who had smoked less than 100 cigarettes during their lifetime. A detailed explanation of the recruitment process has been reported previously [12-14]. Briefly, new cases diagnosed with lung cancer were enrolled after they gave consent. Interviews were conducted and patients’ medical records were abstracted. All patients were followed up beginning six months after diagnosis, with subsequent annual follow-up by mailed questionnaires. Annual verification of patients’ vital status was accomplished through the Mayo Clinic's electronic medical notes and registration database, next-of-kin reports, death certificates, and obituary documents filed in the patients’ medical records, as well as through the Mayo Clinic Tumor Registry and Social Security Death Index website.
The available fresh frozen lung tumor and matched normal lung tissues were sectioned and reviewed by a pathologist to confirm the diagnosis of adenocarcinoma, histological grade, tumor purity, and lack of tumor contamination in the normal lung. Tumor samples with >=70% tumor-cell content from 82 patients were used in the study, of which 78 were found to have matched normal tissues that were taken from the farthest distance to the tumor in the resected lung. These normal lung tissues were also included in the study. All tissues were collected prior to any radiation or chemotherapy. Research protocols were approved by the Institutional Review Boards of Mayo Clinic (Rochester, MN, USA).
For the validation set, we used two published data set of 442 and 92 patients with adenocarcinoma as described previously [5, 3]. Table 1 and Supplementay Table 1 provide descriptive characteristics of patients in both the discovery and two validation data sets.
Table 1.
Descriptive characteristics of the patients with lung adenocarcinoma
| Mayo Clinc discovery set | Validation set 1 | ||
|---|---|---|---|
| Patient characteristics | Tumor N=82 | Normal N=78 | Tumor N=442 |
| Alive/death | 56/26(68.3/31.7) | 56/22(71.8/28.2) | 206/236(46.6/53.4) |
| Survival time (years) | |||
| Median (range) | 4.2(0.4-9.1) | 4.5(0.4-10.1) | 3.7(0.0-14.6) |
| Mean(SD) | 4.5(2.2) | 4.6(2.2) | 4.2(3.0) |
| Age at diagnosis (years) | |||
| Mean(SD) | 67.6(13.0) | 67.4(12.9) | 64.4(10.1) |
| Men/women (%) | 15/67(18.3/81.7) | 14/64(18.0/82.1) | 222/220(50.2/49.8) |
| Race | |||
| Caucasian | 73(89.0) | 72(92.3) | 294(66.5) |
| Non-Caucasian | 9(11.0) | 6(7.7) | 19(4.3) |
| Unknown | – | – | 129(29.2) |
| Smoking history at diagnosis (%) | |||
| Never | 82(100.0) | 78(100.0) | 49(11.1) |
| Ever | 0 | 0 | 299(67.6) |
| Unknown | – | – | 94(21.3) |
| Tumor stage | |||
| I | 57(69.5) | 55(70.5) | 276(62.4) |
| II | 5(6.1) | 5(6.4) | 94(21.3) |
| III | 17(20.7) | 17(21.8) | 69(15.6) |
| IV | 3(3.7) | 1(1.3) | 0 |
| Unknown | – | – | 3(0.7) |
| Tumor grade | |||
| Poorly/undifferentiated | 7(8.5) | 7(9.0) | 167(37.8) |
| Moderately differentiated | 33(40.2) | 28(35.9) | 208(47.1) |
| Well-differentiated | 42(51.2) | 43(55.1) | 60(13.6) |
| Unknown | – | – | 7(1.6) |
| Performance score | |||
| Up to 2.0 | 80(97.6) | 76(97.4) | – |
| Above 2.0 | 2(2.4) | 2(2.6) | – |
| Comorbidity diseases | |||
| Pulmonary diseases (%) | |||
| Yes | 17(20.7) | 13(16.7) | – |
| No | 65(79.3) | 65(83.3) | – |
| Non-pulmonary diseases (%) | |||
| Yes | 59(72.0) | 53(67.9) | – |
| No | 23(28.1) | 25(32.1) | – |
| Other cancersa (%) | |||
| Yes | 27(32.9) | 24(30.8) | – |
| No | 55(67.1) | 54(69.2) | – |
| Lung cancer recurrence/progression/new primary | |||
| Yes (%) | 37(45.1) | 34(43.6) | 205(46.4) |
| No (%) | 45(54.9) | 44(56.4) | 156(35.3) |
| Unknown | – | – | 81(18.3) |
| Treatment modality | |||
| Surgery only (%) | 56(68.3) | 52(66.7) | 330(74.7) |
| Surgery with chemotherapy or radiation (%) | 26(31.7) | 26(33.3) | 109(24.7) |
| Unknown | – | – | 3(0.7) |
Excludes non-melanoma skin cancer.
–, not available
Outcomes
Overall survival time, as the primary endpoint, was defined as the time from lung cancer diagnosis to either death or the last known date alive. Patients known to be alive were censored at the time of last contact.
Microarray analysis and data processing
For the discovery data set, RNA was extracted from fresh frozen tissues using the Qiagen miRNeasy Mini Kit (Qiagen, Valencia, CA). Illumina Human WG DASL beadchip (Illumina, Inc, San Diego, CA, USA) was used for gene expression profiling. Raw intensity data were generated in three batches. For each batch, samples were loaded into BeadStudio 3.1 (gene expression module 3.4) for quality control and calculation of gene or probe level intensity for each individual sample. Samples with a signal-to-noise ratio (ratio of 95% vs. 5% percentile signal intensity) less than 10 were excluded or repeated. Samples that passed quality control were normalized together using R package Fastlo function [15]. After the normalization, further quality control was done to assess a potential batch effect, and adequacy of normalization with principal components analysis (PCA), unsupervised clustering, and sample replicates. No noticeable batch effect was seen, and the correlation among the replicates across batches was generally high (r2>0.95). All 82 adenocarcinoma tumor and 78 matched normal lung tissues were used for network analysis. The expression data consisted of 24,526 microarray probes, representing 18,626 unique genes.
For the validation data set 1 (tumor tissues only), 442 samples with good quality of the clinic, pathological, and array data were included. The microarray data was generated with Affymetrix Human Genome U133 Array Chip A (22,277 probe sets representing 12,969 unique genes) and downloaded from National Cancer Institute Array Data Management System (https://caarraydb.nci.nih.gov/caarray/publicExperimentDetailAction.do?expId=1015945236141280). Links to pathological and clinical data are also available at this site. Raw data was imported into Genome Suite (Partek, St. Louis, MO), and normalized using Robust Multichip Average (RMA) method. Potential sample outliers were examined by clustering and PCA. No outlier sample was found.
We downloaded validation data set 2 (tumor tissues only) from National Cancer Institute Array Data Management System (https://array.nci.nih.gov/caarray/project/details.action?project.id=191). The microarray data was generated with Affymetrix Human U95A oligonucleotide probe arrays and consisted of 12625 microarray probes, representing 9128 unique genes. Raw data was normalized using the same method as validation set 1. A total of 92 adenocarcinoma tumor samples with complete clinic information were included for validation analysis. The characteristics of the patients were summarized in the Supplementary Table 1.
Data Analysis
Gene Network analysis
WGCNA tool [6, 7] was used to evaluate the gene networks and their association with clinical outcome. Because the software tool was computationally intensive when running on large numbers of genes, we simplified the computation by selecting the top 5,000 most variable genes based on coefficient of variance for each data set. We input expression profiles of these selected genes and constructed weighted gene co-expression modules [6, 7, 16]. We used a hierarchical clustering with dissimilarity based on topological overlap as the distance measure to produce a hierarchical clustering tree of genes. We chose a Static Tree Cut method to identify modules with a height cutoff of 0.95 and a minimum size (gene number) cutoff of 40 for the resulting dendrogram. In the network analysis, a cluster of highly correlated genes in expression is called module. A summary profile of each module is the module eigengene (ME) that corresponds to the first principal component of the module. The ME can be considered as the most representative gene expression in the module.
Module eigengene and clinical trait association analysis
To test if a module was correlated with clinical variables, we calculated the correlation between MEs and clinical characteristics (gender, age, stage, and tumor grade of differentiation). For module-survival association analysis, we first standardized the ME values by dividing the MEs with the standard deviation in a given module. We then used Cox proportional hazards regression to assess the associations between MEs and overall survival. We applied a stepwise selection process to select the clinical variables for subsequent adjustment from known prognostic variables, including tumor stage, grade of differentiation, age at diagnosis, sex, race, comorbidity, and treatment modality. The significant variables were kept as covariates in all subsequent analyses.
Gene significance and hub genes
Gene significance (GS) was the absolute value of the correlation coefficient between an individual gene expression and a clinical trait. For survival-based GS, we used a univariate Cox proportional hazards regression model to regress patient’ overall survival on the individual gene expression levels. The survival-related GS was defined as minus log10 of the univariate Cox-regression p-values. Hub genes were those that show high network connectivity (K). K measured how a given gene was connected (co-expressed) with other genes in a given module. Based on the GS and K, we used scatter plots to identify hub genes that showed high correlation with clinic traits as well as high connectivity in the trait-related modules.
All analyses were conducted using SAS version 9 (SAS Institute, Cary, NC, USA) or R statistical packages (www.r-project.org).
Gene ontology and pathway analysis
To explore whether genes in each module share a common biological function, we searched for overrepresentation in gene ontology (GO) categories. The WGCNA package has a function to perform GO enrichment analysis. For each module, the analysis calculated enrichment scores (Fisher exact test p value) for all GO terms in the specified ontologies (biological processes), and collected information about the terms with the highest enrichment. Multiple testing was corrected using the Bonferroni method. Gene pathway annotation was performed by MetaCore software (GeneGo, Inc. St. Joseph, MI) [17].
Outcome prediction
To estimate the survival prediction enhancement by the top gene signature, we generated a risk index for each case that is a linear combination of the log2 gene expression multiplied by its estimated regression coefficient (beta coefficient) from the univariate Cox model for each gene. Patients were then classified as either low or high risk, depending on whether their risk index was above or below the median (50th percentile cutoff point) of the risk indexes. The time-dependent receiver operating characteristic curves (ROC) and the area under the curve (AUC as measured by C index) over a 5-year follow-up period were generated using clinical variables along with or without this binary index. AUC plots were created using RisksetAUC function for R (www.r-project.org). The Kaplan-Meier curves and log-rank tests were used to assess the differences in survival time by low- or high-risk groups. The Cox proportional hazards model was applied to assess the independent value of the risk prediction along with conventional predictors of age, gender, stage, grade of tumor cell differentiation, and treatment modality.
Results
Identification of survival-related clinical variables
We first used a stepwise selection process in a Cox regression model to screen potential confounding clinical variables. For the discovery tumor tissue set, we found the survival association with age, tumor grade, and treatment modality. For the normal tissue set, we found the association with age and treatment modality. For the validation set 1, we observed the association with age and stage (Supplementary Table 2). These variables were adjusted in following data analysis. For validation set 2, age, gender, tumor stage and grade were adjusted in following data analysis.
Identification of survival-related gene module
To identify the gene co-expression modules, we applied WGCNA methodology and analyzed gene expression profiles derived from 82 lung adenocarcinoma tumor tissues. This analysis identified eight gene modules ranging in size from 45 to 297 genes (Figure 1). We found significant association of tumor grade with two module MEs (r= -0.29, P=0.009 in pink module and r=0.38, P=0.0004 in red module). Interestingly, the red module was also associated with overall survival. After adjusting for potential confounders, the association between red module and survival was still significant (P=0.027, HR, 1.71; 95% CI, 1.06-2.74) (Table 2).
Figure 1.
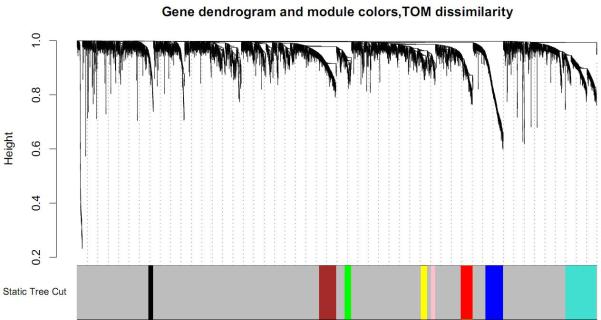
Clustering dendrogram of genes from discovery set of 82 lung adenocarcinoma tumors. The dendrogram is displayed together with color assignment: the grey color represents genes outside of all modules (all other colors). In the dendrogram, each leaf, that is a short vertical line, corresponds to a gene. Branches are expression modules consisting of densely interconnected and highly co-expressed genes.
Table 2.
Association of expression modules with overall survival in discovery set of 82 lung adenocarcinoma tumors
| Modules | Total gene count | Correlation with tumor grade |
Association with overall survival* |
GO enrichment analysis |
|||||
|---|---|---|---|---|---|---|---|---|---|
| r | P value | HR (95% CI) | P value | Biological process term | Gene count | P value | Bonferroni P value | ||
| Blue | 170 | -0.13 | 2.00×10⁻¹ | 0.97(0.71-1.31) | 8.27×10⁻¹ | Cilium | 8 | 1.02×10⁻⁸ | 6.90×10⁻⁵ |
| Black | 45 | -0.16 | 2.00×10⁻¹ | 0.82(0.50-1.33) | 4.18×10⁻¹ | Apical part of cell | 5 | 9.32×10⁻⁶ | 6.29×10⁻² |
| Yellow | 54 | -0.16 | 2.00×10⁻¹ | 0.79(0.53-1.16) | 2.19×10⁻¹ | Mammary gland development | 3 | 7.25×10⁻⁵ | 4.90×10⁻¹ |
| Pink | 40 | -0.29 | 9.00×10⁻³ | 0.79(0.55-1.15) | 2.19×10⁻¹ | Metanephros development | 3 | 9.70×10⁻⁵ | 6.55×10⁻¹ |
| Turquoise | 297 | 0.025 | 8.00×10⁻¹ | 0.95(0.64-1.43) | 8.17×10⁻¹ | Olfactory receptor activity | 102 | 1.91×10-115 | 1.29×10-111 |
| Brown | 165 | 0.16 | 2.00×10⁻¹ | 1.44(0.97-2.12) | 6.85×10⁻² | Zinc ion binding Purine | 26 | 3.03×10⁻⁴ | 1.00×100 |
| Green | 63 | 0.14 | 2.00×10⁻¹ | 1.18(0.80-1.74) | 3.99×10⁻¹ | nucleotide binding | 16 | 2.43×10⁻⁵ | 1.64×10⁻¹ |
| Red | 115 | 0.38 | 4.00×10⁻⁴ | 1.71(1.06-2.74) | 2.70×10⁻² | Cell cycle | 53 | 2.08×10-53 | 1.40×10-49 |
Hazard ratios (HRs), 95% confidence intervals (CI), and p-values were calculated using Cox proportional hazards regression analysis adjusted for age, grade and treatment.
r= Pearson correlation coefficient.
Enrichment of cell cycle genes in the survival-related module
To elucidate potential biological mechanisms of each gene module, we performed GO enrichment analysis and found significant GO term enrichment in three of the eight modules (Table 2). The most significant enrichments were the red module (PBonferroni = 2.1×10-53 for cell cycle) and turquoise module (PBonferroni= 1.29×10-111 for olfactory receptor activity). Because the cycle cell-related module was the only one showing association with overall survival, we further examined the module genes for correlation between GS and gene connectivity. Interestingly, the survival-related GS was significantly correlated with gene connectivity (r=0.44, P=5.8×10⁻⁷) (Figure 2), indicating that the genes with more significant survival association tended to be highly connected genes, thus the most important genes in the module.
Figure 2.

Scatter plots of gene significance for overall survival and gene connectivity in the cell cycle-related module (red module) from discovery set of 82 lung adenocarcinoma tumors. Each cycle represents a gene whose location is mapped according to its connectivity (number of connected genes in the module) and significance for survival. Significant correlation between connectivity and gene significance indicates that highly connected genes tend to be associated with overall survival. cor= Pearson correlation coefficient.
Validation of survival-associated gene module
To validate our initial finding, we examined an independent microarray gene expression dataset including 442 lung adenocarcinoma patients (validation set 1) and identified six gene modules (Supplementary Figure 1). We found the same association: the cell cycle-enriched module (red) was correlated with tumor grade (r=0.56, P =5×10-37) and overall survival. After adjusting for potential confounders, the red module-survival association remained significant (adjusted P=5×10⁻³; HR=1.26; 95% CI, 1.08-1.49) (Supplementary Table 3). None of the other modules showed significant association with overall survival. For the cell cycle module, survival- and grade-related GS were highly correlated with gene connectivity (Supplementary Figure 2). Because the validation set 1 included 49 never smokers, 256 former smokers and 31 current smokers, we stratified these patients by smoking status and tested the module for the grade association and survival prediction. We found significant association of the red module with tumor grade regardless of smoking status (r=0.49, 0.51 and 0.61 for never, former and current smokers, respectively; all P≤3.68×10⁻⁴). However, the module-survival association only remained significant in former smokers (P=9.2×10⁻³; HR=1.33; 95% CI, 1.07-1.66). We did not observe significant module-survival association in never smokers and current smokers although they showed the same trend (Supplementary Table 3).
Cell cycle genes in survival-related module in normal lung tissues
To evaluate whether overall survival was associated with any gene module in normal lung tissues, we performed the network analysis using normal lung tissues derived from 78 of the 82 lung adenocarcinoma patients. We identified six co-expression modules ranging in size from 64 to 248 (Supplementary Figure 3). Among the six modules, one (red) showed significant association with overall survival. After adjusting for potential confounders, the p value remained significant (adjusted P=6×10⁻⁴, HR=1.91; 95% CI, 1.32-2.75) (Supplementary Table 4). The red module was also significantly enriched with cell cycle-related genes (P=4.1×10-41). The survival-related GS and gene connectivity were also highly correlated in the normal tissue data set (Supplementary Figure 4).
Overall survival-related hub genes
Centralized genes (hub genes) are more likely to have a key role in a highly connected network. We compared overall survival-related modules and found 30 genes that are shared between the discovery and validation data sets. For the 30 genes, we first applied a paired t-test for the 78 available normal-tumor pairs (discovery data set) for potential differential expression. We observed significant difference in all 30 genes (range of p values from 6.58×10⁻⁶ to 5.89×10⁻¹⁴). All these 30 genes were up-regulated in adenocarcinoma tissues compared to the matched normal lung tissues (Supplementary Table 5). Pathway analysis mapped these 30 common genes to 12 biological pathways with a metaphase checkpoint (8 of the 30 genes) as the most significant pathway (P=7.69×10⁻¹⁶) (Supplementary Figure 5). Of the 30 genes, we further defined three genes (UBE2C, TPX2 and MELK) as hub genes because of their high connectivity in the survival related modules (Supplementary Table 6). Furthermore, the gene expression of each of the 3 hub genes was significantly associated with overall survival in both discovery set and validation set 1 (Table 3). A network map showing the interaction of 3 hub genes with other genes was constructed using Metacore Genego pathway analysis (Supplementary Figure 6).
Table 3.
Association of 3 top genes with overall survivala
| Gene | Discovery set |
Validation set 1 |
||||
|---|---|---|---|---|---|---|
| Tumor b |
Normal c |
Tumor d |
||||
| HR(95%CI) | P value | HR (95%CI) | P value | HR (95%CI) | P value | |
| TPX2 | 1.95(1.06-3.58) | 0.032 | 1.89(1.08-3.29) | 0.025 | 1.22(1.02-1.45) | 0.026 |
| UBE2C | 2.83(1.24-6.42) | 0.013 | 2.31(1.30-4.10) | 0.005 | 1.23(1.05-1.44) | 0.011 |
| MELK | 1.96(1.15-3.35) | 0.014 | 2.50(1.37-4.58) | 0.003 | 1.23(1.04-1.47) | 0.018 |
| 3-gene risk index e | 3.85(1.34-11.05) | 0.012 | 3.35(1.08-10.4) | 0.036 | 1.72(1.21-2.46) | 0.003 |
The model coefficients and cut off points of the results were showed in the Supplementary Tables 12-14.
Hazard ratios (HRs), 95% confidence intervals (CI), and p-values were calculated using Cox proportional hazards regression analysis adjusted for age, grade and treatment.
HRs and p-values were calculated using Cox proportional hazards regression analysis adjusted for age, treatment and grade.
HRs and p-values were calculated using Cox proportional hazards regression analysis adjusted for age, stage and grade.
We generated a risk index for each case that is a linear combination of the log2 3-gene expression multiplied by its estimated regression coefficient (beta coefficient) from the univariate Cox model for each gene. Patients were then classified as either low or high risk, depending on whether their risk index was above or below the median (50th percentile cutoff point) of the risk indexes.
To estimate the survival prediction using these three hub genes, we built an expression-based prediction model. In the discovery tumor set , patients with a high-risk gene signature have a 3.85 fold higher risk (95% CI, 1.34-11.05, Table 3) of death than patients with a low-risk gene signature. In the validation set 1, this high-risk gene signature remained significant in predicting 5-year survival (HR 1.72; 95%CI, 1.21-2.46). When compared to the clinical variables-only model, although adding the 3-gene signatures in the discovery set slightly improved the survival prediction accuracy from 0.70 to 0.72 (Figure 3A), incorporation of the 3-gene signature in the validation set increased the prediction accuracy from 0.69 to 0.72 (Figure 3C). When 78 normal lung tissues were evaluated, the 3-gene signature showed a predictive value with a HR of 3.35 (95%CI, 1.08-10.4); adding this signature to the conventional prediction model increased the prediction accuracy from 0.74 to 0.76 (Figure 3E). We also analyzed the survival prediction three hub genes using only stage I patients, and found that the prognostic results on stage I tumors were consistent the results from all stages in discovery tumor set and validation set 1 (Supplementary Table 7, 9, and Supplementary Figure 7). For the normal lung tissue set, the 3-gene signature showed a predictive value with a HR of 2.73 (95%CI, 0.64-11.7); adding this signature to the conventional prediction model increased the prediction accuracy from 0.84 to 0.85 (Supplementary Table 8 and Supplementary Figure 7 E), showing no statistic significance.
Figure 3.
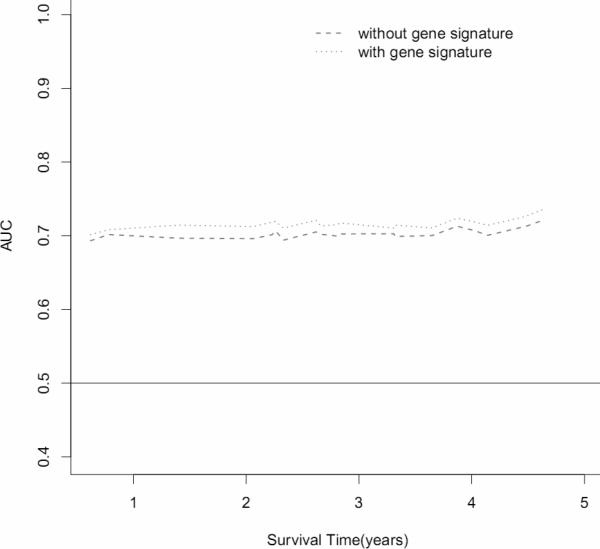
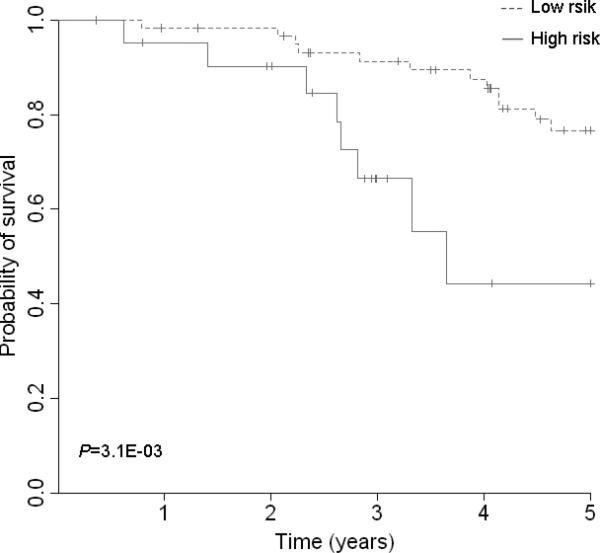
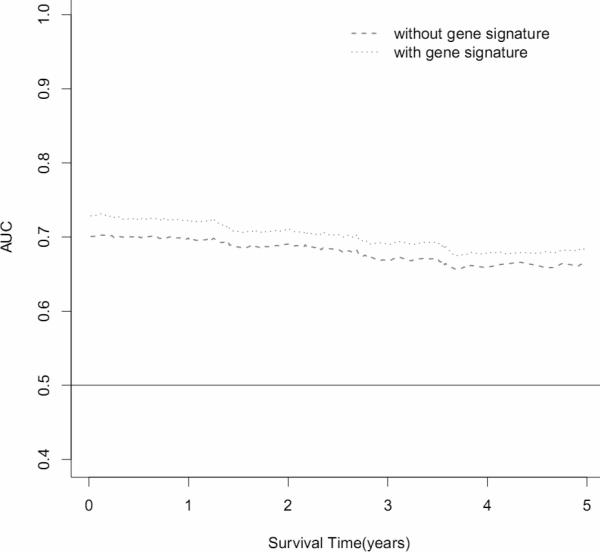


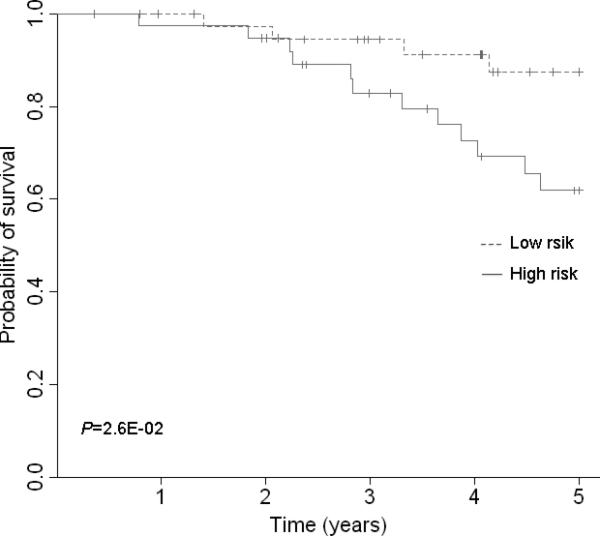
Survival prediction of 3 top gene signatures (UBE2C, TPX2 and MELK). (A) Area under the curve (AUC) for 82 lung adenocarcinoma tumors from the discovery set. With addition of the 3 gene signature, survival prediction was improved from 0.70 to 0.72. (B) Kaplan-Meier curves for 82 lung adenocarcinoma tumors from discovery dataset. (C) AUC for 442 lung adenocarcinoma tumors from the validation dataset. With addition of the 3 gene signature, survival prediction was improved from 0.69 to 0.72. (D) Kaplan-Meier curves for 442 lung adenocarcinoma tumors from the validation dataset. (E) AUC for 78 lung normal tissues from the discovery dataset. With addition of the 3 gene signature, survival prediction was improved from 0.74 to 0.76. (F) Kaplan-Meier curves for 78 lung normal tissues from the discovery dataset.
To further validate the prognostic result of these 3 genes (UBE2C, TPX2 and MELK), we analyzed the association of 3 top genes and 3-gene risk index with overall survival for all tumor stages and stage I in validation set 2. Patients with a high-risk gene signature have a 1.52 fold higher risk (95% CI, 1.02–2.24, Supplementary Table 10) of death than patients with a low-risk gene signature. Stage I patients with a high-risk gene signature have a 2.4 fold higher risk (95% CI, 1.16-4.96, Supplementary Table 11) of death than patients with a low-risk gene signature. With addition of the 3 gene signature, survival prediction for stage I patients was improved from 0.67 to 0.72 (Supplementary Figure 8).
Discussion
In this study, we applied a systems biology approach and examined gene co-expression patterns in lung adenocarcinoma and matched normal tissues. We identified a gene module enriched with cell cycle-related genes. Expression signatures of the module were significantly correlated with tumor grade and overall survival in both tumor and matched normal tissues. Importantly, the module-based expression signature improved survival prediction when combined with clinical variables. The results were validated in two independent data sets, which demonstrated the robustness of our findings.
We observed significant association of the cell cycle-related gene module with patients’ overall survival in tumor as well as normal lung tissues, indicating that the germline-determined molecular signatures may also predict overall survival of lung cancer patients. This further reinforces the important role of cycle cell-related gene network in determining disease progression and patients’ survival. Although normal lung tissue was taken form the farthest distance to the tumor in the resected lung, we could not completely rule out the possibility of tumor field effect on the expression signature.
We adopted a systems biology approach by focusing on a handful of modules rather than tens of thousands of individual genes. The benefit of the network-based approach is its ability to reveal complex biological mechanisms responsible for the phenotype of interest and alleviate multiple testing problems inherent in microarray data analysis. Our analysis identified 30 genes that are shared between the discovery and validation set 1. All these 30 genes were up-regulated in adenocarcinoma tissues compared to the matched normal lung tissues, although differential expression of most of these genes are lower than the most commonly used threshold fold change of 2. These 30 genes need to be validated through further studies in independent sets of patients. Of these genes, three hub genes (UBE2C, TPX2 and MELK) demonstrated significant association with overall survival. UBE2C and TPX2 have been reported as gene signatures for human lung cancer prognosis in vitro lung carcinogenesis system [18]. MELK was identified as a key regulator of the proliferation of malignant brain tumors and aggressiveness in human astrocytomas [19, 20], and was also associated with breast cancer prognosis [21].
It is well known that adenocarcinoma exhibits distinct molecular pathways in smokers and nonsmokers [22-25]. However, little is known about the different effects of gene expression on the overall survival between smokers and never smokers. In this three-phase study, we analyzed never smokers in discovery data set, and both smokers and non-smokers in validation data set. To further elucidate the smoking effect, we stratified these patients by smoking status and found the significant association of module expression signatures with overall survival in the subgroup of former smokers. Although the expression signature was not significantly associated with overall survival in the subgroups of never smokers and current smokers (possibly due to the small sample sizes), the trends of the HRs were the same as the one in former smokers. Furthermore, the survival predicting of these 3 genes was further validated using validation set 2 consisted of both smoker and never smoker patients. Overall, our results suggest that alterations in cell cycle genes and pathways are associated with tumor grade and contribute to the patient survival regardless smoking status.
In summary, this study used a systems biology-based network approach and identified a group of highly correlated genes that showed significant association with clinical outcome in patients with lung adenocarcinoma. From a survival-related gene module, we further defined 3 hub genes whose expression signatures provide a moderate yet consistently improved survival prediction for adenocarcinoma beyond conventional predictors. However, further studies are needed to evaluate possible application of the molecular signatures for survival prediction and to functionally characterize the key genes for potential therapeutic targets.
Supplementary Material
Acknowledgments
We thank the Mayo Biospecimen Processing Core for RNA extraction and the Gene Expression Core for all the gene expression profiling of Mayo samples used in this study. Additionally, we thank Susan Ernst, M.A., for her technical assistance with the manuscript.
Funding
This work was supported by National Institutes of Health grants (R01 CA 80127, R01 CA84354, R01 CA 115857, and R03 CA 77118 to P.Y.), Advancing a Healthier Wisconsin program (to L.W.), Mayo Clinic Foundation funds, and National Natural Science Foundation of China (No. 81171903 to Y.L.) and Chongqing Natural Science Foundation of China (No. CSTC 2011BB5024 to Y.L.).
Footnotes
Publisher's Disclaimer: This is a PDF file of an unedited manuscript that has been accepted for publication. As a service to our customers we are providing this early version of the manuscript. The manuscript will undergo copyediting, typesetting, and review of the resulting proof before it is published in its final citable form. Please note that during the production process errors may be discovered which could affect the content, and all legal disclaimers that apply to the journal pertain.
Conflict of interest statement
None declared.
References
- 1.Borczuk AC, Toonkel RL, Powell CA. Genomics of lung cancer. Proc Am Thorac Soc. 2009;6:152–8. doi: 10.1513/pats.200807-076LC. [DOI] [PMC free article] [PubMed] [Google Scholar]
- 2.Garber ME, Troyanskaya OG, Schluens K, Petersen S, Thaesler Z, Pacyna-Gengelbach M, et al. Diversity of gene expression in adenocarcinoma of the lung. Proc Natl Acad Sci U S A. 2001;98:13784–9. doi: 10.1073/pnas.241500798. [DOI] [PMC free article] [PubMed] [Google Scholar]
- 3.Bhattacharjee A, Richards WG, Staunton J, Li C, Monti S, Vasa P, et al. Classification of human lung carcinomas by mRNA expression profiling reveals distinct adenocarcinoma subclasses. Proc Natl Acad Sci U S A. 2001;98:13790–5. doi: 10.1073/pnas.191502998. [DOI] [PMC free article] [PubMed] [Google Scholar]
- 4.Beer DG, Kardia SL, Huang CC, Giordano TJ, Levin AM, Misek DE, et al. Gene-expression profiles predict survival of patients with lung adenocarcinoma. Nat Med. 2002;8:816–24. doi: 10.1038/nm733. [DOI] [PubMed] [Google Scholar]
- 5.Shedden K, Taylor JM, Enkemann SA, Tsao MS, Yeatman TJ, Gerald WL, et al. Gene expression-based survival prediction in lung adenocarcinoma: a multi-site, blinded validation study. Nat Med. 2008;14:822–7. doi: 10.1038/nm.1790. [DOI] [PMC free article] [PubMed] [Google Scholar]
- 6.Horvath S, Zhang B, Carlson M, Lu KV, Zhu S, Felciano RM, et al. Analysis of oncogenic signaling networks in glioblastoma identifies ASPM as a molecular target. Proc Natl Acad Sci U S A. 2006;103:17402–7. doi: 10.1073/pnas.0608396103. [DOI] [PMC free article] [PubMed] [Google Scholar]
- 7.Zhang B, Horvath S. A general framework for weighted gene co-expression network analysis. Stat Appl Genet Mol Biol. 2005;4 doi: 10.2202/1544-6115.1128. Article17. [DOI] [PubMed] [Google Scholar]
- 8.Fuller TF, Ghazalpour A, Aten JE, Drake TA, Lusis AJ, Horvath S. Weighted gene coexpression network analysis strategies applied to mouse weight. Mamm Genome. 2007;18:463–72. doi: 10.1007/s00335-007-9043-3. [DOI] [PMC free article] [PubMed] [Google Scholar]
- 9.Ghazalpour A, Doss S, Zhang B, Wang S, Plaisier C, Castellanos R, et al. Integrating genetic and network analysis to characterize genes related to mouse weight. PLoS Genet. 2006;2:e130. doi: 10.1371/journal.pgen.0020130. [DOI] [PMC free article] [PubMed] [Google Scholar]
- 10.Miller JA, Oldham MC, Geschwind DH. A systems level analysis of transcriptional changes in Alzheimer's disease and normal aging. J Neurosci. 2008;28:1410–20. doi: 10.1523/JNEUROSCI.4098-07.2008. [DOI] [PMC free article] [PubMed] [Google Scholar]
- 11.Yang X, Deignan JL, Qi H, Zhu J, Qian S, Zhong J, et al. Validation of candidate causal genes for obesity that affect shared metabolic pathways and networks. Nat Genet. 2009;41:415–23. doi: 10.1038/ng.325. [DOI] [PMC free article] [PubMed] [Google Scholar]
- 12.Yang P, Bamlet WR, Sun Z, Ebbert JO, Aubry MC, Krowka MJ, et al. Alpha1-antitrypsin and neutrophil elastase imbalance and lung cancer risk. Chest. 2005;128:445–52. doi: 10.1378/chest.128.1.445. [DOI] [PubMed] [Google Scholar]
- 13.Yang P, Sun Z, Krowka MJ, Aubry MC, Bamlet WR, Wampfler JA, et al. Alpha1-antitrypsin deficiency carriers, tobacco smoke, chronic obstructive pulmonary disease, and lung cancer risk. Arch Intern Med. 2008;168:1097–103. doi: 10.1001/archinte.168.10.1097. [DOI] [PMC free article] [PubMed] [Google Scholar]
- 14.Yang P, Wentzlaff KA, Katzmann JA, Marks RS, Allen MS, Lesnick TG, et al. Alpha1-antitrypsin deficiency allele carriers among lung cancer patients. Cancer Epidemiol Biomarkers Prev. 1999;8:461–5. [PubMed] [Google Scholar]
- 15.Ballman KV, Grill DE, Oberg AL, Therneau TM. Faster cyclic loess: normalizing RNA arrays via linear models. Bioinformatics. 2004;20:2778–86. doi: 10.1093/bioinformatics/bth327. [DOI] [PubMed] [Google Scholar]
- 16.Langfelder P, Zhang B, Horvath S. Defining clusters from a hierarchical cluster tree: the Dynamic Tree Cut package for R. Bioinformatics. 2008;24:719–20. doi: 10.1093/bioinformatics/btm563. [DOI] [PubMed] [Google Scholar]
- 17.Nikolsky Y, Ekins S, Nikolskaya T, Bugrim A. A novel method for generation of signature networks as biomarkers from complex high throughput data. Toxicol Lett. 2005;158:20–9. doi: 10.1016/j.toxlet.2005.02.004. [DOI] [PubMed] [Google Scholar]
- 18.Kadara H, Lacroix L, Behrens C, Solis L, Gu X, Lee JJ, et al. Identification of gene signatures and molecular markers for human lung cancer prognosis using an in vitro lung carcinogenesis system. Cancer Prev Res (Phila) 2008;2:702–11. doi: 10.1158/1940-6207.CAPR-09-0084. [DOI] [PMC free article] [PubMed] [Google Scholar]
- 19.Marie SK, Okamoto OK, Uno M, Hasegawa AP, Oba-Shinjo SM, Cohen T, et al. Maternal embryonic leucine zipper kinase transcript abundance correlates with malignancy grade in human astrocytomas. Int J Cancer. 2008;122:807–15. doi: 10.1002/ijc.23189. [DOI] [PubMed] [Google Scholar]
- 20.Nakano I, Masterman-Smith M, Saigusa K, Paucar AA, Horvath S, Shoemaker L, et al. Maternal embryonic leucine zipper kinase is a key regulator of the proliferation of malignant brain tumors, including brain tumor stem cells. J Neurosci Res. 2008;86:48–60. doi: 10.1002/jnr.21471. [DOI] [PubMed] [Google Scholar]
- 21.Pickard MR, Green AR, Ellis IO, Caldas C, Hedge VL, Mourtada-Maarabouni M, et al. Dysregulated expression of Fau and MELK is associated with poor prognosis in breast cancer. Breast Cancer Res. 2009;11:R60. doi: 10.1186/bcr2350. [DOI] [PMC free article] [PubMed] [Google Scholar]
- 22.Landi MT, Dracheva T, Rotunno M, Figueroa JD, Liu H, Dasgupta A, et al. Gene expression signature of cigarette smoking and its role in lung adenocarcinoma development and survival. PLoS One. 2008;3:e1651. doi: 10.1371/journal.pone.0001651. [DOI] [PMC free article] [PubMed] [Google Scholar]
- 23.Miura K, Bowman ED, Simon R, Peng AC, Robles AI, Jones RT, et al. Laser capture microdissection and microarray expression analysis of lung adenocarcinoma reveals tobacco smoking- and prognosis-related molecular profiles. Cancer Res. 2002;62:3244–50. [PubMed] [Google Scholar]
- 24.Powell CA, Spira A, Derti A, DeLisi C, Liu G, Borczuk A, et al. Gene expression in lung adenocarcinomas of smokers and nonsmokers. Am J Respir Cell Mol Biol. 2003;29:157–62. doi: 10.1165/rcmb.2002-0183RC. [DOI] [PubMed] [Google Scholar]
- 25.Subramanian J, Govindan R. Lung cancer in never smokers: a review. J Clin Oncol. 2007;25:561–70. doi: 10.1200/JCO.2006.06.8015. [DOI] [PubMed] [Google Scholar]
Associated Data
This section collects any data citations, data availability statements, or supplementary materials included in this article.