Abstract
The detection of airport attracts lots of attention and becomes a hot topic recently because of its applications and importance in military and civil aviation fields. However, the complicated background around airports brings much difficulty into the detection. This paper presents a new method for airport detection in remote sensing images. Distinct from other methods which analyze images pixel by pixel, we introduce visual attention mechanism into detection of airport and improve the efficiency of detection greatly. Firstly, Hough transform is used to judge whether an airport exists in an image. Then an improved graph-based visual saliency model is applied to compute the saliency map and extract regions of interest (ROIs). The airport target is finally detected according to the scale-invariant feature transform features which are extracted from each ROI and classified by hierarchical discriminant regression tree. Experimental results show that the proposed method is faster and more accurate than existing methods, and has lower false alarm rate and better anti-noise performance simultaneously.
Keywords: Visual attention, Saliency map, Airport detection, Scale-invariant feature transform (SIFT), Hierarchical discriminant regression (HDR) tree, Hough transform
Introduction
Remote sensing images contain large amount of geographical environmental information and have been widely used in different scientific fields. The advantage of high spatial-resolution of remote sensing images provides opportunity to detect important objects such as bridges, ships, roads and airports (Second and Zakhor 2007; Ding et al. 2011). Among these, the automatic detection of airport becomes a hot topic recently because of its applications and importance in military and civil aviation fields. Unfortunately, the complicated background around airports, which includes buildings, mountains, and roads and so on, brings much difficulty to the detection. Furthermore, the analysis of a remote sensing image is time-consuming due to its large size. So it is critical to consider the complexity of algorithm in order to reduce the computational cost.
Runways are the primary characteristic of an airport in remote sensing images. Therefore, previous works on airport detection mainly focus on the capture of runway features and can be generally classified into two types by their different ways to locate regions of interest (ROIs) (Wang et al. 2011): edge detection-based and image segmentation-based. The former uses edge detection on an image and extracts straight lines by Hough transform (Duda and Hart 1972) to make sure ROIs (Wang et al. 2011; Qu et al. 2005; Pi et al. 2003). For example, the algorithm proposed by Qu et al. (2005) removes short or curled edges produced by edge detection and then long straight lines are detected to locate ROIs. Finally the airport area would be recognized according to texture features in each ROI. This kind of methods is simple and fast, but difficult to distinguish an airport from the interferential objects around it, which also possess straight lines parts. Besides, locating airports only using the result of Hough transform is not exact in respect that the length of the detected lines cannot match well with the one of runways. On the other hand, the latter concentrates on the textural difference between an airport and its surroundings, and applies image segmentation to locate ROIs (Tao et al. 2011; Liu et al. 2004). For example, the algorithm in Tao et al. (2011) is a typical one which has been proposed recently. It finds ROIs by the segmentation result and the feature points’ density of scale-invariant feature transform (SIFT) of an image (Lowe 2004). Then it judges the position of the airport by statistical characteristics, such as mean, variance and other moments. Compared with the edge detection-based method, the image segmentation-based one improves the precision of ROI location apparently, but brings higher complexity due to the procedure of pixel-by-pixel analysis, which is also sensitive to parameters. What is more, for both methods, it is a key problem that whether the selected statistical characteristics, which are used to locate airports, are robust to affine transformation. In addition, the false alarm rate of the detection was less mentioned in previous works, but it is very important in practice.
Recently, the visual attention (Desimone and Duncan 1995; Gu and Liljenstrom 2007; Haab et al. 2011) has been widely used in pattern recognition field and received good results in natural images. Visual attention is one of the most important parts of consciousness (Crick and Koch 1998, 2003; Crick et al. 2004), with the aid of which human vision can easily and rapidly focus on salient objects in his sight but machines cannot. The course of visual attention mechanism can be divided into two stages: bottom-up and top-down (Treisman and Gelade 1980). In the bottom-up stage, several basic visual features, such as color, motion and orientation, are processed in parallel to “pop out” distinctive features (Bian and Zhang 2010; Yu et al. 2011). This stage only relies on the input data. Whereas the top-down stage brings one’s knowledge and judgment into the creation of the saliency map. These artificial factors may help us to find the targets more efficiently.
Several computational models have been proposed to simulate visual attention so far (Itti et al. 1998; Itti 2000; Walther et al. 2002; Itti and Koch 2000; Itti and Baldi 2005; Bruce and Tsotsos 2005; Walther and Koch 2006; Hou and Zhang 2007; Harel et al. 2007; Gao et al. 2007; Guo et al. 2008). In early stages, Itti et al. proposed a bottom-up model and built a computational system called Neuromorphic Vision C++ Toolkit (NVT) (Itti et al. 1998; Itti 2000; Itti and Koch 2000; Itti and Baldi 2005). In this model, the input image is processed by different pyramid filters firstly, and then the operation of center-surround difference between different scale maps is done in each pyramid and a saliency map is obtained after combining these results together. After that, Walther et al. extended Itti’s model to define proto object regions accurately and created Saliency Tool Box (STB) (Walther et al. 2002; Walther and Koch 2006). However, it is hard to apply both the two models due to the high complexity and parameters selection. To solve this problem, models in frequency domain are proposed, such as spectral residual (SR) (Hou and Zhang 2007) and phase spectrum of Fourier transform (PFT) (Guo et al. 2008). The PFT model extracts the phase spectrum of the Fourier transform of an image to calculate the saliency map. Compared with NVT and STB, these frequency-domain models are faster, simpler and not reliant on parameters. But they receive worse results on more complicated remote sensing images than natural images. Further, we find that the graph-based visual saliency (GBVS) (Harel et al. 2007) model proposed by Harel et al. is competent for target detection in complex background. This model is based on the graph theory and creates a Markov chain on the graph to highlight points which are much different with others. Nevertheless, it is still limited by its computational time.
In this paper, we introduce the visual attention mechanism into the airport detection because airports are salient in remote sensing images. By this way, the disadvantages of low detection efficiency caused by pixel-to-pixel analysis can be overcome. Our approach includes the detection stage and the recognition stage. At the former stage, the GBVS model is adopted to compute the saliency map for its better performance in complicated background. In order to get over the weakness of GBVS, we use the Hough transform result of the input image instead of the orientation channel in GBVS model, which can not only catch hold of the typical feature of airport detection but also speeds up the creation of saliency map apparently. Then at the latter stage, the SIFT feature is used as the feature descriptor of ROIs by reason of its invariance to affine transform, while the hierarchical discriminant regression (HDR) (Hwang and Weng 2000) tree which has fast learning and searching speed is applied as a classifier for the SIFT feature. Compared with traditional methods, our approach acquires higher computational speed and recognition rate, as well as lower false alarm rate and better anti-noise performance.
The rest of this paper is organized as follows. In “The improved GBVS model” section, we introduce the original GBVS model and our improved model for the airport detection problem. “The proposed algorithm” section presents the proposed algorithm for airport detection based on the improved model of visual attention. Experimental results on the Google Earth data and China-Brazil earth resource satellite (CBERS) data are given in “Experimental results” section, followed by “Discussions” and “Conclusions” sections.
The improved GBVS model
The main difference between the GBVS model and the NVT model is the use of the Markov chain instead of the center-surround process. The flow of the Markov chain can ultimately highlight a handful of key points which differ from their surroundings. In this section, we firstly introduce the GBVS model, and then present our improvements on the GBVS model in order to adapt the airport detection problem.
The GBVS model
According to Harel et al. (2007), the structure of the GBVS model can be generalized as four main courses: the forms of feature maps, activation maps, normalized maps and saliency map. It can be shown in details as four stages as follows:
Stage 1: Calculating the feature maps
Given an input gray-level image I with the size of m × n, filter it by the Gaussian pyramid low-pass filters. So-called pyramid means that the input image is filtered by the 2-D Gaussian low-pass filter and down-sampled by 2 alternately, which aims to get feature maps under different resolutions. Generally the number of levels of the pyramid is chosen as 3. The expression of the Gaussian filter G is shown as follow
 |
1 |
where (x, y) represents the coordinate of a pixel in I and σ1 is called the scale factor. σ1 decreases along with the down-sampling operation. As a result, a set of filtered results with different scales are obtained and defined as the intensity channel.
Similarly, the orientation channel can be acquired by the Gabor pyramid filters H, which are defined as follow
 |
2 |
Here, f is the frequency and θ is the angle parameter. Commonly, the value of θ is
 |
which means that a group of Gabor pyramid filters with four orientations are used.
For each map in both intensity and orientation channel, it will be resized to proper size, for example, 40 × 40 pixels, and then regarded as a feature map. This operation intends to reduce the computational time of Markov chain and avoid the memory overflow in next stage. Some other channels such as contrast and motion may be calculated if necessary.
Stage 2: Obtaining the activation maps
For each feature map, compute the corresponding activation map via the build of the Markov chain. Define a feature map as M with the size of n × n, then the dissimilarity of any two pixels M(i, j) and M(p, q) in M is defined as
 |
3 |
From (3), it is obvious that
 |
Consequently, a fully-connected directed graph can be constructed on M. The nodes of the graph are represented by the coordinates of pixels in M, and the weight w1 of the edge from node (i, j) to node (p, q) is obtained by following formula
 |
4 |
where σ3 is the Gaussian smooth parameter. Now a Markov chain can be created on this graph. The states and transition probabilities of the chain are respectively equivalent to the node values and normalized edge weights of the graph. The equilibrium distribution of the chain is computed through iteration as
 |
5 |
where W is the corresponding Markov matrix with the size of n2 × n2 and x0 is a random nonzero vector. This iteration converges to a multiple of the eigenvector with the largest eigenvalue of W (Health 2002), which is regarded as the activation map A, after realignment.
Stage 3: The normalization process
The normalization stage aims to highlight the pixels with high activation. It computes another Markov chain on the activation map. The solution of this stage is the same as previous one except the definition of the edge weight w2 as
 |
6 |
where A(p, q) represents the pixel value in the activation map and σ4 is also the Gaussian smooth parameter.
Stage 4: Getting the saliency map
Sum the normalization maps together in each channel and compute the average. After that, combine all the channels into the final saliency map, normalize it if necessary.
Improvements on the GBVS model
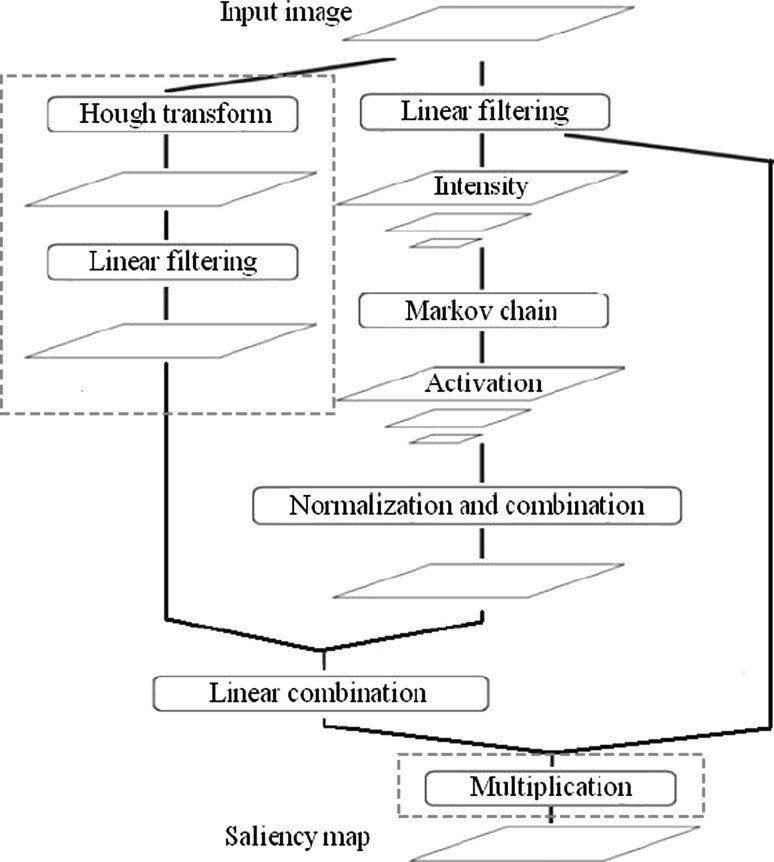
As mentioned in the Introduction section, our focus is the runways of airports. In the original GBVS model, the straight lines of runways are mainly caught by the orientation channel. However, the number of orientation filters is limited. If the direction of runways does not match well with the one of the Gabor filters, the detection will be imprecise. What is more, the increase of the number of filters will bring additional costs, which makes the algorithm slower apparently. Here, we use the result of Hough transform instead of the orientation channel in GBVS model. Hough transform is an effective way to detect straight lines in images. It is fast and applicable for straight lines with different direction. To be more specific, the lines detected by Hough transform are marked with ‘1’ and others with ‘0’, and then make it smooth by the Gaussian filters. Eventually the saliency map is a weighted sum of the Hough result and the intensity channel.
In addition, the material of the surface of runways is concrete or bitumen. Among them, concrete is usually necessary because of the high carrying capacity, especially for large airports. In most remote sensing images, like the images obtained from IKONOS, Landsat platforms and so on, concrete is brighter due to the high reflectivity. According to that, in order to exclude the interference from darker objects such as rivers and gorges, the saliency map is multiplied with the filtered original image. By doing so, the salient objects but with low brightness will be weakened.
The structure of the improved GBVS model is shown in Fig. 1. The parts in the frames drawn in red dashed in Fig. 1 are our improvements.
Fig. 1.
The improved GBVS model
The proposed algorithm
In this part we will describe the steps of the proposed method on airport detection. Before that, we give a brief introduction on the SIFT features and the HDR tree which are used to recognize airports. The former is used to extract descriptors on ROIs and the latter is a classifier for the descriptors. The classification results take effect on the locations of airports.
How to describe the characteristic of a region is a key problem for pattern recognition. Common ways are mostly based on statistics, including mean, variance and higher-order moments and so on. Mean and variance are lack of uniqueness in spite of high computation speed. On the other hand, moments with lower order are sensitive to affine transformation, but ones with higher order have high complexity which does not suit for rapid detection. To avoid these problems, we choose the SIFT features for airport detection, which are also used by Tao et al. (2011).
SIFT was proposed by D. G. Lowe in 2004. It finds extremes in a region and produces feature vectors according to the surroundings of the extremes. Details of SIFT was provided by Lowe (2004). It is noticeable that the applications of different scales and rotation of coordinate axis during the extraction of the SIFT features ensures invariance to affine transformation. This characteristic makes SIFT suitable for detection of airports with different size and direction. In practice, the SIFT points often fall on the corner and junction of runways, which are the key parts of airports distinguished from other objects which with lower density of distributed SIFT points. This is mainly because in images with such high resolution and large size, only airport runways appear to have sufficient traits of junctions and crossroads, while others may be too small or too vague to recognize these features.
For feature recognition, the selection of classifier is important. In Qu et al. (2005) and Tao et al. (2011), SVM is used to train statistical features and test images. Here we use the HDR tree instead. It is a kind of memory tree which simulates the memory in human vision and is provided with fast learning and searching speed. The advantage of a HDR tree compared with SVM is its structure updating mechanism. When a new training sample comes into the HDR tree, it will find the leaf node which is most similar to it and be combined with the node. However SVM must retrain all the samples and bring extra cost. Detailed information about HDR will be found in Hwang and Weng (2000).
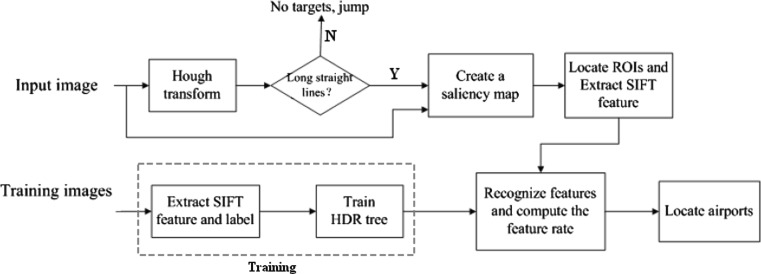
Our algorithm for airport detection can be summarized as follows: Firstly use Hough transform to simply judge whether an airport possibly occurs in the input image. If there is, then the improved GBVS model is applied to extract ROIs. After that, SIFT features are extracted on ROIs and classified by the HDR tree. At last, the location of airport is assured by the classification result and the order of saliency. Detailed steps are shown as follows.
Step 1: Training
Before testing, several images are selected to construct the training data set. Aiming at this, SIFT features are computed on each image. If a SIFT point falls on an airport area, it will be labeled with ‘1’, which means the airport class; otherwise, it will be labeled with ‘0’. All the labeled samples are taken into the HDR tree for training.
Step 2: Preprocessing
For a remote sensing image with large size, we firstly divide it into patch images with smaller size, for example, 400 × 400 pixels. Then we detect the airport targets from each patch image. Prior to computing the saliency map of an input patch image, it is necessary to judge whether the image possibly contains an airport. If a patch image does not contain determinately the airport target, it will be skipped rapidly. Therefore, some needless computational cost will be avoided by this processing. To do this, Hough transform is applied because of its high speed and efficacy of detecting straight lines. In details, the image is firstly changed into the corresponding binary map using Sobel operator because Hough transform is only suitable for black and white images. Then Hough transform acts on the binary map and the image will be discarded if it does not contain any long-enough detected straight lines. If a patch image possibly contains the airport targets, it will be further analyzed. Finally, the result of Hough transform will be also used in the improved GBVS model.
Step 3: Computing the saliency map
For images which are likely to contain airports, calculate their saliency maps by the improved GBVS model.
Step 4: Locating ROIs
Several ROIs can be pointed out from the saliency map. Denote the maximum value of the original saliency map and the current one respectively as Io and Im. Initially Io is equal to Im. Started from the brightest pixel in the map, the region is expanded to surrounding until the pixel value on the its edge is smaller than Im × α. α is a coefficient valued between 0 and 1. When the growth of the region stops, its external rectangle is treated as a ROI. After that, this ROI area is masked with ‘0’ and current Im is computed again. If Im < Io < α, all ROIs have been found, or else a second ROI should be found as before.
Step 5: Obtaining the feature rate
Extract SIFT features on each ROI and class them into ‘0’ or ‘1’ by the HDR tree. The feature rate of a ROI means the percentage of label ‘1’ in all the SIFT vectors.
Step 6: Airport recognition
Airport region is ensured by the feature rate and the saliency order of a ROI. If the feature rate of certain ROI is higher than the threshold β, it will be recognized as a airport area. Otherwise the order of the ROIs extraction is mainly considered. A ROI will be considered as an airport region if it has higher saliency order and possesses at least one SIFT vector with label ‘1’.
The flow chart of the proposed algorithm is shown in Fig. 2.
Fig. 2.
The flow chart of the proposed algorithm
Experimental results
The performances of the proposed algorithm will be tested on real remote sensing images. Our experimental data come from two sources: Google earth and CBERS-02B. Data in Google earth are combination of aerial photographs and satellite images which are mainly collected by Landsat-7. We choose 207 color Google earth images in 30 m × 30 m spatial resolution with 400 × 400 size and transform them into gray images. On the other hand, CBERS-02B provides high-resolution (HR) data in panchromatic spectrum with resolution of 2.36 m × 2.36 m. 80 CBERS images are collected in 6,000 × 6,000 size to construct another testing data set. For both data sources, a half of images for each dataset contain an airport at least and another half of images do not. The computational environment of our experiments is MatlabR2008a in such computer as Inter Core2 2.53 GHz CPU and 2G Memory.
Comparisons of different visual attention models
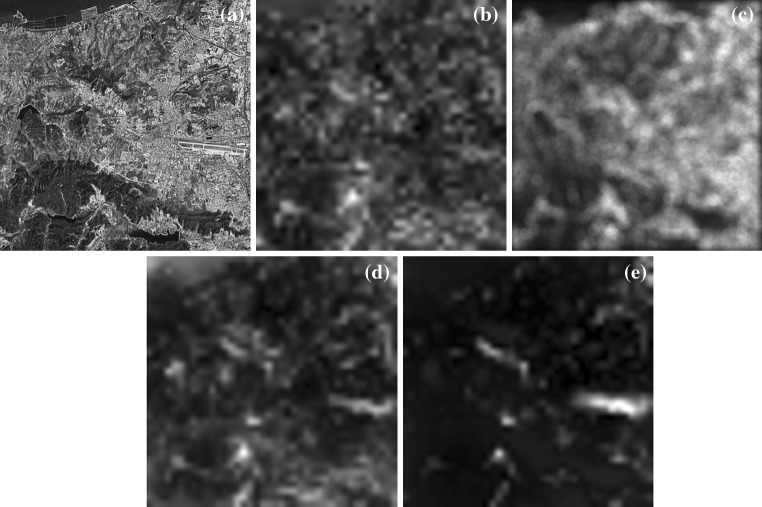
In this part, the performance of the improved GBVS model for target detection is compared with NVT, PFT and the original GBVS models. These models are all operated on the dataset which consists of 100 Google earth images and then the saliency maps can be obtained. During the experiments, NVT and the original GBVS model both use intensity and orientation channels, and the improved GBVS model uses Hough channel instead of the orientation one. Besides, to keep identical number of scales between the NVT and the GBVS model, the number of central levels in NVT is chosen as 3. An example for saliency maps obtained from different models is shown in Fig. 3.
Fig. 3.
The example for saliency maps obtained by different models. a Original image, and saliency maps obtained by b NVT, c PFT, d GBVS, and e the improved GBVS, respectively
From Fig. 3 we see that NVT and PFT cannot acquire good results under the complicated background. Their saliency maps provide nothing at the position of the airport. By contrast, both the original and improved GBVS models highlight the airport in different extent. It is obvious that the result of the improved GBVS model is better by reason of stronger contrast between the airport and other objects.
The average computational time of each model is shown in Table 1. PFT is fastest because the fast Fourier transform (FFT) is more time-saving than the scale transform. The improved GBVS model is a little slower than NVT but much faster than the original GBVS model. So the replacement of the orientation channel by the Hough channel, which is the main improvement from the original GBVS model to the improved GBVS model, brings better performance on the detection.
Table 1.
Average computational time of different models
| Model | NVT | PFT | Original GBVS | Improved GBVS |
|---|---|---|---|---|
| Time(s) | 1.58 | 0.18 | 4.90 | 2.03 |
Considering speed and effect synthetically, the improved GBVS model is more suitable for the airport detection. Besides, in order to solve the problem of time consumption, we reduced the number of scales in the model, which will speed up our algorithm a lot as well as maintain invariance of the result basically.
Results on the Google earth data
We will firstly discuss the performance of our algorithm on the Google Earth dataset. It is noticeable that the improved GBVS model in following experiments uses only two scales since airports always have special size and there is not much difference of size between them. Comparison with other methods of airport detection is also done here.
Recognition results
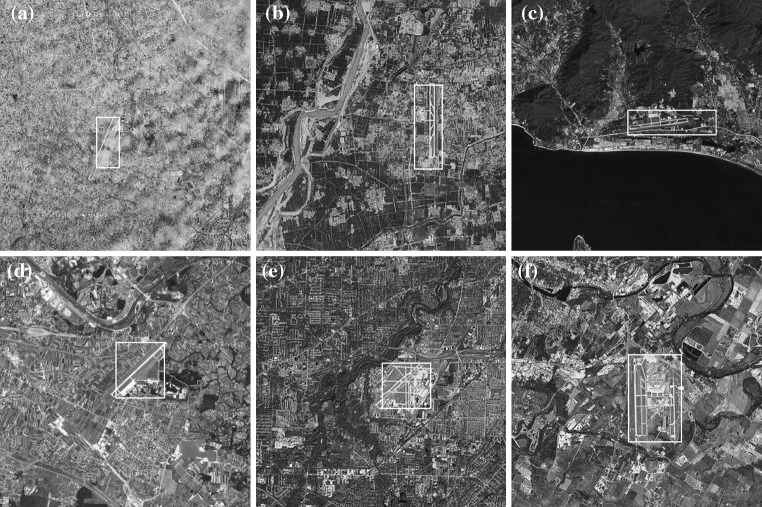
Our method is performed in 207 Google Earth images, 7 of which are selected as the training data set, while the others are used for testing. The parameters mentioned above are chosen as α = 0.35 and β = 0.1. Some of results are given in Fig. 4. This group of results shows that our method can accurately get the location of the airport in different kinds of backgrounds such as clouds, rivers, coast and mountains. For example, the airport in Fig. 4a is covered by large area of clouds, but the bright and straight runway is still detected by Hough transform, and then reflected in the saliency map. Another example is Fig. 4c, in which the coast is also bright and linear. However, lack of junctions brings dissimilarities in SIFT features from runways. So the airport can be detected none the less.
Fig. 4.
Some recognition results on Google earth dataset: a Chengdu, China; b Jinan, China; c Sanya, China; d Zagreb, Croatia; e Cleveland, USA; f Austin, USA
Furthermore, several failure cases are given in Fig. 5. In Fig. 5a, parts of the runways are dark so that Hough transform cannot find out them. The wide and straight road makes our detection disturbed in Fig. 5b. In addition, Fig. 5c contains no airports but we mistake the crossed roads for runways. Accordingly, these objects which have similar features with airports may bring troubles in our detection in spite of training.
Fig. 5.

Several failure examples: a Santiago, Chile; b Houston, USA; c Changsha, China
Comparison with other methods
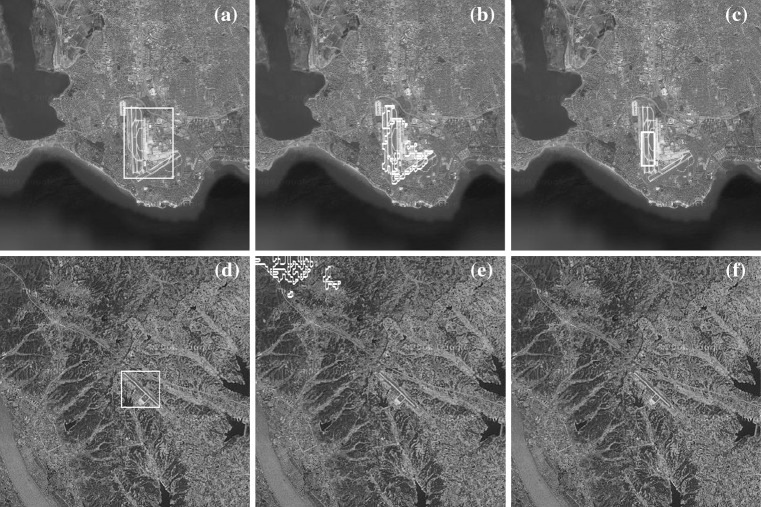
Here, we compare the proposed method with other existing methods, such as the method proposed by Qu et al. (2005) and the method proposed by Tao et al. (2011). The parameters mentioned by Tao et al. (2011) are adjusted to optimum and selected as R = 80, S = 3, where R means the radius of the SIFT cluster and S is the minimum number of keypoints in one cluster. 30 images are chosen as training set for Qu et al. (2005) and Tao et al. (2011) to obtain best results. Two groups of results are listed in Fig. 6. The first row of Fig. 6 is an example which is correctly recognized by all three methods, whereas in the second row only our method achieves the correct result.
Fig. 6.
Examples for comparison: Istanbul, Turkey (in the first row) and Yichang, China (in the second row). The detected results obtained by a, d our method, b, e the method in Tao et al. (2011), c, f the method in Qu et al. (2005), respectively
Now we run the three algorithms on all the images. Performance of each method is judged by recognition rate, false alarm rate and average time consumption. The false alarm rate F is defined by
 |
6 |
where m indicates the total number of images which do not contain airports, and y means among all m images, the number of the images in which we can still detect something. The analytical result is shown in Table 2.
Table 2.
Performance comparison for the three methods on Google Earth dataset
From Table 2, it is obvious that our method outperforms the other two. The reason why our algorithm outperforms the one in Tao et al. (2011) can be considered as below: First, the method proposed in Tao et al. (2011) uses the density of SIFT points to ensure ROIs, but sometimes there are not enough SIFT points on the airport. On the contrary, the extraction of ROIs in our algorithm is based on visual attention but not the SIFT points. Second, it is difficult to find a fixed value of the parameters R and S in Tao et al. (2011) which are suitable for different size of airports, while our method is competent for dissimilar airports thanks to the application of scale-space. Third, the process of segmentation in Tao et al. (2011) is time consuming as it is computed pixel by pixel. However our improved GBVS model runs fast. The last but not the least is that the texture feature used for recognition in Tao et al. (2011) is not robust to affine transformation, especially for the lower order of Zernike moment (Khotanzad and Hong 1990). By contraries, SIFT features used in our method avoid this.
In Qu et al. (2005), besides the mutual deficiencies in all edge detection-based methods, another problem is that this algorithm is hard to detect inclined airports which are not vertical and horizontal to the coordinate axes. This is because it screens bright points only in four neighborhoods when removing short curves. So it can only acquire better performance on condition that the airport has been rotated to vertical in advance.
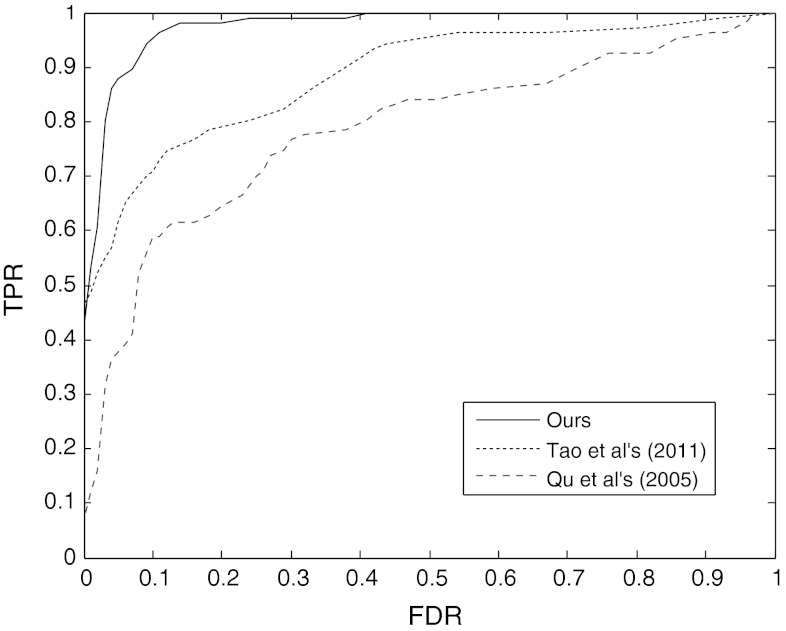
Receiver operating characteristic (ROC) curve (Bruce and Tsotsos 2009) is usually used to evaluate the effectiveness of detection. This curve pays attention to the judgment of the existence of a target not the location of it. The x-axis of the curve is the false positive rate (FPR) and the y-axis is the true positive rate (TPR). The larger the area under the ROC curve is, the better the effectiveness is. The ROC curve of each method is plot in Fig. 7. It can be seen that our method has the largest ROC area comparing to Tao et al. (2011) and Qu et al. (2005), TPR of which reaches 90 % while FPR is only 10 %. The method proposed in Tao et al. (2011) has lower FPR than the method proposed in Qu et al. (2005) since usually the density of SIFT features which belong to the airport class is low in images which contain no airports. It will result in finding no ROIs on this occasion.
Fig. 7.
The ROC curves of three methods
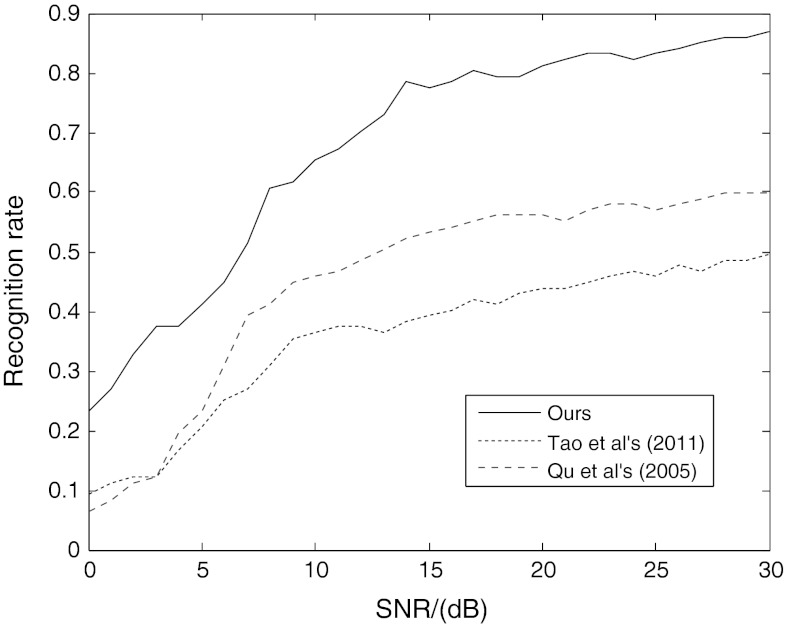
Additive noise is unavoidable in remote sensing images. So we test the performance of methods under noisy data. In details, white Gaussian noises with 0–30 dB SNR are respectively added on the original images. By calculating the recognition rate under different levels of noise, a curve is gained and showed in Fig. 8. From Fig. 8, we can see that our method scores best and reaches above 80 % after 20 dB noise. The method in Qu et al. (2005) is better than the method in Tao et al. (2011) in this aspect because when SNR is not too low, the influence of noise is unapparent on the detection of long straight lines.
Fig. 8.
The recognition rates under different noise levels
Parameter selection
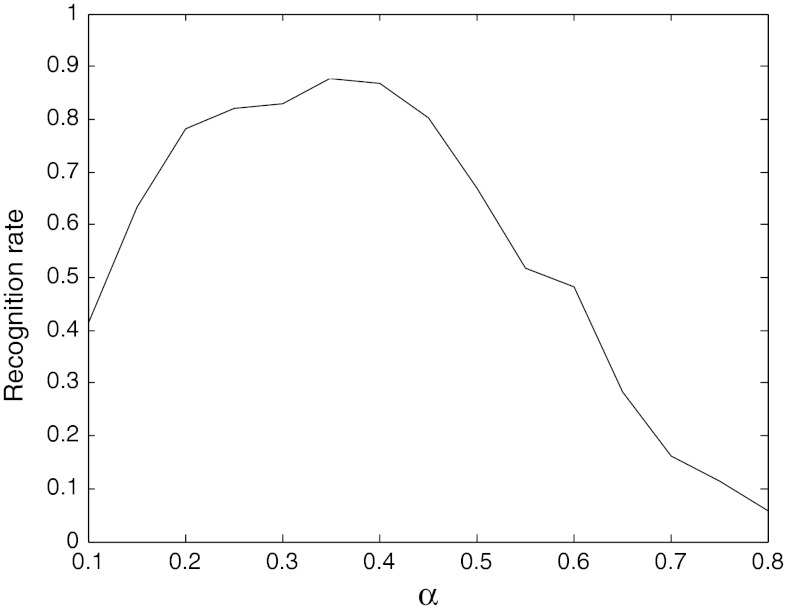
There are mainly two parameters in our algorithm: α and β. α influences on the number and the size of ROIs. We select α from 0.1 to 0.8, stepped by 0.05, and β = 0.1. The recognition rates under different values of α are given in Fig. 9.
Fig. 9.
Recognition rates change along with different parameter α
Favorable results can be obtained when α is between 0.3 and 0.4 according to Fig. 9. When α is lesser, the number of ROIs increases which brings more difficulties to recognition. On the other hand, the area of each ROI will be larger and consequently does not match well with the full size of the airport. By contraries, larger α will result in the exclusion of airport regions which are not salient enough. Further, smaller area of an ROI may be not also suitable for the actual size of the airport.
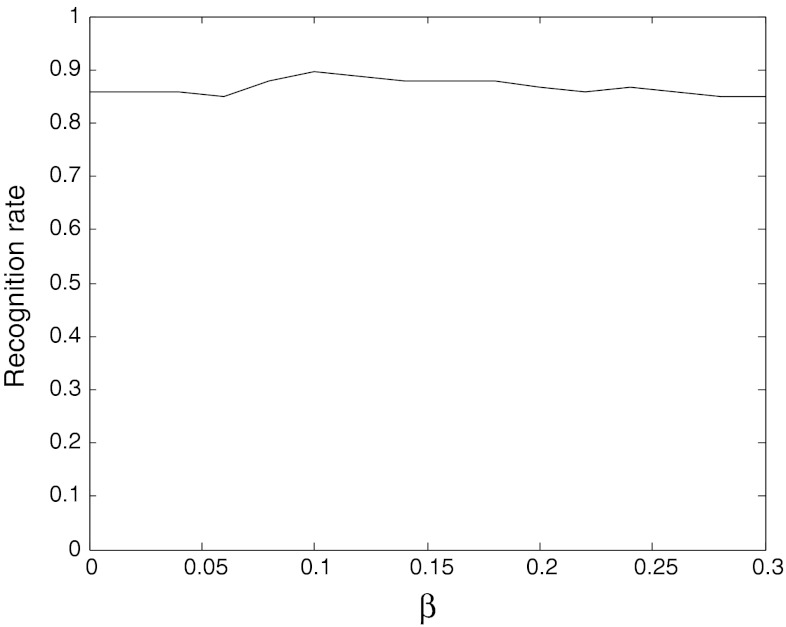
The application of β aims at picking out the airport area which is not the most salient ROI. α is fixed at 0.35, and let β change between 0 and 0.3. Then another curve about recognition rates under different β is acquired as Fig. 10.
Fig. 10.
Recognition rates under different values of β
As shown in Fig. 10, there are few differences in recognition rate between dissimilar values of β. This means that airport is always the most salient area in our saliency map, so the airport region can be extracted accurately without considering the feature rate. A peak value is obtained when β = 0.1, which indicates that the high feature rate of the airport area helps us pick out it successfully under the interference caused by other more salient objects.
Results on the CBERS data
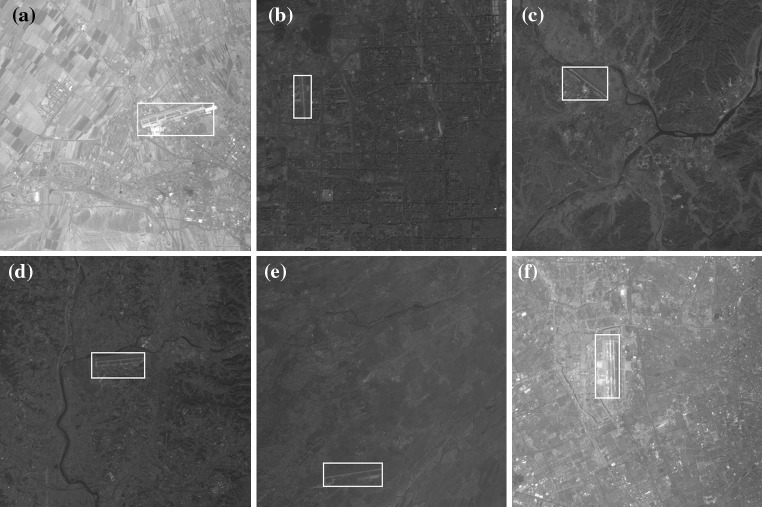
Besides Google earth dataset, we also test our algorithm on CBERS dataset. For comparison, we down-sample the 80 images from the size 6,000 × 6,000 to 400 × 400 and make it be provided with the same width as Google’s. 6 of all the 80 images are selected for training and others are used to test. The parameters are selected as α = 0.35, β = 0.10, which are same as the Google earth dataset. Some results are shown in Fig. 11.
Fig. 11.
Some recognition results on CBERS: a Wulumuqi, China; b Beijing, China; c Huangshan, China; d Shanghai, China; e Inchon, Korea; f Toshkent, Uzbekistan
Compared with the data of Google Earth, CBERS images have lower contrast and airports in them are darker. The backgrounds are also simpler. However the airports are still salient than other objects and they can be located with the aid of Hough transform. Some failure examples are listed in Fig. 12.
Fig. 12.

Failure recognition results on CBERS. a Lasa, China; b Kunming, China; c Shijiazhuang, China
Methods in Qu et al. (2005) and Tao et al. (2011) are also applied to CBERS data. Similar to Table 2, a comparison result is given in Table 3. The parameters of Tao et al. (2011) are set as R = 80 and S = 2 because there are less SIFT points can be extracted on the lower contrast images.
Table 3.
Performance comparison for the three methods on CBERS data
Table 3 indicates that the performance of our algorithm is not as good as Table 1, especially for the false alarm rate. This is caused by a balance between the recognition rate and the false alarm rate. Since darker airports which are not salient occupy larger proportion in these dataset, to keep a comparable high recognize rate, we must sacrifice the false alarm rate to some extent. The effect of the method in Tao et al. (2011) is better than before as the results of segmentation and textural features recognition are more ideal under simplex background. However, its speed is still limited by segmentation process.
Discussions
In this paper, mainly based on the low computational time and the fact that airports are salient in remote sensing images, we introduced the visual attention mechanism into airport detection problem. This was never done by previous works because most visual attention models cannot receive preferable results on complicated backgrounds.
Further, we find that the GBVS model can be used for target detection in complicated backgrounds because of the application of Markov process, which can highlight dissimilar pixels more apparently. In order to adapt the airport detection problem, we improved the original GBVS model so as to obtain faster computational speed and better detection effect.
As has been described in Introduction section, the main processes of visual attention mechanism can be divided into two stages: bottom-up and top-down. The original GBVS model describes the bottom-up stage, which does not relate to prior knowledge. For the purpose of improving the airport detection, we bring the knowledge that runways consist of bright and special long straight lines into the GBVS model by using the Hough transform result instead of the orientation channel. This improvement plays the role of the top-down stage and highlights the characteristics of runways better. Besides, it speeds up the creation of saliency map because the process of Hough transform is much faster than the one of the Gabor scale filters.
In addition, in the preprocessing stage, we skip over the images which contain no airports by use of Hough transform. By this way, unnecessary time consumption is avoided as well as the false alarm rate is lower. If an image with large size is inputted for detection, it will be first divided into small parts and then detected one by one. By skipping the images with no airports, we can further greatly accelerate the processing of the remote sensing images with the large size.
Another issue is that there might be interferences by wide highways due to their similarity with airport runways. While in most cases, however, runways contain more junctions and crossroads than highways do. As a result, the SIFT feature points are much more likely to appear on the junctions and corners at the area of runways rather than straight wide highways. What’s more, by limiting the length of straight lines, it may largely diminish the disturbance of highways and accordingly achieve a lower false alarm rate.
Finally, the experimental results show that our method is suitable for different data sources without considering the contrast because saliency is a relative conception. However, from the difference of performances between CBERS and Google Earth data we know that airports which are not salient enough are still difficult to detect. Fortunately, airports possess higher saliency in most remote sensing images due to their large size, special shape and high reflectivity.
Conclusions
In this paper, visual attention mechanism has been introduced into the airport detection problem and a new method for airport detection has been presented. This method gets over the shortcoming of pixel-by-pixel analysis in traditional methods and improves the efficiency of detection greatly. Hough transform is applied here to pick out the images which possibly contain airports first. Then a saliency map and the corresponding ROIs can be obtained through the improved GBVS model. Finally the airport region is determined by the SIFT features extracted from each ROI with the aid of HDR tree. Experiments on Google Earth data and CBERS-2B data both prove that the proposed method has faster speed, higher recognition rate and lower false alarm rate than the previous works, and is robust to noise at the same time. It should be very useful in real-time target detection under complicated background. Further research will mainly focus on the detection on dark airports
Acknowledgments
This work was supported in part by the National Natural Science Foundation of China (Grant No. 61071134) and the Research Fund for Doctoral Program of Higher Education of China (Grant No. 20110071110018).
References
- Bian P, Zhang L. Visual saliency: a biologically plausible contourlet-like frequency domain approach. Cogn Neurodyn. 2010;4(3):189–198. doi: 10.1007/s11571-010-9122-0. [DOI] [PMC free article] [PubMed] [Google Scholar]
- Bruce ND, Tsotsos JK (2005) Saliency based on information maximization. In: Proceedings of NIPS
- Bruce ND, Tsotsos JK. Saliency, attention, and visual search: an information theoretic approach. J Vis. 2009;9(3):1–24. doi: 10.1167/9.3.5. [DOI] [PubMed] [Google Scholar]
- Crick F, Koch C (1998) Consciousness and neuroscience. Cereb Cortex 8:97–107 [DOI] [PubMed]
- Crick F, Koch C (2003) A framework for consciousness. Nature Neurosci 119–126 [DOI] [PubMed]
- Crick F, Koch C, Kreiman G, Fried I. Consciousness and neurosurgery. Neurosurgery. 2004;55:273–282. doi: 10.1227/01.NEU.0000129279.26534.76. [DOI] [PubMed] [Google Scholar]
- Desimone R, Duncan J. Neural mechanisms of selective visual attention. Annu Rev Neurosci. 1995;18:193–222. doi: 10.1146/annurev.ne.18.030195.001205. [DOI] [PubMed] [Google Scholar]
- Ding Z, Wang B, Zhang L. An approach for visual attention based on biquaternion and its application for ship detection in multispectral imagery. Neurocomputing. 2011;76(1):9–17. doi: 10.1016/j.neucom.2011.05.027. [DOI] [Google Scholar]
- Duda RO, Hart PE. Use of the Hough transformation to detect lines and curves in pictures. Commun ACM. 1972;15(1):11–15. doi: 10.1145/361237.361242. [DOI] [Google Scholar]
- Gao D, Mahadevan V, Vasconcelos N (2007) The discriminant center-surround hypothesis for bottom-up saliency. In Proceedings of NIPS [DOI] [PubMed]
- Gu Y, Liljenstrom H. A neural network model of attention modulated neurodynamics. Cogn Neurodyn. 2007;1(4):275–285. doi: 10.1007/s11571-007-9028-7. [DOI] [PMC free article] [PubMed] [Google Scholar]
- Guo C, Ma Q, Zhang L (2008) Spatio-temporal saliency detection using phase spectrum of quaternion fourier transform. In: Proceedings of IEEE conference on computer vision and pattern recognition, pp 1–8
- Haab L, Trenado C, Mariam M, Strauss DJ. Neurofunctional model of large-scale correlates of selective attention governed by stimulus-novelty. Cogn Neurodyn. 2011;5(1):103–111. doi: 10.1007/s11571-010-9150-9. [DOI] [PMC free article] [PubMed] [Google Scholar]
- Harel J, Koch C, Perona P (2007) Graph-based visual saliency. In: Proceedings of advances in neural information processing systems, pp 545–552
- Health MT. Scientific computing: an introduction survey. New York: McGraw-Hill Press; 2002. [Google Scholar]
- Hou X, Zhang L (2007) Saliency detection: a spectral residual approach. In: Proceedings of IEEE conference on computer vision and pattern recognition, pp 1–8
- Hwang WS, Weng JY. Hierarchical discriminant regression. IEEE Trans Pattern Anal Mach Intell. 2000;22(11):1277–1293. doi: 10.1109/34.888712. [DOI] [Google Scholar]
- Itti L (2000) Models of bottom-up and top-down visual attention. PhD dissertation, California Inst. Chnol., Pasadena
- Itti L, Baldi P (2005) A principled approach to detecting surprising events in video. In: Proceedings of CVPR, pp 631–637
- Itti L, Koch C. A saliency-based search mechanism for overt and covert shifts of visual attention. Vis Res. 2000;40:1489–1506. doi: 10.1016/S0042-6989(99)00163-7. [DOI] [PubMed] [Google Scholar]
- Itti L, Koch C, Niebur E. A model of saliency-based visual attention for rapid scene analysis. IEEE Trans Pattern Anal Mach Intell. 1998;20(11):1254–1259. doi: 10.1109/34.730558. [DOI] [Google Scholar]
- Khotanzad A, Hong YH. Invariant image recognition by Zernike moments. IEEE Trans Pattern Anal Mach Intell. 1990;12(5):489–497. doi: 10.1109/34.55109. [DOI] [Google Scholar]
- Liu D, He L, Carin L (2004) Airport detection in large aerial optical imagery. In: Proceedings of IEEE international conference on acoutics, speech and signal processing, vol 5, pp 17–21
- Lowe DG. Distinctive image features from scale-invariant keypoints. Int J Comput Vis. 2004;60(2):91–110. doi: 10.1023/B:VISI.0000029664.99615.94. [DOI] [Google Scholar]
- Pi Y, Fan L, Yang X (2003) Airport detection and runway recognition in SAR images. In: Proceedings of IEEE international geoscience and remote sensing symposium, pp 4007–4009
- Qu Y, Li C, Zheng N (2005) Airport detection based on support vector machine from a single image. In: Proceedings of fifth international conference on information, communications and signal processing, pp 546–549
- Second J, Zakhor A. Tree detection in urban regions using aerial lidar and image data. IEEE Geosci. Remote Sens Lett. 2007;4(2):196–200. doi: 10.1109/LGRS.2006.888107. [DOI] [Google Scholar]
- Tao C, Tan Y, Cai H, Tian J. Airport detection from large IKONOS images using clustered SIFT keypoints and region information. IEEE Geosci Remote Sens Lett. 2011;8(1):128–132. doi: 10.1109/LGRS.2010.2051792. [DOI] [Google Scholar]
- Treisman A, Gelade G. A feature-integration theory of attention. Cogn Psychol. 1980;12(1):97–136. doi: 10.1016/0010-0285(80)90005-5. [DOI] [PubMed] [Google Scholar]
- Walther D, Koch C. Modeling attention to salient proto-objects. Neural Netw. 2006;19(9):1395–1407. doi: 10.1016/j.neunet.2006.10.001. [DOI] [PubMed] [Google Scholar]
- Walther D, Itti L, Riesenhuber M, Poggio T, Koch C. Attentional selection for object recognition—a gentle way. Lect Notes Comput Sci. 2002;2525(1):472–479. doi: 10.1007/3-540-36181-2_47. [DOI] [Google Scholar]
- Wang W, Li L, Hu C, Jiang Y, Kuang G (2011) Airport detection in SAR image based on perceptual organization. In: Proceedings of M2RSM, pp 1–5
- Yu Y, Wang B, Zhang L. Bottom–up attention: pulsed PCA transform and pulsed cosine transform. Cogn Neurodyn. 2011;5(4):321–332. doi: 10.1007/s11571-011-9155-z. [DOI] [PMC free article] [PubMed] [Google Scholar]


