

Abstract
Norovirus protease is an essential enzyme for proteolytic maturation of norovirus nonstructural proteins and has been implicated as a potential target for antiviral drug development. Although X-ray structural studies of the protease give us wealth of structural information including interactions of the protease with its substrate and dimeric overall structure, the role of protein dynamics in the substrate recognition and the biological relevance of the protease dimer remain unclear. Here we determined the solution NMR structure of the 3C-like protease from Norwalk virus (NV 3CLpro), a prototype strain of norovirus, and analyzed its backbone dynamics and hydrodynamic behavior in solution. 15N spin relaxation and analytical ultracentrifugation analyses demonstrate that NV 3CLpro is predominantly a monomer in solution. Solution structure of NV 3CLpro shows significant structural variation in C-terminal domain compared with crystal structures and among lower energy structure ensembles. Also, 15N spin relaxation and Carr–Purcell–Meiboom–Gill (CPMG)-based relaxation dispersion analyses reveal the dynamic properties of residues in the C-terminal domain over a wide range of timescales. In particular, the long loop spanning residues T123–G133 show fast motion (ps-ns), and the residues in the bII–cII region forming the large hydrophobic pocket (S2 site) undergo conformational exchanges on slower timescales (μs–ms), suggesting their important role in substrate recognition.
Keywords: norovirus, viral protease, protein dynamics, NMR spectroscopy, relaxation dispersion, analytical ultracentrifugation
Introduction
Norovirus protease plays a pivotal role in norovirus infection, a major cause of acute gastroenteritis outbreaks,1–2 through the proteolytic cleavage of viral polyprotein (∼200 kDa) into six nonstructural proteins in their mature or intermediate forms (Supporting Information Fig. S1).3–7 Norovirus protease, therefore, has been highlighted as a potential target for antiviral drug development. The protease was also reported to mediate the cleavage of poly(A)-binding protein, leading to translation inhibition in the viral-infected cells.8
Norovirus protease is a member of the viral cysteine protease family that possesses a chymotrypsin-like fold. The protease has a cysteine residue that acts as a nucleophile instead of a serine residue in chymotrypsin.9 The structures of Norwalk virus 3C-like protease (NV 3CLpro),10, 11 Chiba virus 3C-like protease (CV 3CLpro),12 and Southampton virus 3C-like protease (SV 3CLpro) with a Michael acceptor peptidyl inhibitor13 has been determined as a dimeric form using X-ray crystallography. These viruses belong to the genotype I strain; proteases from this strain show nearly identical sequence homology (Supporting Information Fig. S1). The overall fold of the protease is built by N-terminal antiparallel β-sheet domain and C-terminal β-barrel domain. Catalytic residues C139, H30, and E54 along with an oxyanion hole are situated within a deep cleft between N- and C-terminal domains. The C-terminal domain is predominantly involved in the interaction with the substrate, in which the binding occurs in the manner of antiparallel β-sheet via hydrogen bond network between the substrate P5-P2 and protease K162-A158 residues.12, 13 The enzyme's S1 pocket encompasses T134 and H157, which directly interact with the substrate P1 Gln (or Glu) residue. These two residues are conserved in all norovirus proteases (Supporting Information Fig. S1) and have been shown to be critical to proteolytic activity.14, 15 The S2 site forms a large hydrophobic pocket consisting of I109, R112, and V114 and accommodates bulky hydrophobic P2 (Leu or Phe) residues found in the cleavage site in viral polyprotein (Supporting Information Fig. S1).
Crystallographic studies also have shed light on the possible role of protein conformational dynamics in the substrate recognition.10–13 Catalytically important residues, C139 and T134, are positioned near the base of the highly disordered loop (L121−G140). This loop possibly contributes to the substrate interaction at the S′ site13 and has no visible electron densities in the NV 3CLpro crystal structure.10 Protease–substrate interactions were shown to be sensitive to the mutation of this region and substrate P2 residue. Mutation of P2 residue to more hydrophobic residue caused tighter binding, and the mutation of I109 to alanine resulted in a rapid release of the substrate.16 Despite the highly conserved amino acid sequence, the loop containing S2 site (bII−cII β-sheet region) of the norovirus protease crystal structures in the presence and absence of a substrate-based inhibitor showed a significant structural difference,10–13 suggesting that the movement of the loop containing S2 site is possibly involved in the substrate entry and the product release. These dynamic properties, however, remain poorly characterized to date.
Dimer formation of the protease also was reported in crystallographic studies of NV 3CLpro10, 11 and SV 3CLpro.13 However, whether these proteases behave as dimers in solution remains unclear because the dimer interfaces observed in the crystallographic studies are quite different from each other despite their nearly identical amino acid sequences (Supporting Information Fig. S1).
In this study, we focus on the structural dynamics of NV 3CLpro to better understand its substrate recognition and catalytic function. Backbone 15N spin relaxation and CPMG relaxation dispersion analyses reveal the highly dynamic properties of C-terminal domain. The long disordered loop between cII and dII shows fast motion on pico- to nanosecond timescales, and the residues located in the bII−cII region undergo conformational exchange on slower timescales. Furthermore, we demonstrate from 15N spin relaxation and analytical ultracentrifugation analyses that NV 3CLpro is predominantly a monomer under the solution conditions analyzed here.
Results and Discussion
Solution structure determination of NV 3CLpro
We previously established complete backbone and side-chain chemical shift assignments and the chemical shift-based secondary structure prediction of NV 3CLpro under the same solution conditions used in this study.17 To solve the solution NMR structure, we analyzed 13C- and 15N-edited NOESY spectra that resulted in a total of 2135 nonredundant, inter-residue NOE restraints. A total of 198 backbone dihedral angle restraints were obtained by backbone chemical shift analysis and 82 hydrogen bond restraints were assigned by analyzing the 1H-15N HSQC spectrum of 15N-labeled NV 3CLpro measured in 99% D2O (Supporting Information Fig. S2). On the basis of these distance and dihedral angle constraints, the structural ensemble of NV 3CLpro was calculated using a simulated annealing procedure. Final structure calculation generated 100 structures, and we selected the 20 lowest energy structures for further analysis. The statistics of the final structural ensemble are given in Table I; we observed neither NOE distance violation greater than 5Å nor torsion angle violation greater than 5°, and 97.8% of the residues were found in the energetically most-favored and additionally allowed regions in a Ramachandran plot indicating good stereo-chemical quality of the calculated structures.
Table I.
Statistics for the final 20 solution structures of NV 3CLpro
| Number of constraints | |
| Total NOE distance constraints | 2650 |
| Intra-residue | 515 |
| Inter-residue | 2135 |
| Sequential (|i—j| = 1) | 981 |
| Medium range (1 < |i—j| < 5) | 329 |
| Long range (|i—j| ≥ 5) | 825 |
| Backbone dihedral angle constraints | 198 |
| ϕ | 98 |
| Ψ | 100 |
| Hydrogen bond restraints | 82 |
| Number of violations | |
| Distance constraints (>0.5Å) | 0 |
| Dihedral angle constraints (>5°) | 0 |
| Ramachandran plot for the 20 lower energy structures | |
| Residues in most favored region (%) | 70.1 |
| Residues in additionally allowed region (%) | 27.7 |
| Residues in generously allowed region (%) | 1.9 |
| Residues in disallowed region (%) | 0.3 |
| RMSD to mean structure | |
| Backbone | 1.5 |
| Heavy atom | 2.05 |
| RMSD for structured region (1–173) without His tags and C-terminal flexible regions | |
| Backbone | 0.84 |
| Heavy atom | 1.14 |
The overall fold of NV 3CLpro solution structures agrees well with that of the crystal structures,10–13 and consists of an incomplete β-barrel N-domain and an antiparallel β-barrel C-domain with active site residues (H30, E54, C139) at the cleft between two domains [Fig. 1(A)]. The backbone RMSD between the crystal structure (2FYQ)10 and our solution structure (2LNC) is 1.99Å [Supporting Information Fig. S3(A,B)], which is comparable to the RMSD value observed in systematic comparison of crystal and NMR structures ranging from 1.5Å to 2.5Å.18 A notable difference is an additional short β-strand structure (V72-E74) observed in the linker region connecting the N- and C-domains of the NV 3CLpro solution structure [Fig. 1(A)], which is consistent with our published chemical shift-based secondary structure prediction.17 The presence of the cross peak for backbone amide of E74 in the 1H-15N HSQC spectrum of NV 3CLpro in 99% D2O indicates the backbone amide hydrogen atom of E74 is protected by hydrogen bond formation (Supporting Information Fig. S2). Moreover, the proximity of the amide group of E74 to the carboxyl oxygen of V153 within β-strand eII corroborates the hydrogen bond formation in the very short β-strand. Because E74 is positioned within a 20 residue-long loop (eI–aII loop) connecting N-terminal and C-terminal domains, the observed hydrogen bond formation possibly contributes to the structural integrity of NV 3CLpro by stabilizing the eI−aII loop.
Figure 1.
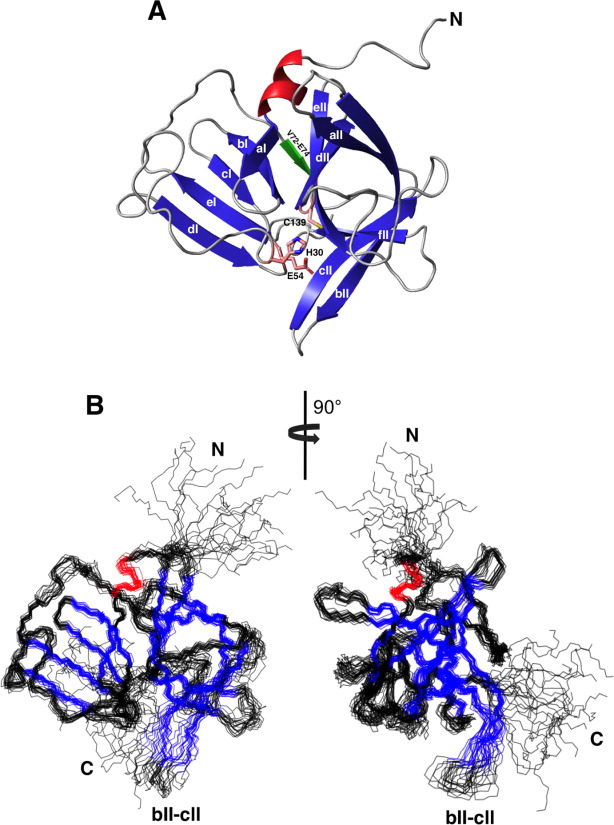
Solution structure of NV 3CLpro (2LNC). (A) Ribbon representation of the lowest energy structure with catalytic residues (H30, E54, C139) shown as sticks. Secondary structure elements are labeled. Very short strand (V72-E74) is shown in green color. (B) Backbone overlays of the 20 lowest energy structures ensemble. α-helix is colored in red and β-strand in blue. A large structural variation was observed in bII–cII β-sheet region as well as N- and C-terminal segments.
Figure 1(B) shows the superposition of backbone atoms of the 20 lowest energy conformers for NV 3CLpro over residues 1−173. The backbone and heavy atom RMSD of these conformers excluding N- and C-terminal flexible regions are 0.84Å and 1.14Å, respectively. Although the N-terminal domain shows well-defined structures, a substantially larger displacement is observed in the C-terminal domain, especially in bII and cII strands (residues, 106−115) and the large loop region connecting cII and dII β-strands (residues, 122−137) (Supporting Information Fig. S3). No long-range NOE except inter-strands NOE between bII and cII strands is observed for these regions, suggesting the existence of substantial motion in these regions. This result agrees well with the published structures of norovirus proteases,10–13 where the significant structural variability is found for these regions.
NV 3CLpro dynamics probed by 15N spin relaxation
Protein backbone and side-chain motions can be probed by NMR relaxation measurements, because these motions affect the rate at which an excited nucleus experiences the fluctuating magnetic filed to exchange energy and relaxes to its equilibrium state. We measured 15N-longitudinal relaxation rate (R1), 15N-transverse relaxation rate (R2), and heteronuclear nuclear Overhauser effect (heteronuclear NOE) to characterize fast time-scale dynamics of NV 3CLpro backbone. A total of 148 resonances are used in the spin relaxation analysis. Residues that are missing or show significant broadening include T4, S14, F18, I26, F39, G53, E54, G116, and S163. The pairs of L5/V24, W6/A52, F25/A158, and L73/C169 fully or partially overlapped. The N126 side-chain amide cross peak interfered with the precise intensity measurement of G76.
15N relaxation data summarized in Figure 2 reveal the highly flexible nature of NV 3CLpro. Significantly lower values of heteronuclear NOE [Fig. 2(A)] were observed for C-terminal residues and the long loop region between cII and dII spanning residues T123 to G133, indicating that these structural components exhibit extensive fast motion on sub-nanosecond timescales. The existence of the fast motion was also corroborated by a substantial decrease in R2 (∼8.24 and 14.5 s−1 for 500 and 800 MHz, respectively), an increase in R1 value (∼1.92 and 2.76 s−1 for 500 and 800 MHz, respectively), and lower R2/R1 ratios (Fig. 2). These results are also consistent with the lack of long-range NOE and the structural variation of the long loop region observed in the solution structure [Fig. 1(B)]. Structural analysis of SVpro with a peptide mimetic inhibitor suggests that the long loop of T123-D131 may form a putative binding site of a substrate P' side.13 Fast motion of the long loop region observed here likely contributes to accommodate the P' side of substrate in the protease molecule and release it after proteolytic cleavage. In addition, K162, G164, and N165 located on the loop between eII and fII strands showed lower heteronuclear NOE and higher R1 values, suggesting the fast backbone dynamics of this region.
Figure 2.
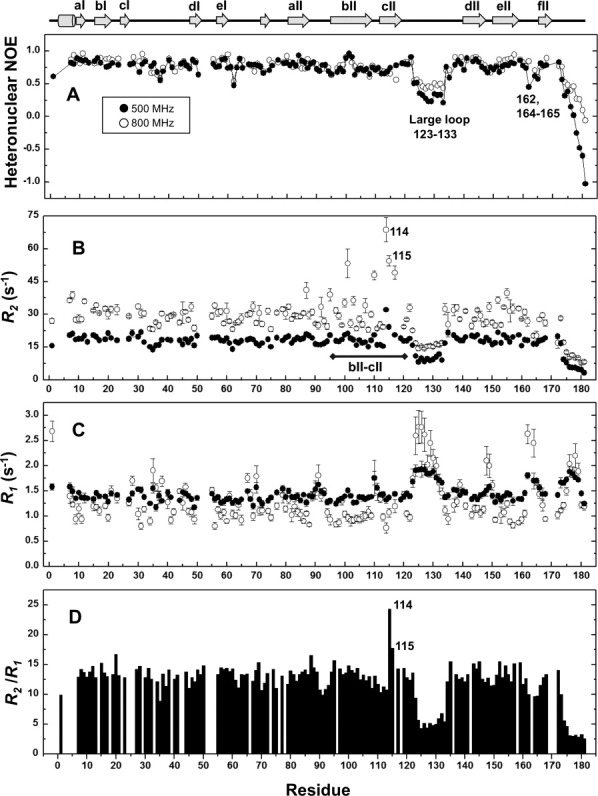
15N-spin relaxation parameters of NV 3CLpro measured at 500 MHz and 800 MHz: (A) Steady-state heteronuclear NOE, (B) R2, (C) R1, and (D) R2/R1 values. R2/R1 values were calculated for spin relaxation data obtained at 500 MHz.
Residues V114 and H115 in the bII−cII region that form a hydrophobic pocket for the recognition of P2 residue12 showed strikingly higher R2 values and higher R2/R1 ratios (Fig. 2) The heteronuclear NOE data, a sensitive probe for fast motion, showed no noticeable changes in this region compared with the rest of the protein. The relaxation behavior of the bII−cII region is most probably because of conformational exchange on the micro- to millisecond timescale.19, 20 Because exchange contributions scale quadratically with the external field strength in principal, the substantial increase in R2 values of the 800 MHz dataset observed for V114 and H115 further corroborates the conformational exchange on the μs–ms timescale in this region. This conformational dynamics of the bII−cII region may contribute to the formation of a large hydrophobic pocket that accommodate a bulky P2 side chain and thus cover a peptide portion of substrate as suggested by crystallographic studies.12, 13
The relaxation parameters, R1, R2 and hetero-nuclear NOE values, were then subjected to a Lipari−Szabo model-free analysis.21, 22 The model-free analysis was conducted with the program Modelfree.23 The amide bond length was fixed at 1.02Å, and the 15N chemical-shift anisotropy value of –160 ppm was used in the calculations. On the basis of 3D structural coordinates of NV 3CLpro and the selected set of 15N relaxation data (as described in the Experimental section), the diffusion tensor of NV 3CLpro was best described by an isotropic tumbling model. Of the 148 residues subjected to the analysis, 24 residues could not be fitted with any model (Supporting Information Fig. S4). Figure 3 shows the order parameters (S2), the internal correlation times (τe), and the chemical exchange contribution (Rex) for NV 3CLpro. Except for terminal residues, the long loop between cII and dII spanning residues 123−133 shows the largest local motional freedom. The average S2 value for this region is 0.46, which is significantly lower than the overall average S2 value of the protein, 0.86 [Fig. 3(A)]. Most residues in the loop can be best fitted to an extended model-free formalism, model 5, in which the fast internal dynamics are characterized by the squared generalized order parameter,  , and the relatively slow internal dynamics is characterized by the squared generalized order parameter,
  , and the effective correlation time τe (>500 ps) [Fig. 3(B) and Supporting Information Fig. S4].24 In general, uncertainty of τe values decreases when S2 has lower value21, 25; therefore, τe values ranging from 1.3 to 2.0 ns for this flexible loop prove the existence of extensive backbone motion on the pico- to nanosecond timescale [Fig. 3(B)]. The Rex terms characterizing motions in the micro- to millisecond time regime are plotted in Figure 3C. The Rex value is directly proportional to the difference in chemical shift values between the exchanging conformations. Significantly larger Rex values were observed for V114 and H115 positioned within the bII−cII loop, suggesting the presence of μs–ms time-scale motions.
Figure 3.
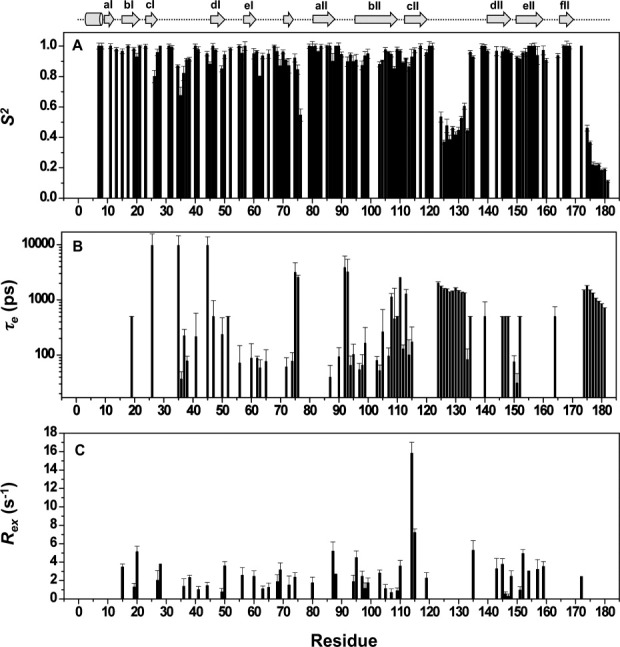
Model-free parameters. (A) S2, (B) τe, and (C) Rex of NV 3CLpro backbone amides, derived from a model-free analysis of the relaxation data at 500 MHz presented in Figure 2.
NV 3CLpro dynamics probed by 15N relaxation dispersion
For direct characterization of the μs–ms conformational dynamics, we performed the CPMG relaxation dispersion experiment on 15N-labeled NV 3CLpro at 25°C. Among the backbone amide resonances with good signal-to-noise ratios, a total of eight resonances (C83, L97, R100, V114, H115, G124, A159, and T166) show dispersion with Δ ≥ 2 s−1, where Δ
 is the difference in measured
  values at low (νcp = 40 Hz) and high (νcp = 800 or 920 Hz) CPMG frequencies. Representative relaxation dispersion curves are plotted as a function of CPMG field strength, νcp in Figures 4 and S5. Consistent with 15N-spin relaxation measurements (R1, R2, and hetero-nuclear NOE) and model-free analyses, V114 and H115 at the bII−cII loop region show considerable relaxation dispersion (Fig. 4), proving the μs–ms conformational dynamics in this region that may be involved in the formation of a large hydrophobic pocket for substrate recognition.
Figure 4.
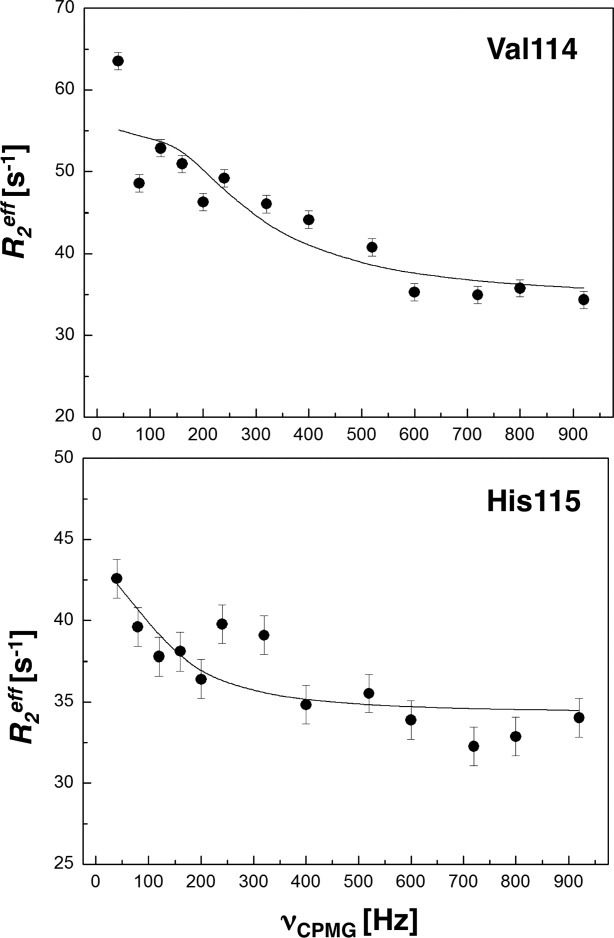
15N relaxation dispersion profiles for NV 3CLpro. Representative 15N relaxation dispersion curves for residues located at bII–cII loop region, V114 and H115. The experiments were conducted at 25°C at a static magnetic field strength of 11.7 T. Error bars were estimated by peak intensity analysis of duplicate experiments for specific νcp values.
NV 3CLpro is a monomer in solution
The oligomeric state of NV 3CLpro was evaluated by 15N relaxation and analytical ultracentrifugation experiments. As previously described, the diffusion tensor of NV 3CLpro was best fitted with an isotropic tumbling model. Analysis with an anisotropic tumbling model produced the axially symmetric model with D||/D⊥ = 1.12 (D|| = 1.28 × 10⁷ s−1, D⊥ = 1.20 × 10⁷ s−1) and the full asymmetry model with Dx = 1.19 × 10⁷ s−1, Dy = 1.20 × 10⁷ s−1, DZ = 1.28 × 10⁷ s−1, but no significant improvement was observed over the isotropic tumbling model according to an F-test. Isotropic tumbling model analysis yielded the overall correlation time, τm, of 13.02 ns, which is reasonably close to the theoretical value of NV 3CLpro monomer, 10.8 ns. We performed further sedimentation equilibrium and velocity analyses by analytical ultracentrifugation to test the monomeric state of NV 3CLpro directly (Fig. 5). First, sedimentation equilibrium of NV 3CLpro was analyzed at dilute conditions (0.015, 0.03, and 0.06 mM) and at three rotor speeds [Fig. 5(A)]. Global analysis of the data gave a reasonable fit for a monomer model with the molecular weight of 23 kDa, which was slightly higher than that of NV 3CLpro monomer, 20 kDa. Subsequent analysis of sedimentation velocity at three different concentrations of NV 3CLpro (30, 200, and 600 μM) indicated that NV 3CLpro is in a monomeric state without larger oligomeric species [Fig. 5(B)]. The selectivity curve analysis of size exclusion chromatography data also shows Mw is around 25 kDa (data not shown). We also confirmed from 1H-15N HSQC measurements of NV 3CLpro with different protein concentrations (from 0.2 to 0.8 mM) that protein concentration-dependent chemical shift changes were negligible. On the basis of these biophysical data, we conclude that NV 3CLpro is predominantly a monomer in solution without any concentration dependence. The enzymatic activity of NV 3CLpro used here was confirmed in our previous study by using two synthesized fluorogenic substrates derived from P7-P7′ and P5-P2′ residues on the NS2/3 cleavage site in ORF1 of Norwalk virus (Supporting Information Fig. S1).26
Figure 5.
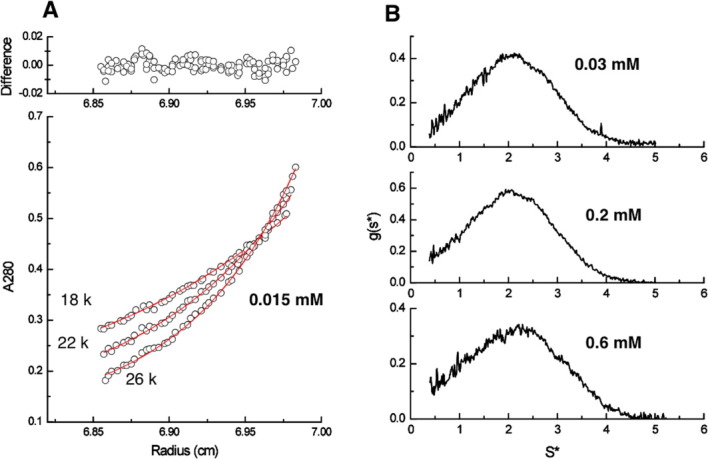
Sedimentation equilibrium profiles for NV 3CLpro and sedimentation velocity profiles for different concentrations of NV 3CLpro. Panel (A) shows selected sedimentation equilibrium profiles. The global fit (red line) is shown for sedimentation of 0.015 mM NV 3CLpro at the three higher speeds (18,000, 22,000, and 26,000 rpm). Panel (B) shows g(s*) profiles of the indicated NV 3CLpro concentrations at 49,000 rpm.
Contrary to our results, previous X-ray studies have shown that the protease forms dimer in the crystal structures.10, 11, 13 However, significantly different dimer interfaces were observed among these X-ray structures of norovirus proteases despite highly conserved amino acid sequences among norovirus proteases (Supporting Information Fig. S1).10, 11, 13 It should be noted that the same preparation of NV 3CLpro was used for X-ray crystallography11 (3UR6) and NMR studies (2LNC). It is unlikely that the biologically relevant dimer would have different interface contacts as observed in the crystal structures. Our 15N relaxation studies reveal fast timescale (ns-ps) dynamics of the long loop region (T123-G133) and slow time-scale (μs–ms) motion in the bII–cII region. From available crystal structures, these structural components are buried in the dimer interfaces.10, 13 Because the bII–cII region plays a critical role in the substrate recognition by forming an arch (large S2 hydrophobic pocket) that encompasses the P2 residue on the large viral polyprotein, the restriction of conformational dynamics because of the dimer interface formation would have had a negative impact on the substrate binding and release.
NV 3CLpro dynamical properties and functional implication
Here, we characterize NV 3CLpro solution structure and backbone dynamics using NMR spectroscopy to gain insight into NV 3CLpro dynamical properties that have not been addressed in previous crystallographic studies.10–13 Our data reveal that the C-terminal domain of NV 3CLpro is highly dynamic. The backbone amide groups with lower order parameter, S2, are mapped onto the NV 3CLpro solution structure [Fig. 6(A)]. 15N nuclear spin relaxation studies of NV 3CLpro reveal that the backbone of the long loop (T123−G133) is extensively flexible on the sub-nanosecond timescales, as indicated by lower values of heteronuclear NOE, lower R2 values (Fig. 2), and lower values of S2 [Figs. 4(A) and 6(A)]. These observations agree with the lack of electron density for this region in the crystal structure of NV 3CLpro.10 The bII–cII region, on the contrary, is characterized by motions on a slow timescale, as reflected by higher R2 values and CPMG relaxation dispersion of V114 and H115 [Figs. 2, 5, and 6(B)]. A recent Ala scanning mutagenesis study of CV 3CLpro also showed that most of the residues critical to the activity and stability of the protease reside in the C-terminal domain.14 These observations suggest that the dynamical properties of the C-terminal region presented in this study are likely important for NV 3CLpro function.
Figure 6.
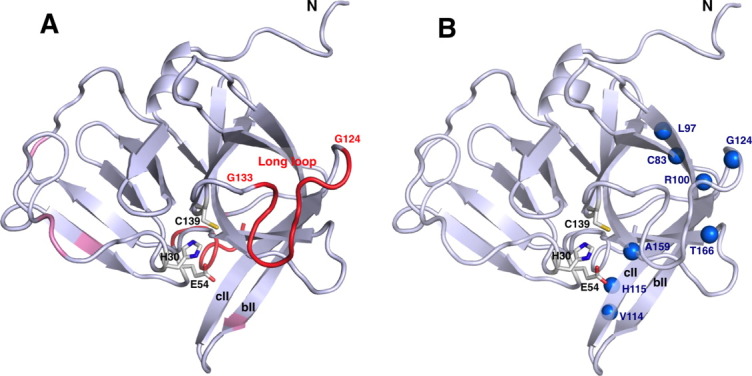
Backbone dynamics of NV 3CLpro revealed by 15N spin relaxation and relaxation dispersion experiments. (A) Residues with lower backbone amide S2 values are mapped on the solution structure of NV 3CLpro. The mean value of S2 for NV 3CLpro is 0.86 (<S2>=0.86). The standard deviation, σ, is 0.22. Ribbon color is scaled as follows: red, S2 < 0.64 (<S2>−σ), pink, 0.64 < S2 < 0.86. (B) Residues undergoing conformational exchange (Δ ≥ 2 s−1) are plotted as blue sphere. Catalytic residues, C139, H30, and E54, are also shown as sticks.
T134 and H157 are key residues for the recognition of the substrate P1 residues (Gln or Glu) in the cleavage site on the polyprotein; the side-chain of P1 Gln (or Glu) is sandwiched between T134 in the long loop and H157 in eII β-strand, and forms hydrogen bond with these two residues.13 Because the S1 site forms a relatively large pocket for the accommodation of the large P1 side chain,12, 13 the fast dynamics of the large loop (T123 to G133) adjacent to T134 with a higher degree of motional freedom (lower S2 values are shown in Fig. 3) most likely contribute to an optimized conformational contact with the large P1 side chains.
It is now widely recognized that protein dynamics on timescales of microseconds or slower play a pivotal role in biological processes such as molecular recognition, enzymatic catalysis, and allosteric regulation.27–29 Crystal structure of SV 3CLpro complexed with a peptide-mimetic inhibitor showed that the inhibitor interacts with bII–cII β-sheet region and the hydrophobic pocket formed by I109, Q110, R112, and V114 is responsible for the recognition of bulky hydrophobic P2 residues such as Leu and Phe in the norovirus polyprotein sequence (Supporting Information Fig. S1).13 These studies also suggested that, in conjunction with K162 between eII and fII β-strands, the side chain of Q110 serves as a clamp for P4 residues12, 13; therefore, the slow conformational exchange in the bII–cII β-sheet region and the fast dynamics of the loop containing K162, as revealed by 15N spin relaxation and relaxation dispersion analyses, may play a significant role in the substrate recognition and subsequent release of the cleaved products. Comparison of the dynamics between the apo- and holo-enzyme using a substrate/inhibitor, however, would be required to provide a clear understanding of the dynamical properties of NV 3CLpro associated with its wider substrate specificity and catalytic function. Because the long disordered loop and the bII–cII β-strand region are structurally connected, it will be particularly intriguing to study how these dynamics are fine-tuned in response to the substrate binding.
Understanding the structural dynamics of NV 3CLpro will be useful in elucidating the mechanism of drug resistance and lead to successful drug discovery and development. Currently, we are studying the comparative analysis of the NMR structures and X-ray structure in complex with GC376, a potent inhibitor we recently reported.11 Also, we plan to perform dynamics measurements of NV 3CLpro with the inhibitor and mutant enzymes identified during the selection of drug-resistant viruses.
Materials and Methods
Protein expression and purification
Uniformly 13C and/or 15N-labeled NV 3CLpro were expressed in Escherichia coli BL21 cells (Invitrogen) with a stretch of N-terminal six histidine tags as previously described.16 M9 growth media supplemented with 1 g/L 15NH4Cl, and 2 g/L 13C-d-glucose (Cambridge Isotope Laboratories) was used to grow the cells. Protein purification was performed with Ni-NTA affinity chromatography (QIAGEN) followed by further purification using size exclusion chromatography on a Superdex 75 (GE healthcare).
NMR spectroscopy
NMR spectra were recorded at 25°C on Varian VNMRS 500 MHz and Bruker Avance 800 MHz NMR spectrometers equipped with 5 mm triple-resonance cryogenic probes and z-axis pulse field gradients. Complete backbone and side-chain chemical shift assignments and the chemical shift-based secondary structure prediction were achieved previously.17 NOE distance restraints were obtained from 15N-NOESY-HSQC (100 ms mixing time) and 13C-NOESY-HSQC (120 ms mixing time) spectra were collected on a 0.8 mM13C/15N-NV 3CLpro prepared in 50 mM sodium phosphate buffer, pH 6.5, with 100 mM NaCl and 3 mM NaN3 in 90% H2O/10% D2O. The NOESY experiments were performed on a Bruker Avance 800 MHz spectrometer. 1H–15N HSQC spectrum was also collected on 15N-NV 3CLpro in 99% D2O to identify residues involved in hydrogen bond. All the spectra were processed with NMRpipe.30 The programs CARA31 and Sparky32 were used to analyze the datasets.
Structure calculations
A total of 2135 distance constraints (981 sequential, 329 medium range, 825 long range) were derived from the NOESY spectra. All lower limits of distance constraint were set to 1.8Å and a distance of 0.6Å was added to the upper distance bound of NOE constraint involving methyl groups. Backbone torsion angle restraints were obtained by chemical shift analysis using TALOS+ program.33 Structure calculations were performed using the simulated annealing protocol in the CNS program.34, 35 After initial structure generation, hydrogen bond restraints (dNH–O = 2.0–2.8Å, dN–O = 2.7–3.6Å) were assigned based on the proximities of donors and acceptors in the initially generated structures and resonance peaks observed in the 1H–15N HSQC spectrum of 15N-NV 3CLpro collected approximately 12 h after the solvent exchange to 99% D2O. Hydrogen bond restraints together with distance and torsion angle restraints were used for subsequent structure calculations. In the final structural calculation (4000 steps for the high-temperature annealing stage, 8000 steps for the first cooling stage using torsion angle dynamics, and 8000 steps for the second cooling stage using Cartesian dynamics), an ensemble of 100 structures was generated, and the 20 lowest energy structures were selected for further analysis. Assessment of the structural quality and calculation of coordinate RMSD were carried out using PROCHECK36 and MOLMOL,37 respectively. The statistics of NMR structure determination are summarized in Table I.
15N-relaxation experiments
15N spin relaxation measurements were carried out on 15N-NV 3CLpro using established pulse sequences.38–40 The data were collected at 25°C on both Varian VNMRS 500 MHz and Bruker Avance 800 MHz spectrometers equipped with cryogenic probes. The 1H and 15N carrier frequencies were set to the water resonance and 117 ppm, respectively. For the longitudinal relaxation rate, R1, and transverse relaxation rate, R2, measurements, NMR spectra at 500 MHz were acquired with a spectral width of 6510 Hz (13 ppm) over 1024 complex points in the 1H dimension and 1925 Hz (38 ppm) over 256 complex points in the 15N dimension with 24 transients. NMR Spectra at 800 MHz were acquired with a spectral width of 11160 Hz over 1024 complex points in the 1H dimension and 3081 Hz over 256 complex points in the 15N dimension with 28 transients. Delays of 10, 50, 100, 250, 500, 750, 1000, and 1500 ms for the 500 MHz dataset and of 10, 70, 150, 250, 400, 750, and 1250 ms for the 800 MHz were arrayed for R1 measurements. R2 values were measured using relaxation delays of 10, 30, 50, 70, 110, 150, 190, and 250 ms for the 500 MHz dataset and 20, 50, 70, 90, and 130 ms for the 800 MHz. The recycle delay between transients was set to 2.5 s for both R1 and R2 measurements. Heteronuclear steady-state NOE values were determined by the ratio of cross-peak intensities of spectra recorded in the presence and in the absence of 3 s of 1H saturation. Twenty-four and 32 transients were collected for the 500 and 800 MHz datasets, respectively. All spectra were processed using NMRPipe,30 and the program Sparky32 was used to measure peak intensities and to determine R1 and R2 values by a nonlinear least square fitting. Errors in R1 and R2 were obtained from the fits by Sparky. The uncertainty of NOE values was estimated by comparison of the replicate NOE spectra.
Relaxation data, R1, R2, and 15N–1H NOE values obtained at 500 MHz were used for model-free analysis. Initial estimation of the overall rotational diffusion tensor was performed using the program TENSOR2.41 The following criteria were used to select residues for tensor optimization; residues within the defined secondary structures were selected. Residues having very fast internal motion (lower NOE values, which is less than 0.7, and lower R2/R1 ratio) and residues experiencing conformational exchange (higher R2/R1 ratio) on μs–ms were then removed from input for TENSOR2. The resulting residues included 9–11, 16, 17, 19, 21, 47, 49, 81–84, 86, 98, 102, 104-107, 109, 140, 141, 146, 147, 150, 151, 153, 155, 156, and 166–168. The isotropic rotational correlation time, τm, was also calculated by the Stokes–Einstein–Debye relation42:
| (1) |
in which η is the viscosity of the solvent, r is the effective hydrodynamic radius of the protein, k is the Boltzmann constant, and T is the temperature. Protein hydrodynamic radius, r, was calculated as follows:
| (2) |
where ν is the specific volume of the protein (0.73 cm3/g), Mw is the molecular weight, NA is Avogadro's number, and rw is a hydration layer surrounding the protein, which is assumed to be 3.0Å.42 Model-free analysis21, 22 of relaxation data was carried out using the Modelfree 4.0 software23 and TENSOR2,41 in which 1H–15N bond distance and 15N CSA were set to 1.02Å and −160, respectively. In the Modelfree analysis, the following five combinations of model-free parameters were fitted to the relaxation data with the initial estimate of rotational correlation time22: (1) S2, (2) S2, and τe, (3) S2 and Rex, (4) S2, τe, and Rex, and (5)  , τe, and
  .
.
15N-relaxation dispersion experiment
Relaxation dispersion profiles for the backbone 15N nuclei of NV 3CLpro were recorded using relaxation-compensated constant-time CPMG pulse sequence43, 44 on a Varian VNMRS 500 MHz spectrometer at 25°C. Dispersion data were collected with a 50 ms constant time relaxation delay, Tcp, and CPMG field strength, νcp, between 40 and 920 Hz. Data collection was repeated for one νcp to calculate the standard deviation. The effective transverse relaxation rate,  , comprising the transverse relaxation rate in the absence of exchange, R2, and the component because of chemical exchange, Rex, was calculated via
  (νcp) = (−1/Tcp) ln[I(νcp)/I0], where I(νcp) is the peak intensity at a given CPMG field strength and I0 is the peak intensity without the CPMG relaxation segment. Relaxation dispersion curves were obtained by plotting
  as a function of νcp.
Analytical ultracentrifugation experiments
Sedimentation velocity experiments were conducted using an Optima XL-I ultracentrifuge using the An-60 Ti rotor at 20°C in 20 mM sodium phosphate buffer (pH 6.5) including 0.1M NaCl. Sedimentation was monitored by absorbance using double sector cells with a final loading of 400 μL per cell. Sedimentation was at 49,000 rpm with scans made at 5-min intervals. To evaluate the change in oligomeric state of NV 3CLpro, we evaluated the changes in sedimentation velocity patterns at 30, 200, and 600 μM NV 3CLpro. Sedimentation was monitored at 280 nm for the lower level (30 μM), at 298 nm for the middle level (200 μM), and at 305 nm for the higher level (600 μM). Sedimentation data were analyzed using DCDT+ software version 1.16, and sedimentation coefficients were calculated by using g(s*) fitting function in DCDT+ software. Buffer density and viscosity were calculated using Sednterp version 1.08 (http://www.jphilo.mailway.com [Please confirm that the URL is current and active.]). The partial specific volumes of proteins were calculated from their amino acid composition using Sednterp (0.7345 mL/g at 20°C).
Sedimentation equilibrium studies were also conducted on NV 3CLpro at concentrations of 15, 30, and 60 μM in sodium phosphate buffer. Using a charcoal-filled Epon centerpiece with 6-sector cells, 60 μL samples were overlaid over 30 μL of Fluorinert® FC-43 silicon oil (3M Industrial Chemical Products Division), and 150 μL of matched solvent was introduced in the reference positions. Equilibrium at 4°C was attained at 10,000, 14,000, 18,000, 22,000, and 26,000 rpm. Following equilibration at the lowest speed during a 30-h period, at least an 8-h equilibration time was used for the transition to a higher speed. Sedimentation equilibrium data were globally fit to monomer-only or monomer-dimer models using Beckman software (version 4.0) that was provided with the Optima XL-I ultracentrifuge.
Databank accession numbers
Structural coordinates and experimental constraints have been deposited in the Protein Data Bank with accession code 2LNC.
Acknowledgments
We are grateful to Mr. Huaien Dai and Dr. Debabani Ganguly for their help and suggestions on NMR structure calculation and structural analysis. This work was supported by NIH grants (RR17686, RR17708, and U01 AI081891) and Targeted Excellence Programs of Kansas State University. NMR instrumentation at KSU was funded by NIH grant (S10-RR 025441) and Johnson Cancer Research Center, Manhattan KS. Contribution Number 13-120-J from the Kansas Agricultural Experiment Station.
Glossary
Abbreviations
- AUC
Analytical ultracentrifugation
- CPMG
Carr–Purcell–Meiboom–Gill
- CV 3CLpro
Chiba virus 3C-like protease
- HSQC
Heteronuclear single quantum coherence
- NOE
Nuclear Overhauser effect
- NV 3CLpro
Norwalk virus 3C-like protease
- RMSD
Root mean square deviation
- SV 3CLpro
Southampton virus 3C-like protease
Supplementary material
Additional Supporting Information may be found in the online version of this article.
References
- 1.Fankhauser RL, Noel JS, Monroe SS, Ando T, Glass RI. Molecular epidemiology of “Norwalk-like viruses” in outbreaks of gastroenteritis in the United States. J Infect Dis. 1998;178:1571–1578. doi: 10.1086/314525. [DOI] [PubMed] [Google Scholar]
- 2.Glass RI, Parashar UD, Estes MK. Norovirus gastroenteritis. N Engl J Med. 2009;361:1776–1785. doi: 10.1056/NEJMra0804575. [DOI] [PMC free article] [PubMed] [Google Scholar]
- 3.Hardy ME. Norovirus protein structure and function. FEMS Micobiol Lett. 2005;253:1–8. doi: 10.1016/j.femsle.2005.08.031. [DOI] [PubMed] [Google Scholar]
- 4.Belliot G, Sosnovtsev SV, Mitra T, Hammer C, Garfield M, Green KY. In vitro proteolytic processing of the MD145 norovirus ORF1 nonstructural protein yields stable precursors and products similar to those detected in calicivirus-infected cells. J Virol. 2003;77:10957–10974. doi: 10.1128/JVI.77.20.10957-10974.2003. [DOI] [PMC free article] [PubMed] [Google Scholar]
- 5.Blakeney SJ, Cahill A, Reilly PA. Processing of Norwalk virus nonstructural proteins by a 3C-like cysteine proteinase. Virology. 2003;308:216–224. doi: 10.1016/s0042-6822(03)00004-7. [DOI] [PubMed] [Google Scholar]
- 6.Sosnovtsev SV, Belliot G, Chang KO, Prikhodko PG, Thackray LB, Wobus CE, Karst SM, Virgin SW, Green KY. Cleavage map and proteolytic processing of the murine norovirus nonstructural polyprotein in infected cells. J Virol. 2006;80:7816–7831. doi: 10.1128/JVI.00532-06. [DOI] [PMC free article] [PubMed] [Google Scholar]
- 7.Sosnovtsev SV. Proteolytic cleavage and viral proteins. In: Hansman GS, Jiang XJ, Green KY, editors. Caliciviruses: molecular and cellular virology. Norfolk: Caister Academic Press; 2010. pp. 65–94. [Google Scholar]
- 8.Kuyumcu-Martinez M, Belliot G, Sosnovtsev SV, Chang KO, Green KY, Lloyd RE. Calicivirus 3C-like proteinase inhibits cellular translation by cleavage of poly(A)-binding protein. J Virol. 2004;78:8172–8182. doi: 10.1128/JVI.78.15.8172-8182.2004. [DOI] [PMC free article] [PubMed] [Google Scholar]
- 9.Bazan JF, Fletterick RJ. Viral cysteine proteases are homologous to the trypsin-like family of serine proteases: structural and functional implications. Proc Natl Acad Sci USA. 1988;85:7872–7876. doi: 10.1073/pnas.85.21.7872. [DOI] [PMC free article] [PubMed] [Google Scholar]
- 10.Zeitler CE, Estes MK, Prasad BVV. X-ray crystallographic structure of the Norwalk virus protease at 1.5-Å resolution. J Virol. 2005;80:5050–5058. doi: 10.1128/JVI.80.10.5050-5058.2006. [DOI] [PMC free article] [PubMed] [Google Scholar]
- 11.Kim Y, Lovell S, Tiew KC, Mandadapu SR, Alliston KR, Battaile KP, Groutas WC, Chang KO. Broad-spectrum antivirals against 3C or 3C-like proteases of picornaviruses, noroviruses and coronaviruses. J Virol. 2012 doi: 10.1128/JVI.01348-12. PMID: 22915796. [DOI] [PMC free article] [PubMed] [Google Scholar]
- 12.Nakamura K, Someya Y, Kumasaka T, Ueno G, Yamamoto M, Sato T, Takeda N, Miyamura T, Tanaka N. A norovirus protease structure provides insights into active and substrate binding site integrity. J Virol. 2005;79:13685–13693. doi: 10.1128/JVI.79.21.13685-13693.2005. [DOI] [PMC free article] [PubMed] [Google Scholar]
- 13.Hussey RJ, Coates L, Gill RS, Erskine PT, Coker SF, Mitchell E, Cooper JB, Wood S, Broadbridge R, Clarke IN, Lambden PR, Shoolingin-Jordan PM. A structural study of norovirus 3C protease specificity: binding of a designed active site-directed peptide inhibitor. Biochemistry. 2011;50:240–249. doi: 10.1021/bi1008497. [DOI] [PMC free article] [PubMed] [Google Scholar]
- 14.Someya Y, Takeda N, Miyamura T. Identification of active-site amino acid residues in the Chiba virus 3C-like protease. J Virol. 2002;76:7060–7072. doi: 10.1128/JVI.76.12.5949-5958.2002. [DOI] [PMC free article] [PubMed] [Google Scholar]
- 15.Someya Y, Takeda N. Functional consequences of mutational analysis of norovirus protease. FEBS Lett. 2011;585:369–374. doi: 10.1016/j.febslet.2010.12.018. [DOI] [PubMed] [Google Scholar]
- 16.Someya Y, Takeda N. Insights into the enzyme-substrate interaction in the norovirus 3C-like protease. J Biochem. 2009;146:509–521. doi: 10.1093/jb/mvp094. [DOI] [PubMed] [Google Scholar]
- 17.Takahashi D, Kim Y, Chang KO, Anbanandam A, Prakash O. Backbone and side-chain 1H, 15N, and 13C resonance assignments of Norwalk virus protease. Biomol NMR Assign. 2012;6:19–21. doi: 10.1007/s12104-011-9316-3. [DOI] [PMC free article] [PubMed] [Google Scholar]
- 18.Sikic K, Tomic S, Carugo O. Systematic comparison of crystal and NMR protein structures deposited in the protein data bank. Open Biochem J. 2010;4:83–95. doi: 10.2174/1874091X01004010083. [DOI] [PMC free article] [PubMed] [Google Scholar]
- 19.Kay LE, Torchia DA, Bax A. Backbone dynamics of proteins as studied by 15N inverse detected heteronuclear NMR spectroscopy: application to staphylococcal nuclease. Biochemistry. 1989;28:8972–8979. doi: 10.1021/bi00449a003. [DOI] [PubMed] [Google Scholar]
- 20.Jarymowycz VA, Stone MJ. Fast time scale dynamics of protein backbones: NMR relaxation methods, applications, and functional consequences. Chem Rev. 2006;106:1624–1671. doi: 10.1021/cr040421p. [DOI] [PubMed] [Google Scholar]
- 21.Lipari G, Szabo A. Model-free approach to the interpretation of nuclear magnetic resonance relaxation in macromolecules. 1. Theory and range of validity. J Am Chem Soc. 1982;104:4546–4559. [Google Scholar]
- 22.Lipari G, Szabo A. Model-free approach to the interpretation of nuclear magnetic resonance relaxation in macromolecules. 2. Analysis of experimental results. J Am Chem Soc. 1982;104:4559–4570. [Google Scholar]
- 23.Mandel AM, Akke M, Palmer AG. Backbone dynamics of Escherichia coli ribonuclease HI: correlation with structure and function in an active enzyme. J Mol Biol. 1995;246:144–163. doi: 10.1006/jmbi.1994.0073. [DOI] [PubMed] [Google Scholar]
- 24.Clore GM, Driscoll PC, Wingfield PT, Gronenborn AM. Analysis of backbone dynamics of interleukin-1β using two-dimensional inverse detected heteronuclear 15N-1H NMR spectroscopy. Biochemistry. 1990;29:7387–7401. doi: 10.1021/bi00484a006. [DOI] [PubMed] [Google Scholar]
- 25.Epstein DM, Benkovic SJ, Wright PE. Dynamics of the dihydrofolate reductase-folate complex: catalytic sites and regions known to undergo conformational change exhibit diverse dynamical features. Biochemistry. 1995;34:11037–11048. doi: 10.1021/bi00035a009. [DOI] [PubMed] [Google Scholar]
- 26.Chang KO, Takahashi D, Prakash O, Kim Y. Characterization and inhibition of norovirus proteases of genogroups I and II using a fluorescence resonance energy transfer assay. Virology. 2012;423:125–133. doi: 10.1016/j.virol.2011.12.002. [DOI] [PMC free article] [PubMed] [Google Scholar]
- 27.Henzler-Wildman K, Kern D. Dynamic personalities of proteins. Nature. 2007;450:964–972. doi: 10.1038/nature06522. [DOI] [PubMed] [Google Scholar]
- 28.Lange OF, Lakomek NA, Farès C, Schröder GF, Walter KFA, Becker S, Meiler J, Grubmüller H, Griesinger C, de Groot BL. Recognition dynamics up to microseconds revealed from an RDC-derived ubiquitin ensemble in solution. Science. 2008;320:1471–1475. doi: 10.1126/science.1157092. [DOI] [PubMed] [Google Scholar]
- 29.Bhabha G, Lee J, Ekiert DC, Gam J, Wilson IA, Dyson HJ, Benkovic SJ, Wright PE. A dynamic knockout reveals that conformational fluctuations influence the chemical step of enzyme catalysis. Science. 2011;332:234–238. doi: 10.1126/science.1198542. [DOI] [PMC free article] [PubMed] [Google Scholar]
- 30.Delaglio F, Grzesiek S, Vuister GW, Zhu G, Pfeifer J, Bax A. NMRPipe: a multidimensional spectral processing system based on UNIX pipes. J Biomol NMR. 1995;6:277–293. doi: 10.1007/BF00197809. [DOI] [PubMed] [Google Scholar]
- 31.Keller R. Computer Aided Resonance Assignment. 2004. http://cara.nmr.ch/. Accessed Jan 2013.
- 32.Goddard TD, Kneller DG. http://www.cgl.ucsf.edu/home/sparky.
- 33.Shen Y, Delaglio F, Cornilescu G, Bax A. TALOS+: a hybrid method for predicting protein backbone torsion angles from NMR chemical shifts. J Biomol NMR. 2009;44:213–223. doi: 10.1007/s10858-009-9333-z. [DOI] [PMC free article] [PubMed] [Google Scholar]
- 34.Brunger AT, Adams PD, Clore GM, Gros P, Grosse-Kunstleve RW, Jiang JS, Kuszewski J, Nilges N, Pannu NS, Read RJ, Rice LM, Simonson T, Warren GL. Crystallography & NMR System (CNS), a new software suite for macromolecular structure determination. Acta Cryst D. 1998;54:905–921. doi: 10.1107/s0907444998003254. [DOI] [PubMed] [Google Scholar]
- 35.Brunger AT. Version 1.2 of the Crystallography and NMR System. Nat Protoc. 2007;2:2728–2733. doi: 10.1038/nprot.2007.406. [DOI] [PubMed] [Google Scholar]
- 36.Laskowski RA, Rullmannn JA, MacArthur MW, Kaptein R, Thornton JM. AQUA and PROCHECK-NMR: programs for checking the quality of protein structures solved by NMR. J Biomol NMR. 1996;8:477–486. doi: 10.1007/BF00228148. [DOI] [PubMed] [Google Scholar]
- 37.Koradi R, Billeter M, Wüthrich K. MOLMOL: a program for display and analysis of macromolecular structures. J Mol Graphics. 1996;14:51–57. doi: 10.1016/0263-7855(96)00009-4. [DOI] [PubMed] [Google Scholar]
- 38.Kay LE, Torchia DA, Bax A. Backbone dynamics of proteins as studied by 15N-inverse detected heteronuclear NMR spectroscopy: application to staphylococcal nuclease. Biochemistry. 1989;28:8972–8979. doi: 10.1021/bi00449a003. [DOI] [PubMed] [Google Scholar]
- 39.Barbato G, Ikura M, Kay LE, Pator RW, Bax A. Backbone dynamics of calmodulin studied by 15N relaxation using inverse detected two-dimensional NMR spectroscopy: the central helix is flexible. Biochemistry. 1992;31:5269–5278. doi: 10.1021/bi00138a005. [DOI] [PubMed] [Google Scholar]
- 40.Farrow NA, Muhandiram R, Singer AU, Pascal SM, Kay CM, Gish G, Shoelson SE, Pawson T, Forman-Kay JD, Kay LE. Backbone dynamics of a free and phosphopeptide-complexed Src homology 2 domain studied by 15N NMR relaxation. Biochemistry. 1994;33:5984–6003. doi: 10.1021/bi00185a040. [DOI] [PubMed] [Google Scholar]
- 41.Dosset P, Hus JC, Blackledge M, Marion D. Efficient analysis of macromolecular rotational diffusion from heteronuclear relaxation data. J Biomol NMR. 2000;16:23–28. doi: 10.1023/a:1008305808620. [DOI] [PubMed] [Google Scholar]
- 42.Cavanagh J, Fairbrother WJ, Palmer AG, Rance M, Skelton NJ. Protein NMR spectroscopy, principles and practice. 2nd ed. Waltham, MA: Elsevier; 2006. [Google Scholar]
- 43.Loria JP, Rance M, Palmer AG., III A relaxation-compensated Carr-Purcell-Meiboom-Gill sequence for characterizing chemical exchange by NMR spectroscopy. J Am Chem Soc. 1999;121:2331–2332. [Google Scholar]
- 44.Tollinger M, Skrynnikov NR, Mulder FAA, Forman-Kay JD, Kay LE. Slow dynamics of folded and unfolded states of an SH3 domain. J Am Chem Soc. 2001;123:11341–11352. doi: 10.1021/ja011300z. [DOI] [PubMed] [Google Scholar]
Associated Data
This section collects any data citations, data availability statements, or supplementary materials included in this article.