Abstract
Since 1980, high-speed counter-current chromatography (HSCCC) has been used for separation and purification of natural and synthetic products in a standard elution mode. In 1991, a novel elution mode called pH-zone refining CCC was introduced from an incidental discovery that an organic acid in the sample solution formed the sharp peak of an acid analyte. The cause of this sharp peak formation was found to be bromoacetic acid present in the sample solution which formed a sharp trailing border to trap the acidic analyte. Further studies on the separation of DNP-amino acids with three spacer acids in the stationary phase revealed that increased sample size resulted in the formation of fused rectangular peaks, each preserving high purity and zone pH with sharp boundaries. The mechanism of this phenomenon was found to be the formation of a sharp trailing border of an acid (retainer) in the column which moves at a lower rate than that of the mobile phase. In order to facilitate the application of the method, a new method was devised using a set of retainer and eluter to form a sharp retainer rear border which moves through the column at a desired rate regardless of the composition of the two-phase solvent system. This was achieved by adding the retainer in the stationary phase and the eluter in the mobile phase at a given molar ratio. Using this new method the hydrodynamics of pH-zone-refining CCC was diagrammatically illustrated by three acidic samples. In this review paper, typical pH-zone-refining CCC separations were presented, including affinity separations with a ligand and a separation of a racemic mixture using a chiral selector in the stationary phase. Major characteristics of pH-zone-refining CCC over conventional HSCCC are as follows: the sample loading capacity is increased over 10 times; fractions are highly concentrated near saturation level; yield is improved by increasing the sample size; minute charged compounds are concentrated and detected at the peak boundaries; and elution peaks are monitored with a pH flow meter for compounds with no chromophore. Since 1994, over 70 research papers on pH-zone-refining CCC have been published with the trends increasing in the recent years.
Keywords: High-speed counter-current, chromatography (HSCCC), pH-zone-refining CCC, pH-peak-focusing CCC, Preparative separation, Affinity CCC, Chiral CCC
1. Origin of pH-zone-refining counter-current chromatography
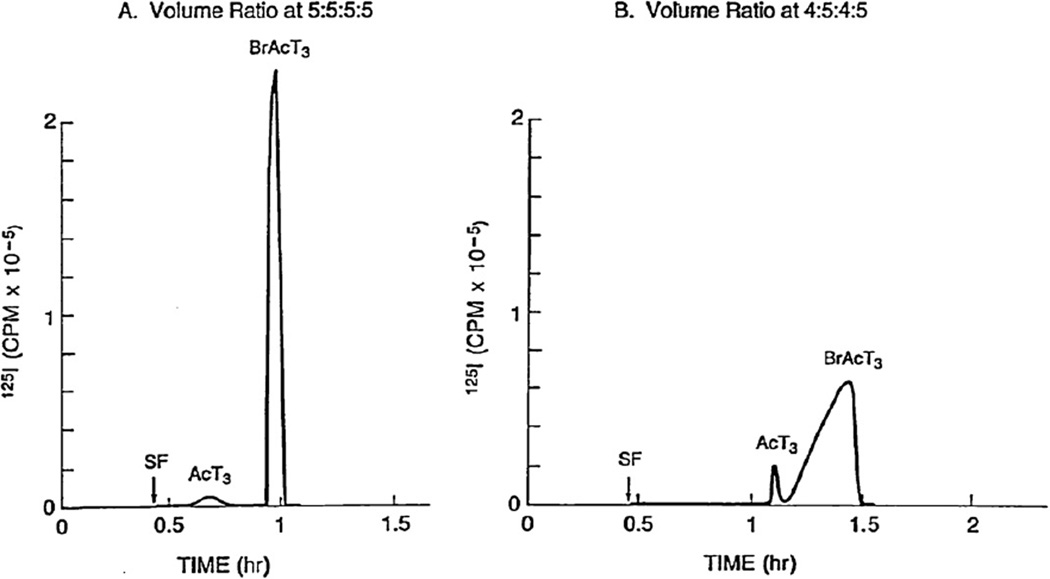
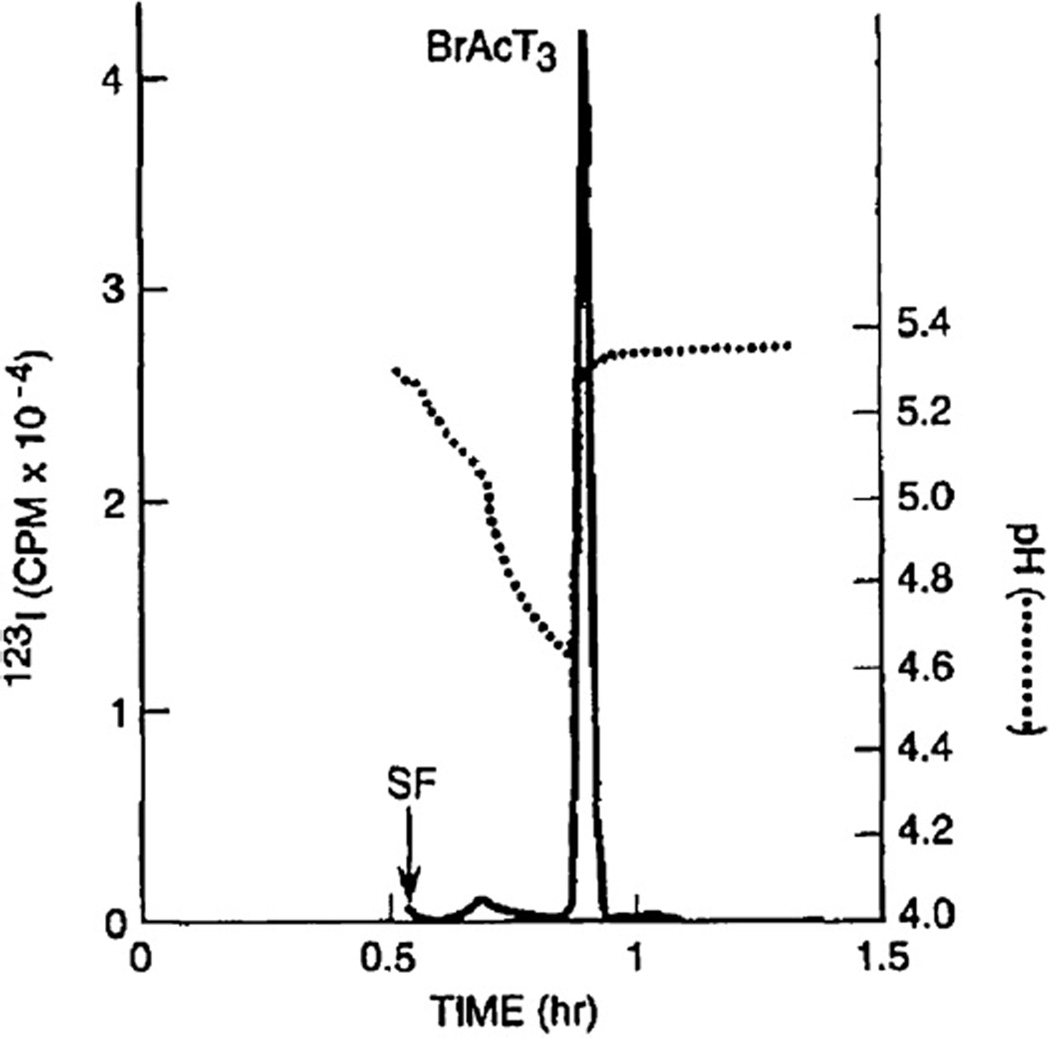
High-speed counter-current chromatography (HSCCC) has been used for preparative separations of various natural products [1–7]. The method uses a two-phase solvent system to resolve target components according to their partition coefficients. In the typical semi-preparative separation column (ca. 320 ml capacity) used in a research laboratory, the amount of sample size is limited to several hundred milligrams. However, this maximum sample loading capacity was increased to multi-gram quantities by a new method called pH-zone-refining CCC that was developed from an incidental discovery during the purification of bromoacetyl-T3, the thyroxin derivative [8,9]. Two chromatograms in Fig. 1 were obtained from the separation of bromoacetyl-T3 where the left chromatogram was obtained with a two-phase solvent system composed of hexane–ethyl acetate–methanol–water at a volume ratio of 5:5:5:5. Strangely enough, it produced an extremely sharp target peak of over two thousand theoretical plates while the preceding impurity peak showed the normal partition efficiency of about 800 theoretical plates. After several trials, the clue to understanding this mysterious phenomenon was obtained when the composition of the solvent system was modified to a volume ratio of 4:5:4:5, as shown in the right chromatogram. Surprisingly the sharp target peak became much broader and the preceding impurity peak was sharpened. This suggested that some agent present in the crude sample solution must be responsible for sharpening the co-eluting peak. Then, the pH value of the obtained fraction was measured. As shown in Fig. 2, after the solvent front emerged the pH curve started to drop gradually until the very point of the beginning of the sharp target peak when it sharply rose to the original level. This clearly indicated that an acid present in the sample solution was the cause of sharpening the target peak. As expected, mass spectrometric analysis of the sample solution showed bromoacetic acid, a reaction side product. This acid is called a retainer since it retains the target compound in the stationary phase by its protonation.
Fig. 1.
Chromatograms of bromoacetyl T3 (BrAcT3) obtained using a two-phase solvent system composed of hexane, ethyl acetate, methanol and 15 mM ammonium acetate (pH 4) at two different volume ratios of 5:5:5:5 (A) and 4:5:4:5 (B) under otherwise identical experimental conditions. Experimental conditions: Apparatus: type-J high-speed CCC centrifuge with a multilayer coil separation column (1.6 mm ID and 320 ml capacity); sample: crude bromoacetylation mixture with a minute amount of [125I]T3 for detection in 4 ml of solvent containing equal volumes of each phase; mobile phase: aqueous phase (pH 5.2); flow rate: 3 ml/min; revolution: 800 rpm; detection: 125I radioactivity; stationary phase retention: 69.8% (A) and 64.7% (B); SF: solvent front. Note that the peak profile of BrAcT3 and AcT3 (acetyl T3) is reversed by a slight change in the solvent ratio.
Fig. 2.
Discovery of the cause for the sharp peak formation of BrAcT3 by pH measurement of the fractions. The elution of the sharp peak coincided with the abrupt rise of the pH suggesting that the acid in sample solution is causing the peak sharpening. Experimental conditions: Sample: CCC purified BrAcT3 (ca. 0.1 mmol) with blank bromoacetylation mixture. Other experimental conditions were described in Fig. 1 caption.
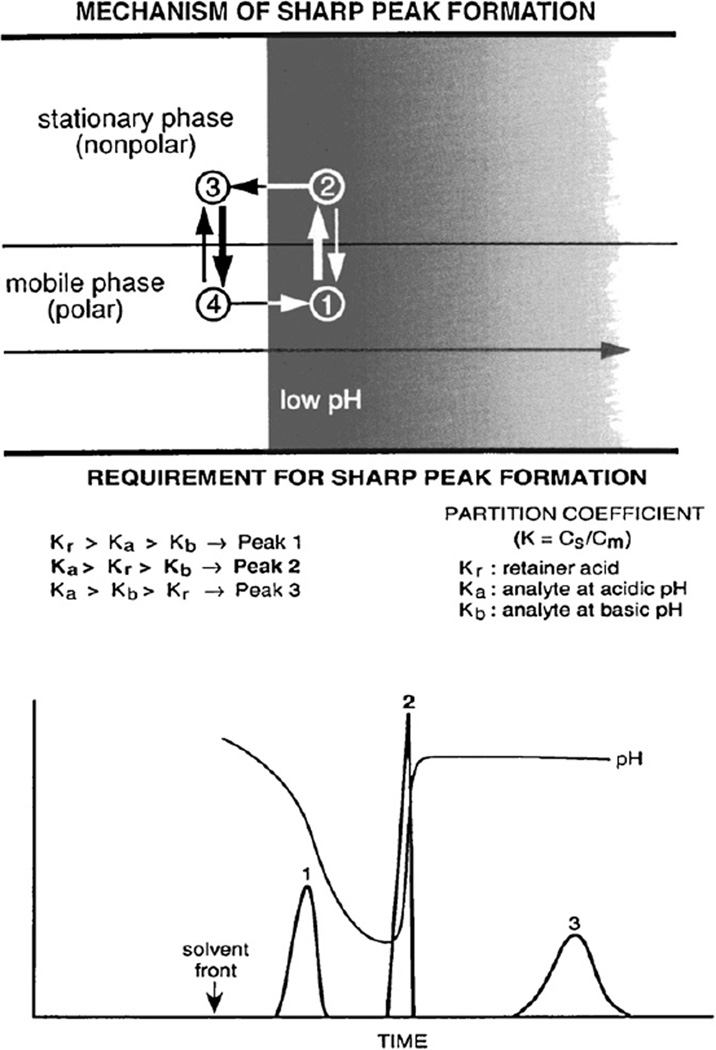
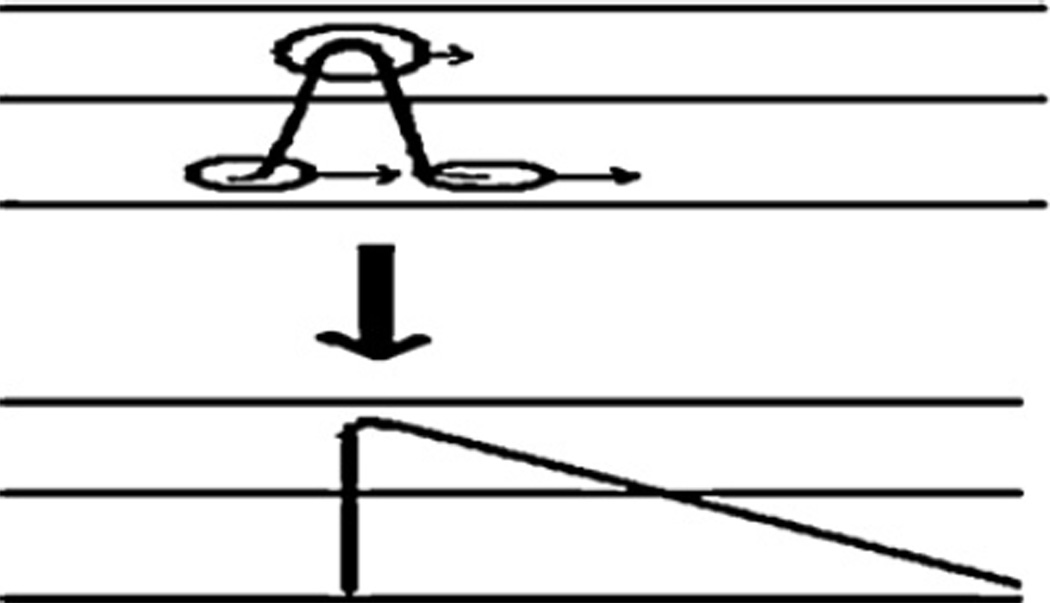
The mechanism of this peak-sharpening phenomenon is illustrated in the upper diagram of Fig. 3 which shows a portion of the separation column containing the organic stationary phase in the upper half and the aqueous mobile phase in the lower half. Because of its nonlinear isotherm (see Fig. 6), the acid in the sample solution forms a sharp trailing border, as explained later in detail. This sharp acid border traps an acid analyte in the following manner: when the analyte molecule is present in the mobile phase at position 1, it is protonated by acidic pH and transferred into the organic stationary phase at position 2; as the sharp acid border moves forward, the analyte molecule is exposed to high pH at position 3, deprotonated and transferred back to the aqueous mobile phase at position 4, where it quickly migrates through the sharp acid border in position 1 to repeat the above cycle. Consequently, the analyte is trapped by the sharp acid border and eluted as a sharp peak together with the sharp retainer acid border. The requirement of this sharp peak formation is shown in the lower diagram. In order to form the sharp peak, the solute should be partitioned mostly into the upper phase on the right side of the sharp acid border (Ka > Kr), and it should be partitioned mostly into the lower phase on the left side of the sharp acid border (Kb < Kr). If the solute is not distributed enough in the upper phase on the right side of the sharp acid border (Ka < Kr), it will elute as a broad peak (peak 1) before the sharp acid border. Similarly, if the solute is not distributed enough in the lower phase on the left side of the sharp acid border (Kb > Kr), it will elute after the sharp acid border as a broad peak (peak 3), as shown in this chromatogram [9].
Fig. 3.
Schematic illustration of the peak sharpening process in the separation column and general requirement of sharp peak formation. Upper diagram shows a portion of the separation column that contains organic stationary phase in the upper half and aqueous mobile phase in the lower half. The acid present in the sample solution forms a sharp trailing border around which the solute molecules circulate by repeated protonation (on the right side) and deprotonation (on the left side) to form a sharp peak as described in the text. The lower diagram shows the requirement for sharp peak formation. Peak 1 is obtained when both Ka and Kb are smaller than Kr, while peak 3 is obtained when both Ka and Kb are greater than Kr. Sharp peak 2 is only formed when Kr falls between Ka and Kb, as indicated in the figure.
Fig. 6.
Mechanism of formation of a sharp acid trailing border in the column due to non-linear isotherm. Upper diagram illustrates the Gaussian distribution of the acid at the beginning portion of the column where the concentrated upper portion of the peak is more distributed in the stationary phase and moves at a lower rate while the dilute foot of the peak is more distributed into the lower mobile phase and moves faster making a skewed peak distribution as shown in the lower diagram.
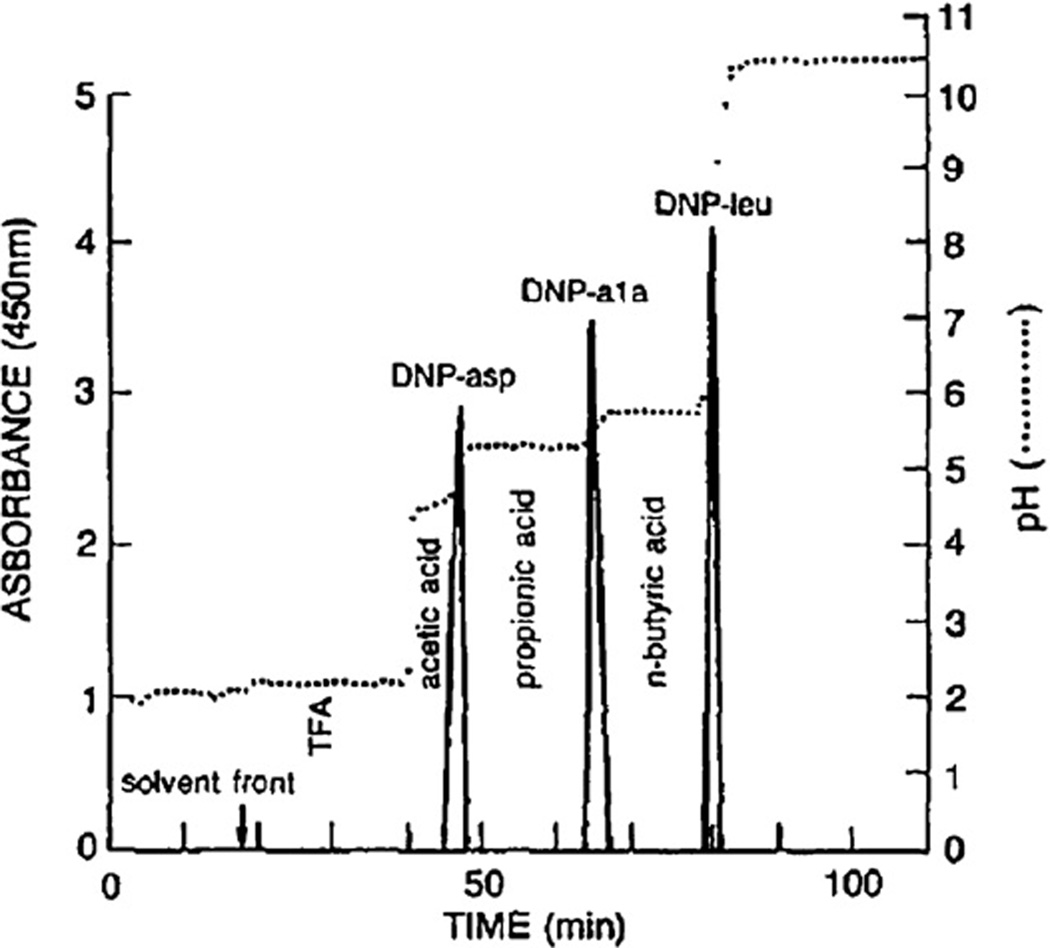
This pH-peak-focusing method may be applied to separate a small amount of acidic solutes using a set of spacers in the stationary phase. Fig. 4 shows the separation of DNP (dinitrophenyl)-amino acids using three spacer acids, acetic acid, propionic acid, and n-butyric acid, in the stationary phase. Polar DNP-glutamic acid is eluted between acetic and propionic acids, DNP-alanine, between propionic and n-butyric acids, and the most hydrophobic DNP-leucine, after n-butyric acid. This method can be effectively applied for the separation and concentration of a small amount of organic ions present in a large volume of the sample solution [9]. However, it was discovered that the most useful application of this technique is for a large-scale preparative separation.
Fig. 4.
Separation of three DNP-amino acids with spacer acids. Three spacer acids added in the sample solution each formed pH-zone to isolate sharp analyte peaks at their boundaries. Experimental conditions: Apparatus: Type-J high-speed coil planet centrifuge with a multilayer coil separation column (1.6 mm ID and 315 ml capacity); solvent system: methyl tert.-butyl ether–acetonitrile–water (4:1:5, v/v); retainer: TFA, acetic acid, propionic acid and n-butyric acid, each 0.4 µl in 1 ml in the organic stationary phase; eluter: 0.1% ammonia in the aqueous mobile phase (pH 10.77); sample: DNP-l-aspartic acid, DNP-l-alanine and DNP-l-leucine each 1 mg; flow rate: 3 ml/min; revolution: 800 rpm; retention of stationary phase: 81%.
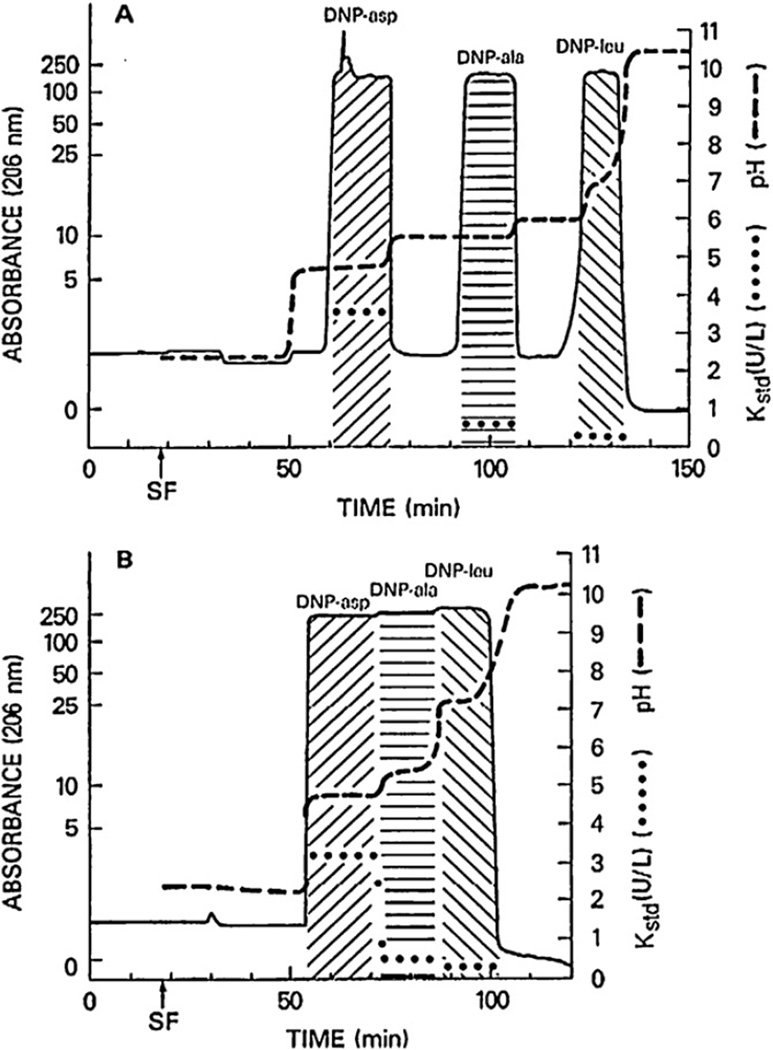
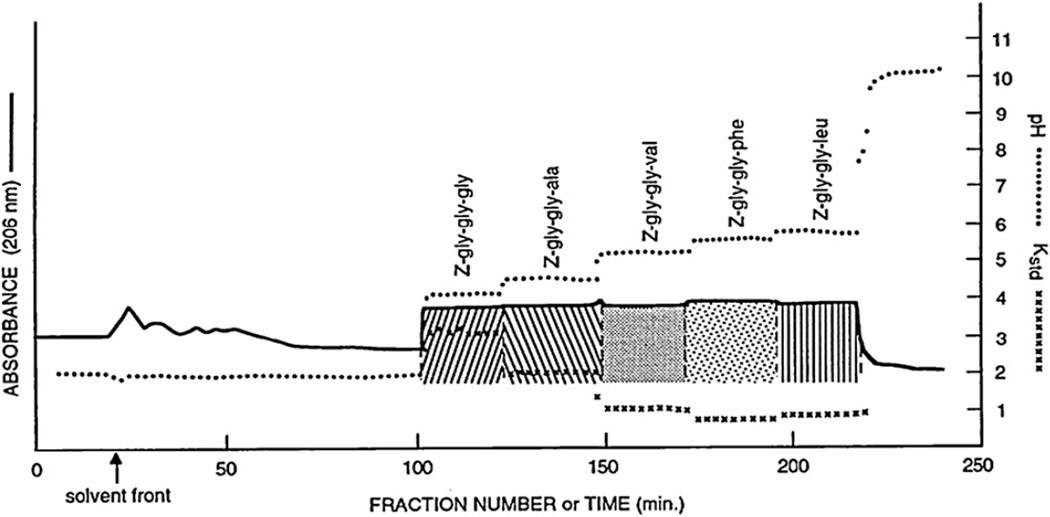
When the sample size of the above DNP-amino acids was increased each from 1 mg to 100 mg, a strange chromatogram was produced, as shown in the upper diagram of Fig. 5, where all peaks became rectangular in shape, each associated with its own specific pH. As shown in the lower chromatogram, elimination of the spacer acids from the sample solution resulted in the fusion of these peaks which still maintained their own pH and specific K values, suggesting that the rectangular shape of each peak was well preserved [10,11]. The method is named “pH-zone-refining CCC” after the formation of pH zones, each containing the pure analyte.
Fig. 5.
pH-zone-refining CCC of DNP-amino acids with (A) and without (B) spacer acids in the stationary phase. (A) Rectangular shape of DNP-amino acids are widely separated from each other by three spacer acids (acetic acid, propionic and n-butyric acid). (B) Elimination of these spacer acids resulted in fusion of all rectangular peaks with minimum overlapping as demonstrated by associated pH and partition coefficient values (Kstd). Experimental conditions are identical to those in Fig. 4 except that the sample size was increased from 1 mg to 100 mg for each DNP-amino acid. Kstd values were obtained by partitioning an aliquot of each fraction into the standard two-phase solvent system composed of chloroform–acetic acid–0.1 M HCl (2:2:1, v/v) used for the separation. SF: solvent front.
2. Mechanism of pH-zone-refining CCC
2.1. Formation of sharp retainer border
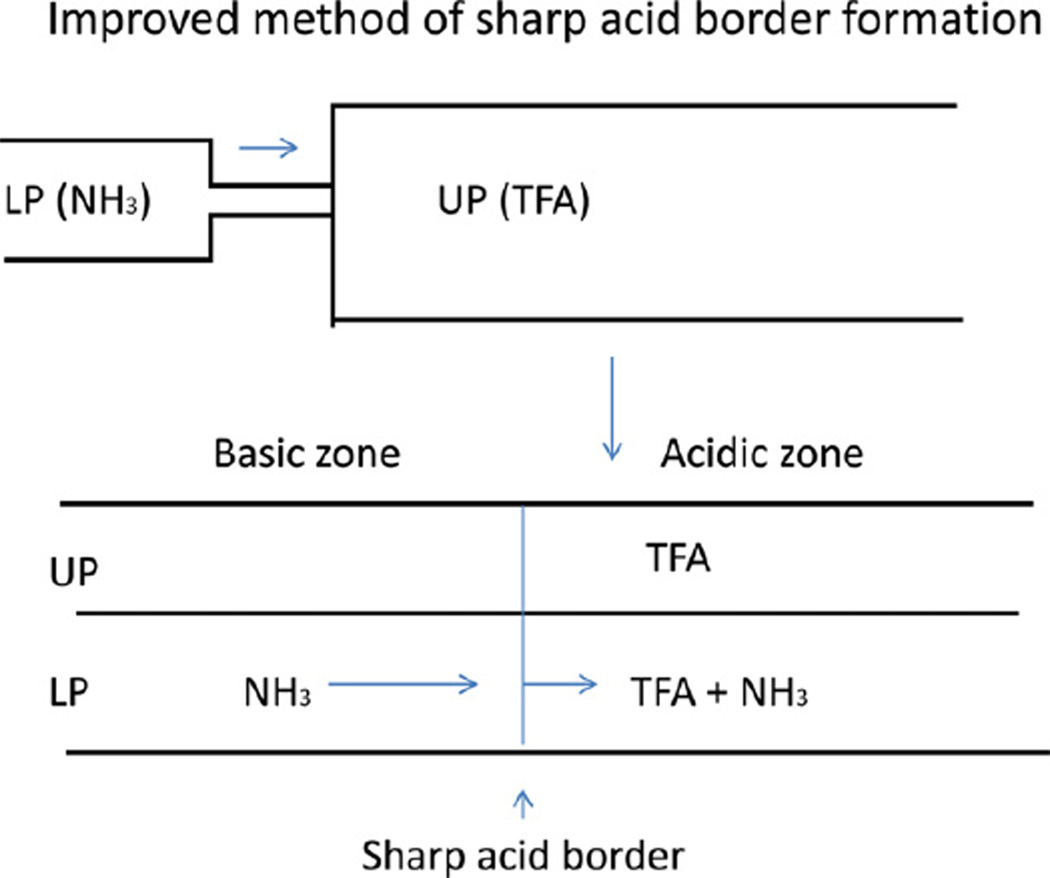
As described earlier, the key element of pH-zone-refining CCC is the formation of a sharp trailing border of the retainer peak which travels through the column at a rate substantially lower than that of the mobile phase. In the separation of bromoacetyl-T3, the mechanism of formation of the sharp trailing border of bromoacetic acid is illustrated in Fig. 6. In the early stage of separation, the acid forms a Gaussian distribution in the column, as shown in the upper diagram. In this peak distribution, the analyte in the upper portion of the peak is more hydrophobic due to its high concentration, and moves through the column at a lower rate, as indicated by a short arrow. The analyte at the lower portion of the peak, however, is more dissociated due to its lower concentration which increases its polarity and thus it moves through the column at a higher rate. Consequently, as the elution proceeds, the front portion of the peak spreads forward, while the rear portion of the peak joins the major peak to form a sharp acid border, as shown in the lower diagram. Here, the traveling rate of this sharp border is determined by the K value of the bromoacetic acid in this two-phase solvent system. Since the formation and traveling rate of the sharp retainer border are the two key factors in pH-zone-refining CCC, the method has been improved to enable formation of sharp retainer border by introducing the retainer in the stationary phase and the eluter in the mobile phase, so that the traveling rate of the sharp border is conveniently adjusted by the retainer/eluter molar concentration ratio, regardless of the composition of the two-phase solvent system used in the separation.
Fig. 7 shows this new method of forming the sharp acid retainer (trifluoroacetic acid, TFA) border in the column, the traveling speed of which is determined by the molar concentration ratio between the retainer and eluter. In the upper diagram, the column is filled with the upper stationary phase containing TFA as a retainer, and the column is eluted with the lower phase containing NH3 as an eluter.
Fig. 7.
Improved method for forming a sharp retainer border in the column. The column is first filled with the upper phase containing retainer (TFA) followed by elution with the mobile phase containing an eluter (NH3). As the elution proceeds, NH3 in the mobile phase gradually neutralizes TFA in the stationary phase to form a sharp acid/base border which moves through the column at a rate determined by the molar ratio of retainer/eluter.
Under these conditions TFA in the stationary phase is neutralized gradually by NH3 in the mobile phase forming the sharp TFA border in the column. As stated earlier, the moving rate of this sharp border is adjusted by the molar concentration ratio between the retainer and eluter. For example, if the molar concentration ratio is one, such as TFA at 10 mM in the stationary phase and NH3 at 10 mM in the mobile phase, the sharp TFA border will move through the column at a speed close to that of a compound with K = 1 regardless of the composition of the two-phase solvent system. If the molar concentration of the retainer relative to that of the eluter is greater than one, the sharp border will move at a lower rate through the column, and vice versa if the concentration ratio is less than one. In most cases, it is desirable to adjust the speed of the sharp retainer border close to that of the compound having K = 1 so that the pH-zone of the target compounds starts at some distance away from the solvent front to avoid contamination by polar neutral impurities which elute near the solvent front.
The concentration of the retainer and eluter may also need some other adjustments. First of all, since the eluter becomes a counterion for the target compound, its molar concentration largely determines the molar concentration of each target compound in the fraction. Therefore, a high concentration of eluter yields a high concentration of each target compound in a shorter elution time. However, if the concentration of the target compound exceeds its solubility in the stationary phase, the target compound will precipitate in the column and plug the channel, thereby causing column damage. Secondly, high retainer concentration also reduces the yield of the pure compound due to the shortened pH zone width relative to that of the mixing zone. In general, use of 10–20 mM concentrations for the retainer and for the eluter is recommended.
2.2. Model system
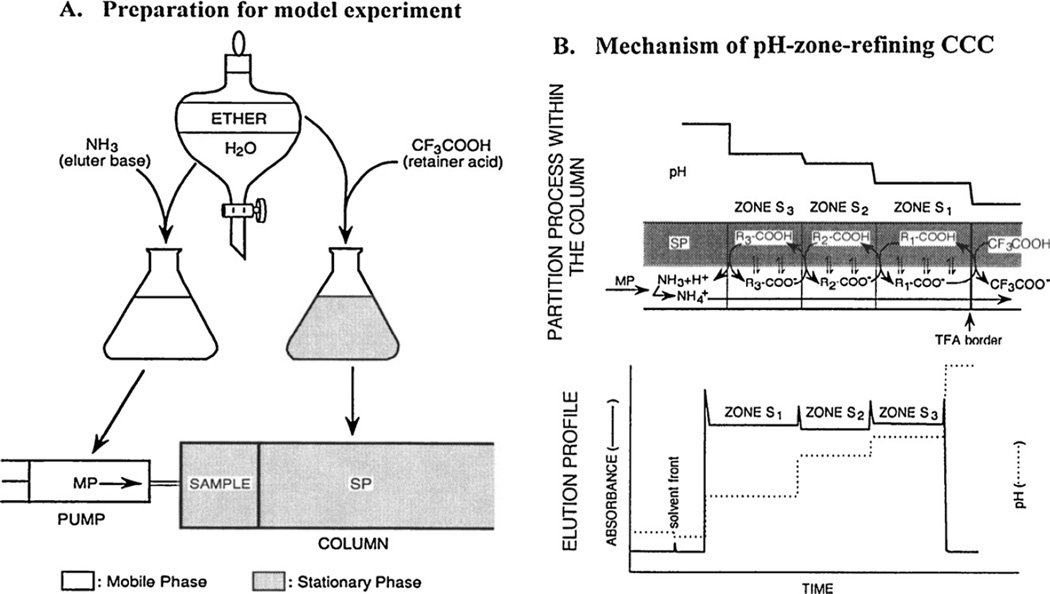
Fig. 8 demonstrates the mechanism of pH-zone-refining CCC for separation of acidic analytes [11]. The preparation of the solvent system and separation procedure based on the above method are illustrated in Fig. 8A. Ether and water are equilibrated in a separatory funnel and separated. The upper organic phase is used as the stationary phase after adding a suitable amount of TFA as a retainer. The lower aqueous phase is used as the mobile phase after adding ammonia as an eluter. The experiment is initiated by filling the entire column with the stationary phase, immediately followed by injecting the sample solution containing three major acidic analytes, S1, S2 and S3. Then, the column is eluted with the mobile phase while it is rotated at a desired speed. The upper diagram of Fig. 8B shows steady-state hydrodynamic equilibrium established in the separation column. The retainer acid TFA first forms a sharp trailing border which travels through the column at a constant rate, substantially lower than that of the mobile phase. The three analytes are all accumulated behind the sharp TFA border by repeating protonation and deprotonation around it. As the concentration of these analytes increases behind the sharp TFA border, increased acidity in the aqueous phase retards the movement of S2 and S3, leaving S1 (the most polar component with the lowest pKa), which can still maintain its moving rate higher than that of the sharp TFA border to repeat circling around it. After some period of time, S1 forms a sharp trailing border against S2 and S3. The above process is repeated until S3, the least polar compound, forms a sharp trailing border. Thus, the three analytes, S1, S2, and S3, each forms a discrete pH zone behind the sharp retainer border in the order of their pKas and hydrophobicities, as shown in the upper diagram. As indicated by curved arrows, the proton transfer of each solute takes place at the zone boundary according to the difference in pH between the neighboring zones, causing solute exchange between the two phases. After this hydrodynamic equilibrium is established, all solute zones move at the same rate as the sharp TFA retainer border. Charged impurities present in each zone are eliminated either forward or backward according to their pKas and hydrophobicities (see Eq. (4) in Section 2.3), and accumulate at the zone boundaries. Consequently, all three analytes are eluted as fused rectangular peaks with minimum overlap. They are associated with sharp impurity peaks at their boundaries, as shown in the lower diagram.
Fig. 8.
Schematic demonstration of pH-zone-refining CCC. (A) Preparation of the solvent system for separation of three acidic analytes. (B) Hydrodynamic process (upper diagram) and elution curve (lower diagram) of three acidic analytes by pH-zone-refining CCC.
2.3. Equilibria theory
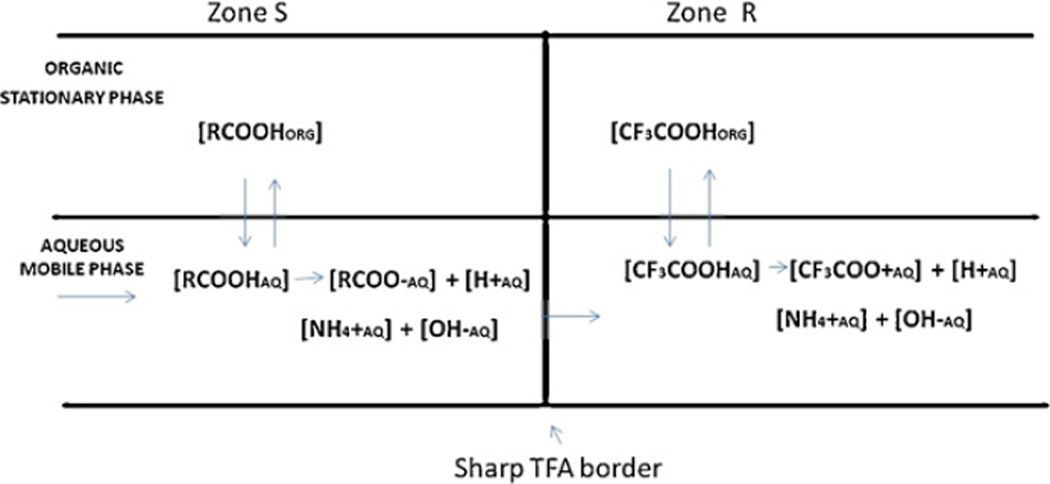
The mathematical analysis of the hydrodynamics involved in pH-zone-refining CCC has been described in detail in the review paper published in 1996 [11]. Here, the most important parts of the analysis, which determine the pH of the solute zones, are briefly restated. Fig. 9 shows the portion of the separation column where hydrodynamic equilibrium is established. The retainer TFA (CF3COOH) forms a sharp trailing border which moves through a column at a rate slower than that of the mobile phase, while solute S (RCOOH) is accumulated behind the sharp border. Assuming that the concentration of the ionized form of the solute in the upper organic phase is negligible, the pH of the mobile phase (pHz-s) behind the sharp border (zone S) is caluculated using the following three equations:
| (1) |
| (2) |
| (3) |
where KD-s is the partition ratio of solute S (RCOOH) in zone S, Ks is the partition coefficient of the solute, and Ka-s is the dissociation constant of the solute. These three equations are reduced to:
| (4) |
Fig. 9.
Hydrodynamic equilibrium of retainer acid (zone R) and solute S (zone S) on respective side of the sharp TFA border in the separation column.
As indicated in Eq. (4), the pH of the solute zone is determined by pKa, KD-s (hydrophobicity) and Ks (partition coefficient of the solute). The studies on equilibrium modeling for pH-zone-refining CCC [12] suggest that two ionic solutes may be resolved if the difference between their zone pH (pHz-s) is greater than 0.2.
3. Procedure for performing pH-zone-refining CCC
3.1. Selection of retainer and eluter
The most commonly-used retainers for the acidic analytes are organic acids, typically TFA, and those for the basic analytes are organic bases such as triethylamine (TEA). For highly polar compounds such as sulfonic acid dyes, sulfuric acid is used as the retainer together with a basic ligand (hydrophobic counterion) such as dodecylamine which holds the sulfuric acid in the upper organic phase. The eluters for the acidic analytes are inorganic bases such as NH3, Na2CO3, and NaOH depending on the acidity of the analyte. Among those, NH3 is most commonly used for the separation of carboxylic acids whereas Na2CO3 and NaOH are used for phenolic compounds. The eluters for the basic analytes are inorganic acids such as HCl.
As stated earlier, the concentration of the eluter determines the solute concentration in the fraction, while the ratio between the concentration of the retainer and that of the eluter determines the retention time of the analytes. Generally, equimolar concentrations of retainer and eluter, such as 10–20 mM each, are used for separation.
3.2. Selection of two-phase solvent system
The selection of a suitable two-phase solvent system for pH-zone-refining CCC is much more limited than for the conventional HSCCC method. Since the samples are acid or base, the solvent selection is usually limited to a few two-phase solvent systems such as methyl tert.-butyl ether (MTBE)/water, MTBE/acetonitrile/water at a volume ratio of 4:1:5 or 2:2:3, and 1-butanol/water for most hydrophilic samples. A systematic way to select the two-phase solvent system is illustrated below. It is the most important first step toward achieving successful separations by pH-zone-refining CCC.
Select a two-phase solvent system which gives a K value of the target compound close to one (this determines the moving rate of the sharp retainer border to be close to that of the K = 1 compound).
Equilibrate the two phases (each 2 ml) with a small amount of sample in a test tube.
Add the appropriate eluter to the test tube (this gives a hydrodynamic condition on the left side of the sharp retainer border in Fig. 7). If the sample is an acid, add NH3 to the test tube to bring the pH to a value >10. If the sample is a base, add HCl to the test tube to bring the pH to a value <2.
Then measure the K values. If K is much lower than one, proceed to the next step.
Add the retainer to the test tube (this gives a hydrodynamic condition on the right side of the sharp peak in Fig. 7). For an acid sample, add TFA to lower the pH to a value <2. For a basic sample, add TEA to bring the pH to a value >10.
Then measure the K value of the compound. If K is much greater than one, the two-phase solvent system can be effectively used for pH-zone-refining CCC.
If the above conditions are not satisfied, one should try a different two-phase solvent system and repeat the above steps. In case, step 4 is not satisfied, try a more hydrophobic solvent system whereas if step 7 is not satisfied, try a more polar solvent system. For phenolic compounds such as flavonoids, lignans, and polyphenols, use NaOH or Na2CO3 as an eluter.
When the pure sample is available, one can make a K determination simply by using a spectrophotometer. If the sample is a crude mixture, it is necessary to use the HPLC method to determine the K value of each component.
3.3. Sample solution preparation
The preparation of sample solutions for pH-zone-refining CCC is totally different from that for the standard HSCCC separation. The semi-preparative column with a 320 ml capacity can separate up to 5 g of sample as long as the solubility permits, and the yield of pure fraction increases with the sample size. The maximum volume of the sample solution can be determined by the retention volume of the stationary phase in the column. In the aforementioned separation column, up to 100 ml of sample solution consisting of equal volumes of each phase can be charged without problem, provided that the retention of the stationary phase is over 50%. The molar concentration of the eluter largely determines the molar concentration of the analytes in each zone regardless of the concentration of the analytes in the sample solution. Preparation of the sample solution requires some caution. It is recommended to use an approximately equal volume of the two phases: upper organic phase containing the retainer and an equal volume of the lower phase without the eluter. If the sample is not completely dissolved, one may add more solvents or eliminate the undissolved particles. Before sample injection, measure the pH and K values of the sample. If the analyte is not distributed enough into the upper phase, add more retainer to the sample solution to increase the K value to the desired level (K > 3). This adjustment is necessary when the sample contains a large amount of salt that affects the pH and K value of the analyte.
3.4. Monitoring elution curve
For UV-absorbing analytes, one can monitor the effluent as in the case of the standard HSCCC method except that the attenuation must be adjusted for high absorbance of the effluent. For the analytes with no chromophore, an ELSD (evaporative light scattering detector) or a flow-through pH meter can be used to monitor the effluent [13].
3.5. Suggestions for method development
Since the procedure of pH-zone-refining CCC is quite different from that of the standard HSCCC technique, even an expert in the HSCCC technique might make a mistake in performing pH-zone-refining CCC separations. Several areas that often confuse the beginners in using pH-zone-refining CCC will be presented below.
3.5.1. Sample solution preparation
The method usually requires over 50–100 mg of each target component to form a stable pH-zone when using the standard procedure with 10–20 mM of retainer and eluter in a semi-preparative separation column (320 ml capacity). If such an amount of target compounds is not available, one can reduce the amount of retainer and eluter to increase the width of the pH zone relative to that of the mixing zone. As stated earlier, the length of the pH-zone is determined by the molar concentration of eluter (counterion). Also, if the sample contains a large amount of neutral compounds which do not alter their distribution pattern by the pH values of the solvent system, they will elute forming normal Gaussian distribution peaks, thus contaminating the pH zones of the analytes. In this case, the sample should be pre-purified to eliminate neutral impurities by the conventional acid–base partition technique using a separatory funnel [14].
3.5.2. Choice of retainer and eluter
As stated earlier, the retainer is usually an organic acid or an organic base, such as TFA and TEA. In a special case, an inorganic acid such as sulfuric acid can be used as a retainer with dodecylamine (a hydrophobic counterion) for separation of highly polar compounds such as those containing sulfonic acids [15]. In contrast, the eluter should be an inorganic acid such as HCl, or an organic base, such as NH3 which always remain in the mobile phase to serve as counterions of the target compound(s).
3.5.3. Elution mode
In the standard HSCCC, the column may be pre-equilibrated with the two phases before sample injection, i.e., the column is first filled with the stationary phase followed by elution with the mobile phase until the hydrodynamic condition between the two phases is established before the sample is charged. In pH-zone-refining CCC, however, the sample solution should be loaded immediately after filling the column with the stationary phase (sandwich method).
4. Application of pH-zone-refining CCC
4.1. Separation of fluorescein-type compounds
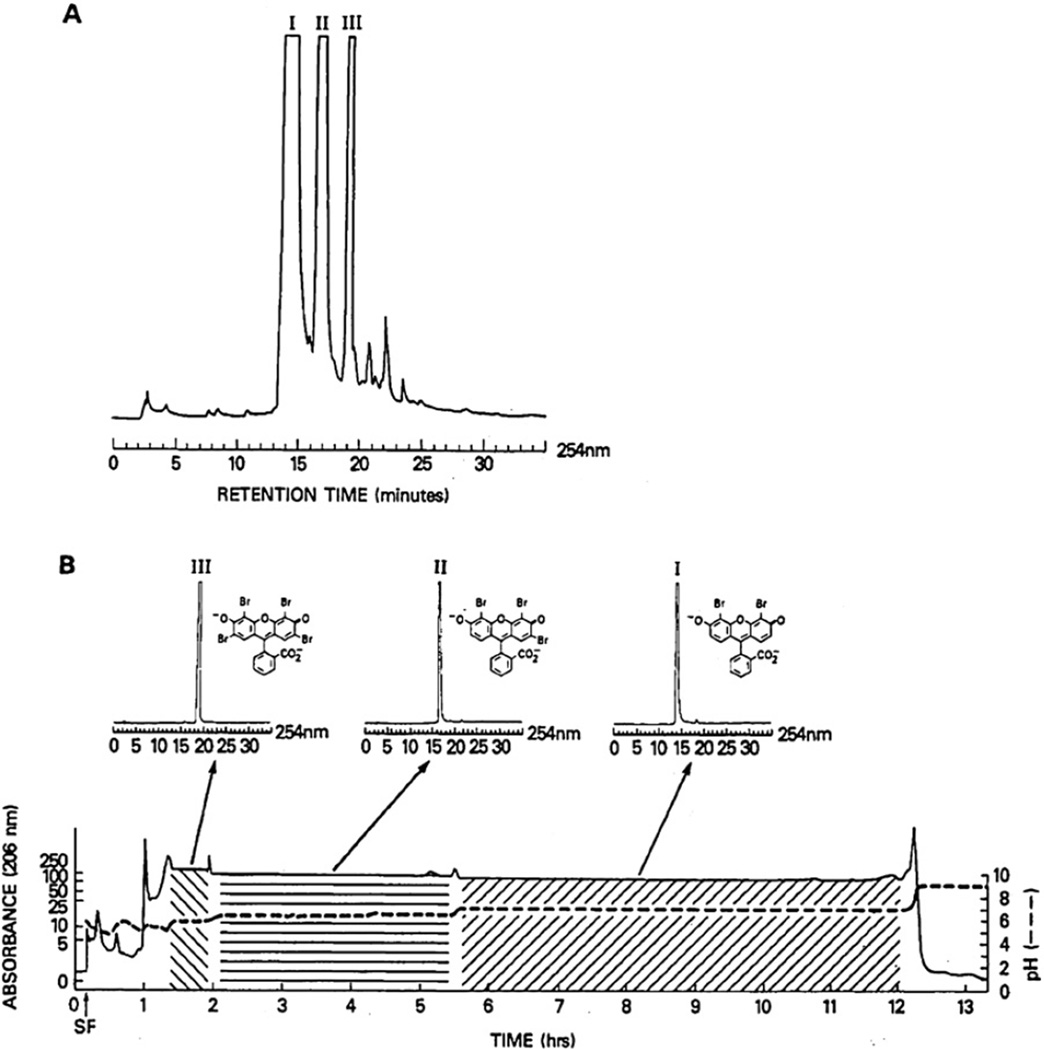
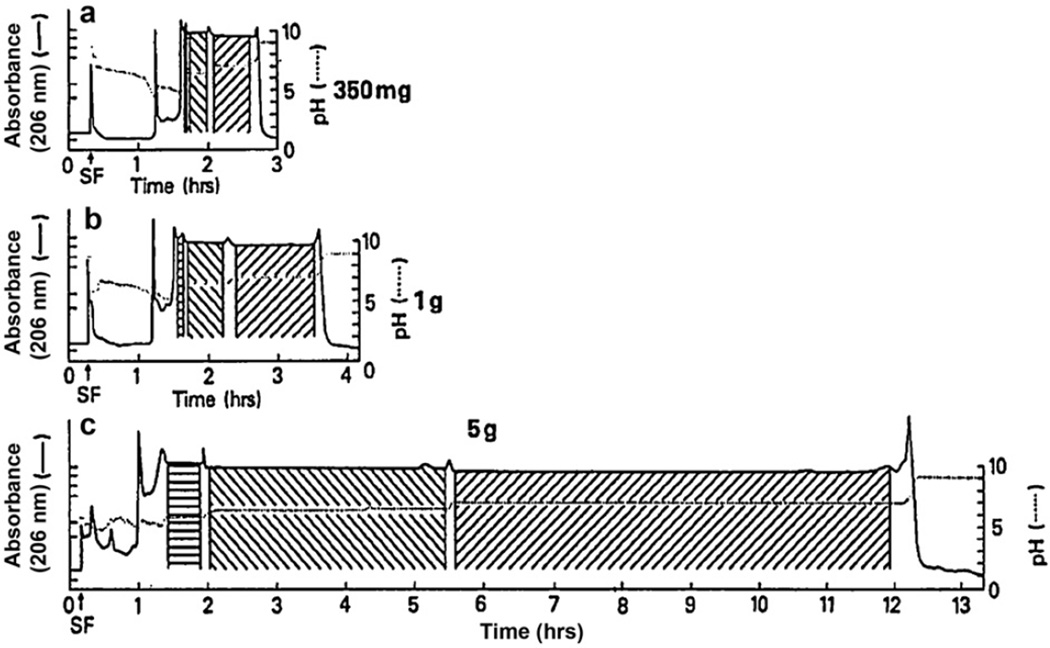
pH-zone-refining CCC was applied to the separation of multigram quantities of fluorescein dye mixtures [10,16]. Fig. 10 shows pH-zone-refining CCC separation of components of D&C Orange No. 5, a mixture of di-, tri, and tetrabromofluoresceins, with a two-phase solvent system composed of diethyl ether, acetonitrile and 0.01 M ammonium acetate at a volume ratio of 4:1:5. About 200 µl of TFA were added to the sample solution as a retainer. The resulting chromatogram shows a broad rectangular peak which is divided into three pH zones as indicated by the dotted line. Fractions from each pH zone revealed pure component as shown in the HPLC analysis. Fig. 11 shows the separation of the same sample with three different sample sizes, 350 mg, 1 g and 5 g. As clearly shown in these chromatograms, the width of the pH-zones that contain pure compound proportionally increases with the sample size, while the widths of the mixing zones between the pH-zones remain almost unaltered. This clearly indicates an important advantage of pH-zone-refining CCC that the yield of the target compound increases with the sample size. It should also be noted that the present method can separate a 10 fold sample size since the maximum sample size in this column for the standard separation is no more than 500 mg.
Fig. 10.
Separation of D&C Orange No. 5 by pH-zone-refining CCC. Experimental conditions: Apparatus: type-J coil planet centrifuge with a multilayer coiled column (1.6 mm ID and 320 ml capacity); solvent system: diethyl ether–acetonitrile–0.01 M aqueous ammonium acetate (pH 9 adjusted with ammonia) (4:1:5, v/v), mobile phase: lower aqueous phase; sample: 5 g of D&C Orange No. 5 dissolved in 80 ml of solvent (40 ml each phase); retainer: TFA 200 µl in the sample solution; flow rate: 3 ml/min; detection: 206 nm; revolution: 800 rpm.
Fig. 11.
pH-zone-refining CCC of D&C Orange No. 5 of three different sample sizes of 350 mg, 1 g and 5 g. The width of pure pH-zone of each component increases nearly proportional to the sample size while the width of the mixing zones remain the same, indicating an important advantage of pH-zone-refining CCC that the increased sample load improves the yield of pure fractions. Experimental conditions are described in Fig. 10 caption.
4.2. Separation of basic compounds
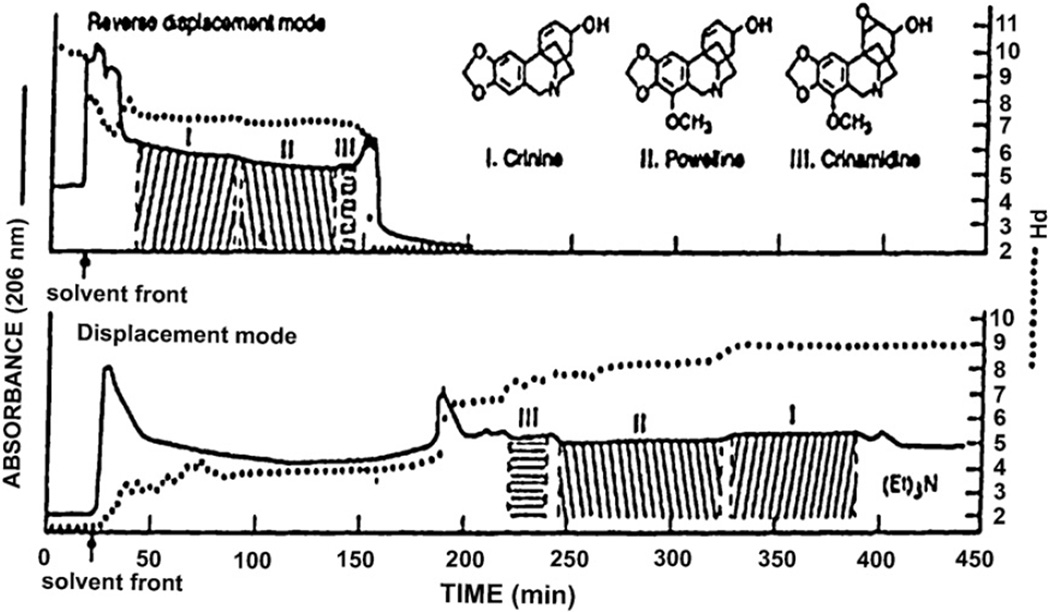
The present method can also be applied to the separation of basic compounds. In this case, an organic base such as TEA is used as a retainer and an inorganic acid such as hydrochloric acid is used as an eluter. In Fig. 12, three alkaloids from Crinum moorei (amaryllis family) were separated with a two-phase solvent system composed of MTBE, acetonitrile, and water at a 4:1:5 volume ratio in two different elution modes [17]. The upper chromatogram was obtained by eluting the lower phase as the mobile phase, and the lower chromatogram by eluting the upper phase as the mobile phase. In both methods, three components were well resolved. When the upper phase is used as the mobile phase, the alkaloid is collected in an organic phase which is easily evaporated. For an unstable alkaloid, however, the use of the lower mobile phase is preferred, because the alkaloid is eluted in a stable salt form.
Fig. 12.
Separations of a crude alkaloid extract of Crinum moorei obtained by pH-zone-refining CCC with two different elution modes. (A) Lower aqueous phase mobile and (B) upper organic phase mobile. Experimental conditions: Apparatus and column: see Fig. 10 caption; solvent system: methyl tert.-butyl ether–acetonitrile–water; stationary phase: (A) organic phase containing triethylamine at 15 mM and (B) aqueous phase containing HCl at 10 mM; mobile phase: (A) aqueous phase containing HCl at 5 mM and (B) organic phase containing triethylamine at 10 mM; flow rate: 3.3 ml/min; sample: 3 g dissolved in 30 ml of each phase; revolution: (A) 800 rpm (600 rpm until 66 ml of the mobile phase was eluted) and (B) 600 rpm throughout.
4.3. Separation of peptides
4.3.1. Separation of peptide derivatives
Peptides are easily separated if either terminal is blocked. Fig. 13 shows a chromatogram of a set of carbobenzyloxy(Z)-tripeptides each with a different terminal amino acid [18]. The separation was performed with a two-phase solvent system composed of MTBE, 1-butanol, acetonitrile and water at a volume ratio of 2:2:1:5. TFA was added to the organic stationary phase at 16 mM as a retainer, and ammonium hydroxide was added to the lower mobile phase at 2.7 mM as an eluter. The sample solution consisting of five components (each 100 mg) dissolved in 50 ml of solvent containing equal volumes of each phase. Under a flow rate of 3.3 ml/min and 800 rpm of column rotation, all five components were well resolved, as indicated by the K values shown in their pH-zones.
Fig. 13.
Separation of carbobenzoyloxy (Z)-tripeptides differing in the terminal amino-acid residues. Experimental conditions: Apparatus and column: see Fig. 10 caption; solvent system: methyl tert.-butyl ether–1-butanol–acetonitrile–water (2:2:1:5, v/v), 16 mM TFA in the organic stationary phase (pH 2.00), 2.7 mM NH3 in the aqueous mobile phase (pH 10.35); sample: 5 Z-tripeptides indicated in the chromatogram, each 100 mg dissolved in 50 ml of solvent (25 ml each phase); flow rate: 3.3 ml/min; elution mode: head to tail; detection: 206 nm; revolution: 800 rpm (600 rpm for first 66 ml elution); stationary phase retention: 59.4%.
4.3.2. Separation of free peptides
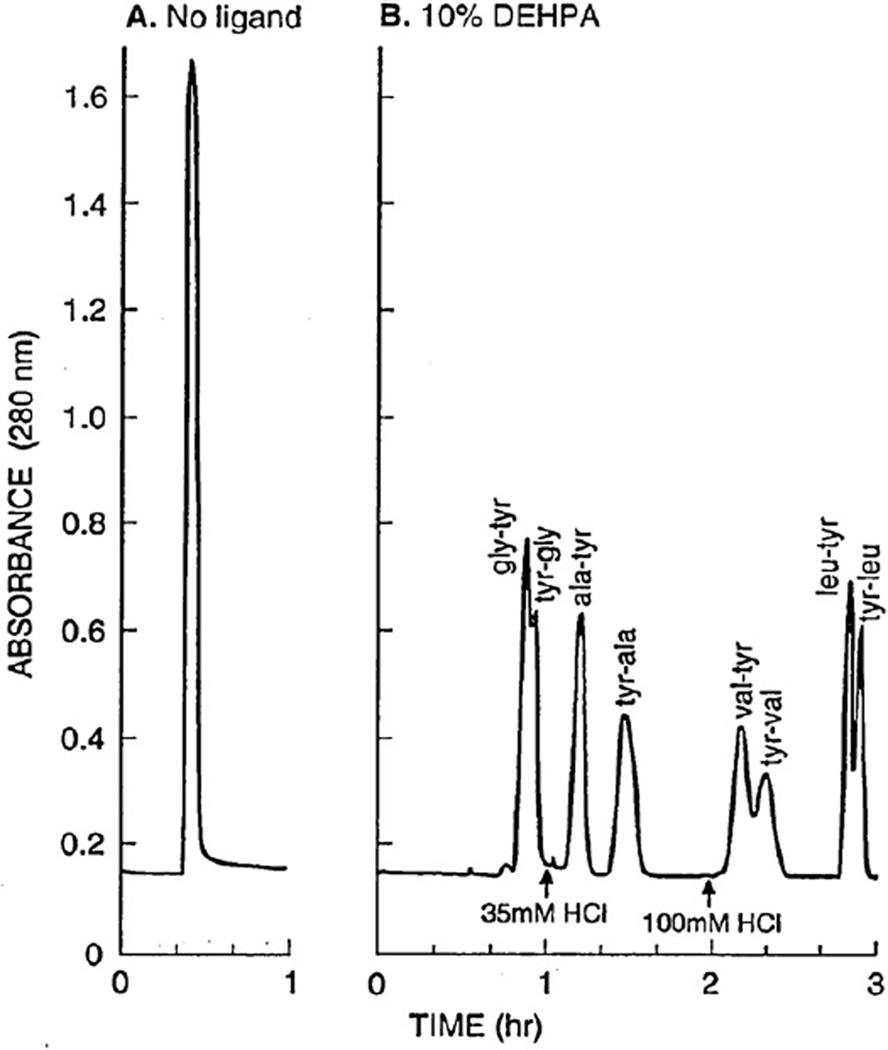
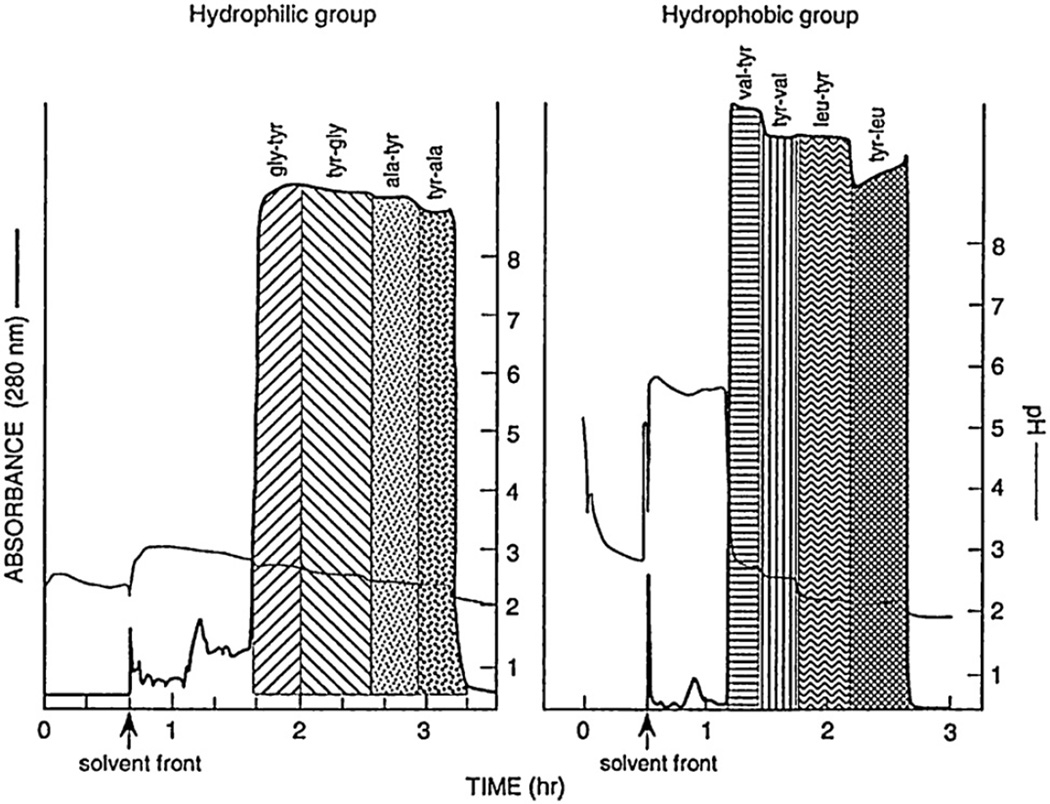
Zwitter-ions, like some peptides, are hard to separate using the standard HSCCC technique due to their high polarity. However, they can be easily resolved if a suitable ligand (hydrophobic counterion) is added to the stationary phase [19]. Fig. 14 shows the results of conventional CCC separations of four isomeric pairs of dipeptides using a two-phase solvent system composed of MTBE and 0.1 M monobasic potassium phosphate at a volume ratio of 1:1 with and without the ligand. The left chromatogram (A) obtained without the ligand shows a single peak at the solvent front without separation. The right chromatogram (B) was obtained by adding an affinity ligand, di-(2-ethylhexyl) phosphoric acid (DEHPA), at 10% (v/v) to the stationary phase. By eluting the acidified mobile phase with HCl, all components were well resolved. Using the same ligand, two sets of these four free dipeptides (total amount of 1 g in each set) were resolved by pH-zone-refining CCC as shown in Fig. 15. The left chromatogram is obtained from polar peptides with a two-phase solvent system composed of MTBE-acetonitrilewater (4:1:5, v/v), and the right chromatogram from hydrophobic peptides with a polar two-phase solvent system composed of MTBE–1-butanol–acetonitrile–water (2:2:1:5, v/v), each group containing two sets of isomers [20]. In both chromatograms, the thick line indicates the absorbance curve and the thin line indicates the pH values. The separation was performed using the lower phase as the mobile phase at a flow rate of 3 ml/min under 800 rpm.
Fig. 14.
Chromatograms of four isomeric pairs of dipeptides obtained by the standard HSCCC using ligand-free stationary phase (A) and an affinity ligand (DEHPA) in the stationary phase (B). Experimental conditions: Apparatus and column: see Fig. 10 caption; solvent system: methyl tert.-butyl ether–0.1 M KH2PO4 (1:1, v/v), (B) 10% DEHPA added to the organic stationary phase; elution: HCl at 0.035 M added stepwise to the mobile phase after 1 h and at 0.1 M after 2 h to shorten the separation time; flow rate: 3.3 ml/min; sample: 5 mg each of eight dipeptides indicated in the chromatogram; detection: 280 nm; revolution: 800 rpm.
Fig. 15.
Separations of dipeptides by pH-zone-refining CCC. Hydrophobic (right) and hydrophilic (left) groups of dipeptides each consisting of two isomeric pairs were separated under the optimized conditions. Experimental conditions: Apparatus and column: see Fig. 10 caption; solvent systems: (hydrophobic group) methyl tert.-butyl ether–acetonitrile–water (4:1:5, v/v), 20 mM triethylamine and 10% DEHPA in the organic stationary phase and 20 mM HCl in the aqueous mobile phase, (hydrophilic group) methyl tert.-butyl ether–1-butanol–acetonitrile–water (2:2:1:5, v/v), 20 mM triethyl amine and 30% DEHPA in the organic stationary phase and 20 mM HCl in the aqueous mobile phase; flow rate: 3 ml/min; elution mode: head to tail; sample: dipeptides indicated in the chromatogram, total amount of 1 g for each group; detection: 280 nm; revolution: 800 rpm.
4.4. Separation of polar alkaloids
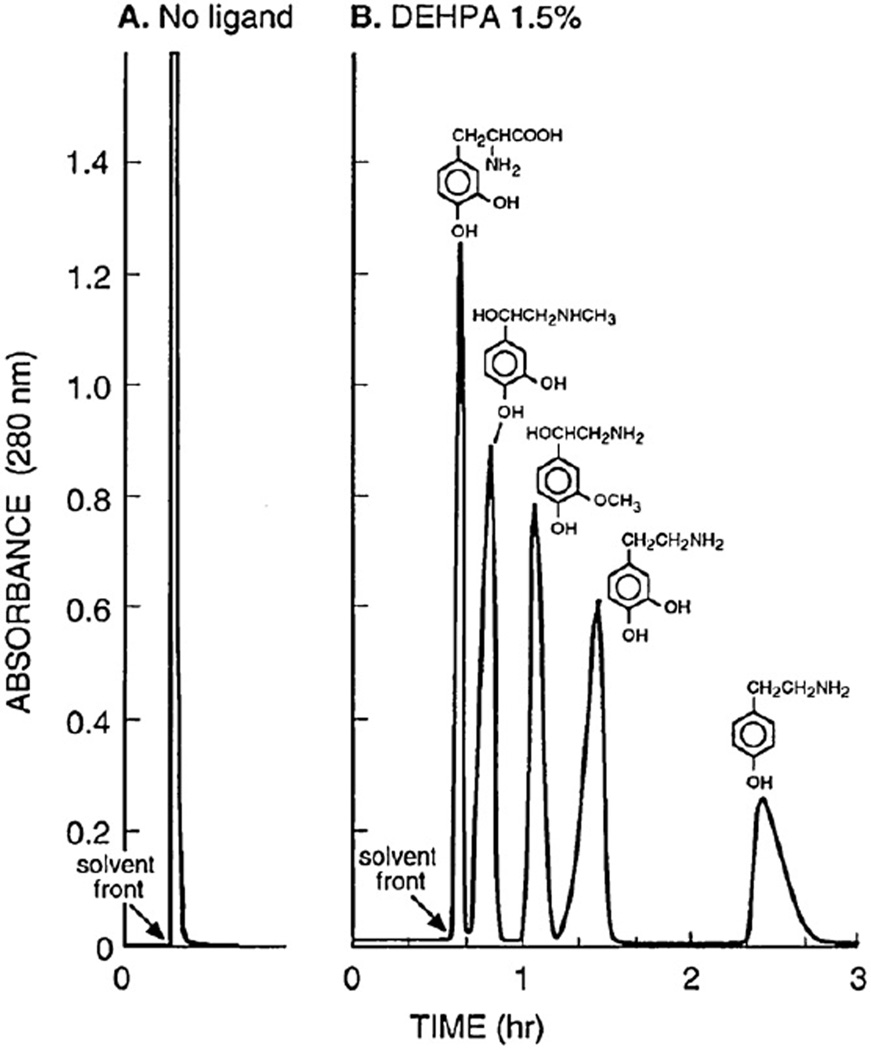
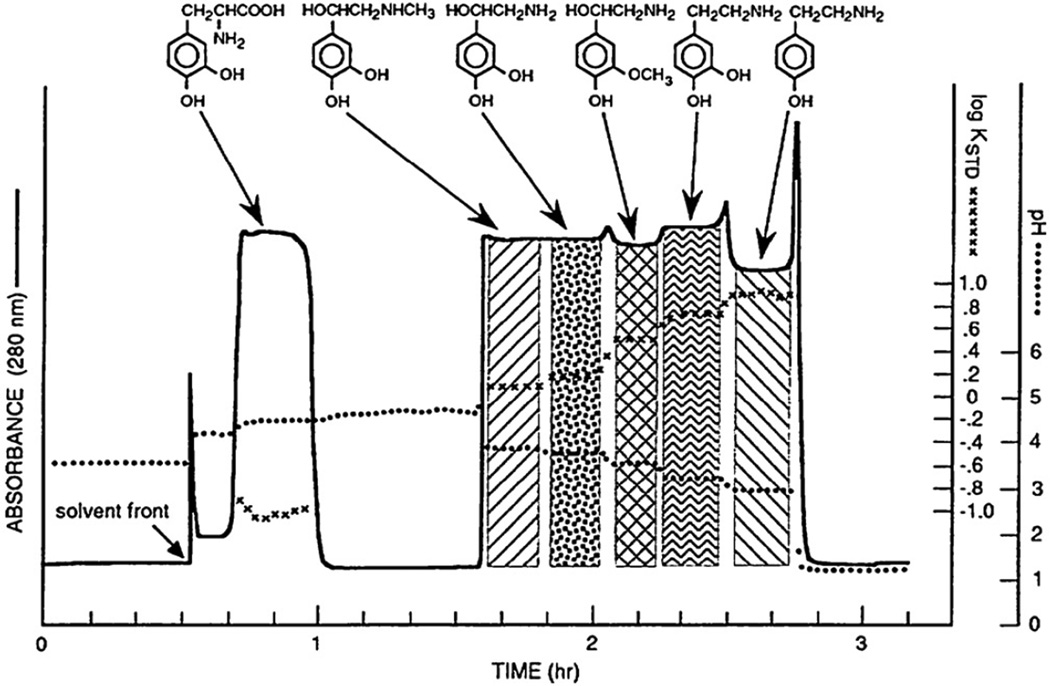
Catecholamines are very hydrophilic and mostly partition into the lower aqueous phase of conventional organic-aqueous twophase solvent systems. Here again, the use of a ligand is required for successful separation [11,19,21]. Fig. 16 shows chromatograms obtained from 4 catecholamines and one related compound (each 5 mg) by standard HSCCC with a two-phase solvent system composed of MTBE–water where 0.1 M of ammonium acetate is added to the upper organic phase and 0.05 M HCl to the lower aqueous phase. The left chromatogram (A) was obtained without the ligand, and all components were eluted near the solvent front as a single peak. The right chromatogram (B) was obtained by adding a ligand DEHPA to the stationary phase and all components were well resolved. The separations were performed at a flow rate of 3.3 ml/min under 800 rpm. Fig. 17 shows pH-zone-refining CCC of the similar set of catecholamines, each 500 mg, using the same ligand in the stationary phase under otherwise identical experimental conditions [21]. All components were well resolved within 3 h.
Fig. 16.
Separations of four catecholamines and one related compound by the affinity HSCCC without (A) and with 1.5% DEHPA in the organic stationary phase (B). Experimental conditions: Apparatus and column: see Fig. 10 caption; solvent system: methyl tert.-butyl ether–water, ammonium acetate (0.1 M) in the organic stationary phase and HCl (0.05 M) in the aqueous mobile phase (A) and 1.5% DEHPA added to the organic stationary phase (B); sample: 5 mg each of three catecholamines and two related compounds indicated in the chromatogram; flow rate: 3.3 ml/min; elution mode: head to tail; detection: 280 nm; revolution: 800 rpm.
Fig. 17.
Separation of catecholamines and related compounds by pH-zone-refining CCC using a ligand in the stationary phase. Experimental conditions: Apparatus and column: see Fig. 10 caption; solvent system: methyl tert.-butyl ether–water, 200 mM ammonium acetate and 20% (v/v) DEHPA in the organic stationary phase and 50 mM HCl in the aqueous mobile phase; sample: 6 analytes indicated in the chromatogram, each 500 mg dissolved in 40 ml of aqueous phase to which 4 ml of conc. HCl is added; flow rate: 3.3 ml/min; elution mode: head to tail; detection: 280 nm; revolution 800 rpm.
4.5. Separation of highly-polar sulfonic acid-containing compounds
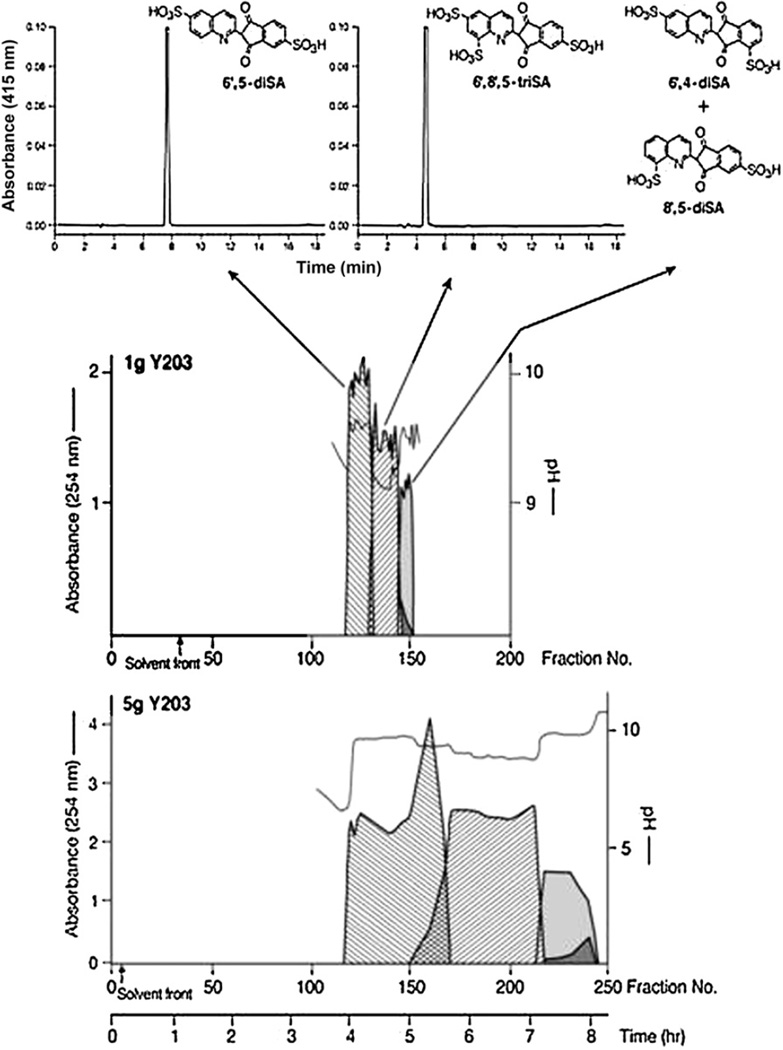
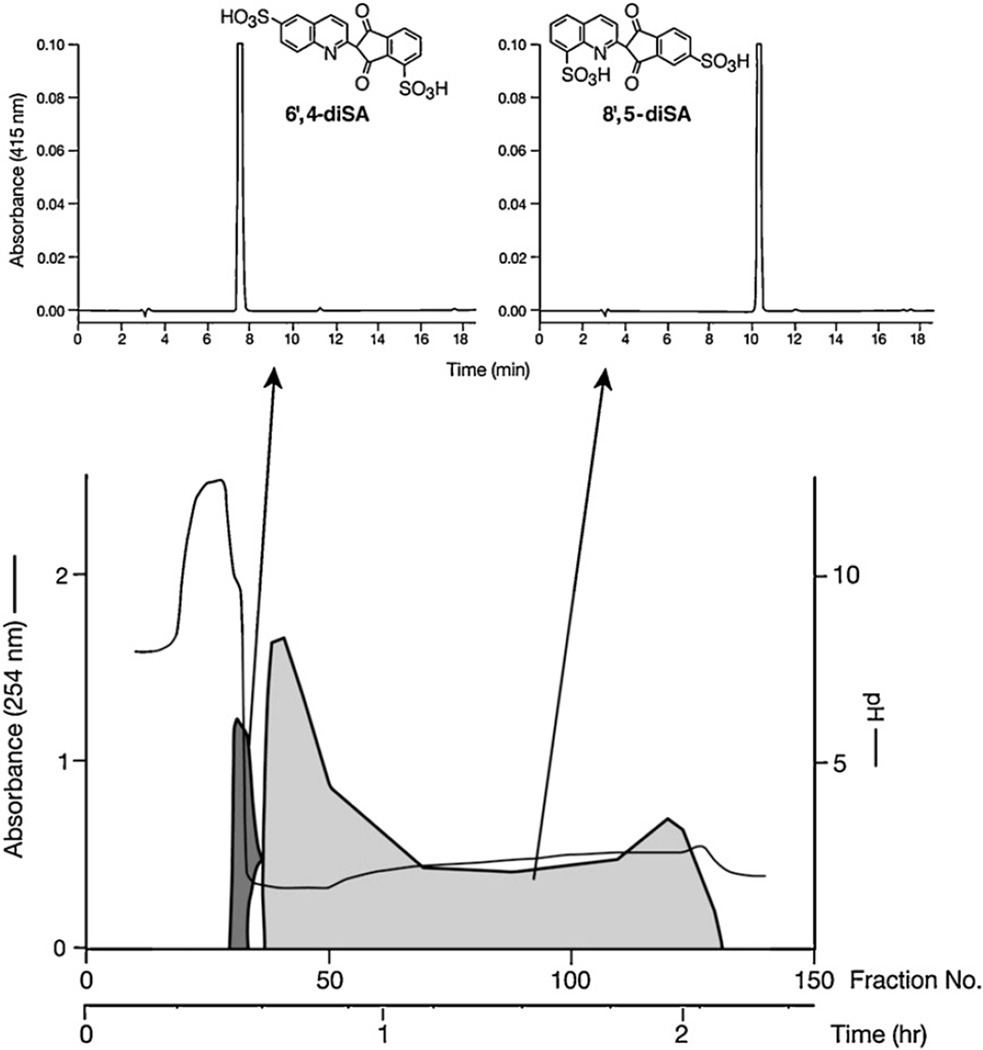
Separation of highly-polar sulfonated dyes is not possible by using standard pH-zone-refining CCC because of their partitioning solely into the aqueous phase of a conventional two-phase solvent system. The addition of an affinity ligand (a hydrophobic counterion), either an ion-exchange reagent (e.g., dodecylamine) or an ion-pairing reagent (tetrabutylammonium hydroxide), and a retainer acid (e.g., HCl, H2SO4) enable partition of the sulfonated dye components into the organic stationary phase and separation by pH-zone-refining CCC. Figure 18 shows the separation by affinity-ligand pH-zone-refining CCC in the ion-exchange mode (addition of 5% dodecylamine) of the two isomeric monosulfonated components from a 1.8 g portion of the color additive D&C Yellow No. 10 (Quinoline Yellow, CI 47005) [22]. Complementary use of ligands is sometimes beneficial in separations by affinityligand pH-zone-refining CCC. Figure 19 shows the separation of highly-polar closely-related di- and trisulfonated positional isomers from a 5 g portion of the Japanese version of Quinoline Yellow. The separation was achieved by using a higher concentration of ion-exchange reagent, 20% dodecylamine, in the stationary phase than was used for the separation of the monosulfonated isomers, taking advantage of the Archimedean screw effect, and using complementarily an ion-pairing reagent as the ligand [23]. The separation of trisulfonated pyrenes was also achieved by adding a hydrophobic counterion (20% dodecylamine) and H2SO4 (0.5%) in the stationary phase [15].
Fig. 18.
Separation of highly polar sulfonic acids-containing compounds. Reconstructed pH-zone-refining CCC elution profile of 1 and 5 g sample portion of Yellow No. 203 by affinity ligand CCC in the ion exchange mode.
Fig. 19.
Separation of polar sulfonic acids-containing compounds. Reconstructed pH-zone-refining CCC elution profile of the separation by affinity ligand pH-zone-refining CCC in the ion-pairing mode of the two components (0.55 g mixture) of the Yellow No. 203 that elute together in the separation shown in Figure 18.
4.6. Separation of enantiomers
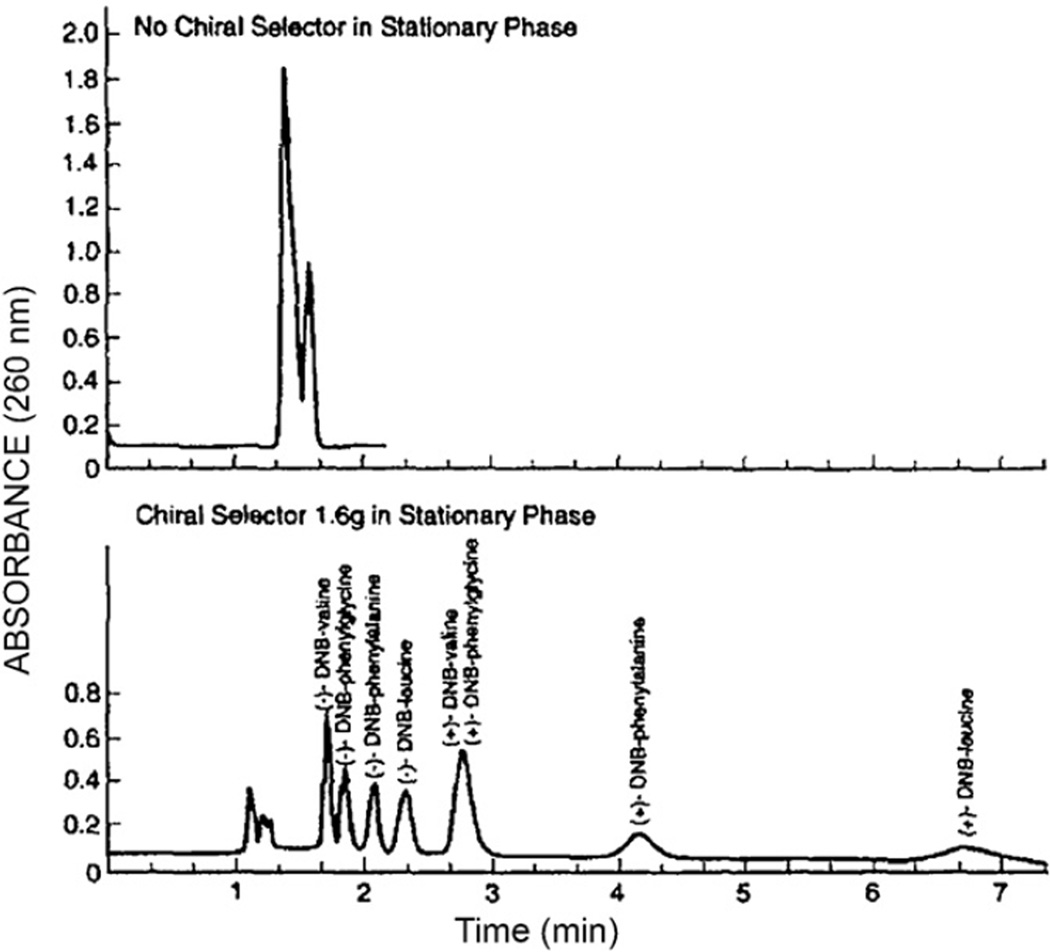
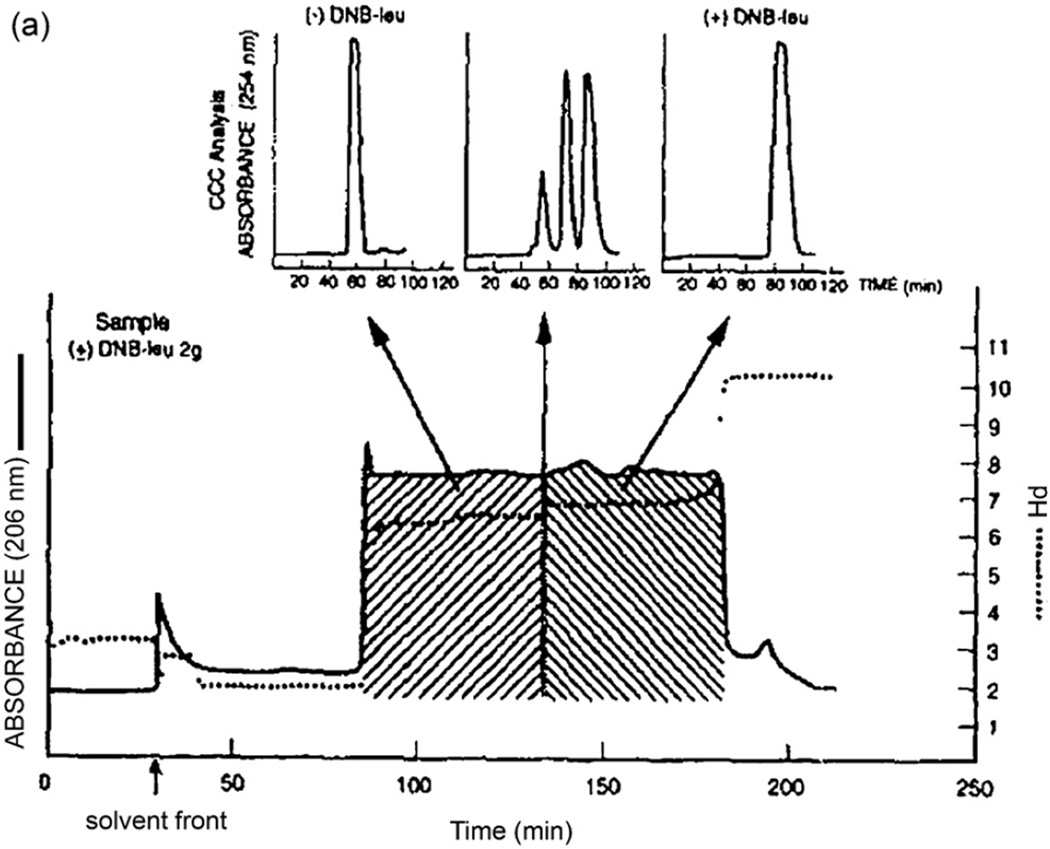
Enantiomers are separated by HSCCC using a suitable chiral selector in the stationary phase [24]. Chromatograms in Fig. 20 were obtained from a set of DNB (dinitrobenzoyl) amino acids and dipeptides each with paired optical isomers. The upper chromatogram obtained without the chiral selector shows only two poorly-resolved peaks eluted near the solvent front. The separation was performed with a two-phase solvent system composed of n-hexane–ethyl acetate–methanol–water (8:2:5:5, v/v) using the lower phase as the mobile phase at a flow rate of 1 ml/min Fig. 21 shows pH-zone-refining CCC of DNB-leucine enantiomers using the above chiral selector (1.6 g) in the stationary phase where 2 g of the racemic mixture were well resolved with minimum overlapping as shown by analytical CCC and the pH curve.
Fig. 20.
Separations of four pairs of (±)-DNB-amino acids by the standard analytical HSCCC technique with and without chiral selector in the stationary phase. Upper diagram was obtained using a chiral–selector-free stationary phase and the lower chromatogram using a stationary phase containing 1 g of chiral selector DPA (N-dodecanoyl-l-proline-3,5-dimethylanilide). Experimental conditions: Apparatus and column: analytical HSCCC centrifuge with a set of three multilayer coils each consisting of eleven layers of 0.85 mm ID PTFE tubing with a total capacity of ca. 60 ml; solvent system: hexane–ethylacetate–methanol–10 mM HCl (8:2:5:5, v/v) without chiral selector (upper chromatogram) and with DPA 1.6 g dissolved in 30 ml of the stationary phase (lower chromatogram); flow rate: 1 ml/min; elution mode: head to tail; sample: 10 mg each of (±)-DNB-amino acids indicated in the chromatogram dissolved in 2 ml of solvent (1 ml each phase); detection: 280 nm; revolution: 1000 rpm; (ca. 84 × g).
Fig. 21.
Chiral separation of (±)-DNB-leucine by pH-zone-refining CCC using DPA as a chiral selector. Experimental conditions: Apparatus and column: see Fig. 10 caption; solvent system: methyl tert.-butyl ether–acetonitrile–water (4:1:5 v/v), TFA (40 mM) + DPA (40 mM) in the organic stationary phase and NH3 (20 mM) in the aqueous mobile phase; sample: (±)-DNB-leucine 2 g; flow rate: 1 ml/min; elution mode: head to tail; detection: 206 nm; revolution: 800 rpm. The associated analytical HSCCC analyses were carried out using the same column that was used for the standard CCC technique under the following experimental conditions: solvent system: hexane–ethyl acetate–methanol–10 mM HCl (8:2:5:5, v/v), organic stationary phase containing DPA (20 mM); flow rate; 1 ml/min; elution mode: head to tail; revolution: 800 rpm.
5. Updated references of research articles on pH-zone-refining CCC
Table 1 lists over 70 research articles published since 1994 on pH-zone-refining CCC as applied to the separations of natural and synthetic products. The table is organized by the type of compounds separated and provides the sample, the solvent system, the retainer and eluter used in each study listed.
Table 1.
Samples and experimental conditions for separations by pH-zone-refining CCC, as reported since 1994.
| Samplea (mass) | Solvent systemsb (volume ratio) | Key reagentc |
Referencesd vol. (year) page | |
|---|---|---|---|---|
| Retainer in SP | Eluter in MP | |||
| Amino acids and peptides | ||||
| DNP-amino acids (0.3 g) | MTBE–AcN–H2O (4:1:5) | TFA (0.04%/UP) | NH3 (0.1%/LP) | JACS 116 (1994) 704 |
| DNP-amino acids (0.7 g | MTBE–H2O | NH3 (22 mM/LP) | TFA (5–20 mM/UP) | JCA 672 (1994) 101 |
| DNP-amino acids (1 g) | MTBE–AcN–H2O (4:1:5) | TFA (200 µl/SS) | NH3 (0.1%/LP) | Mono 1/Ch. 14 (1995) 154 |
| Amino acid-OBzl (0.7 g) | MTBE–H2O | TEA (2.5–40 mM/UP) | HCl (5–40 mM/LP) | JCA 678 (1994) 233 |
| Proline-OBzl (1 g) | MTBE–H2O | TEA (10 mM/UP) | HCl (10 mM/LP) | Mono 1/Ch. 14 (1995) 154 |
| N-CBZ-dipeptides (0.8 g) | MTBE–AcN–H2O (2:2:3) | TFA (16 mM/UP) | NH3 (5.5 mM/LP) | JCA 702 (1995) 197 |
| N-CBZ-tripeptides (0.5 g) | MTBE–AcN–1-BuOH–H2O (2:2:1:5) | TFA (16 mM/UP) | NH3 (2.7 mM/LP) | JCA 702 (1995) 197 |
| Dipeptide-β NA (0.3 g) | MTBE–AcN–H2O (2:2:3) | TEA (5 mM/UP) | HCl (5 mM/LP) | JCA 702 (1995) 197 |
| Dipeptide (2 g) | MTBE–AcN–H2O (4:1:5) | TFA (20 mM/UP)+DEHPA (30–40%/UP) |
HCl (20 mM/LP) | JCA 771 (1997) 81 |
| Bacitracin (5 g) | MTBE–AcN–H2O (4:1:5) | TFA (40 mM/UP) | HCl (20 mM/LP) | JCA 771 (1997) 81 |
| Bovine insulin (0.2 g) | MTBE–H2O | TFA (0.04%/UP) | NH3 (0.1%/LP) | Mono 1/Ch. 14 (1995) 154 |
| Alkaloids | ||||
| Crinine, powelline and | MTBE–H2O | TEA (5 mM/UP) | HCl (5 mM/LP) | JCA 685 (1994) 259 |
| crinamidine (3 g) | MTBE–H2O | HCl (10 mM/LP) | TEA (10 mM/UP) | JCA 685 (1994) 259 |
| Matrin and sophocarpine (2 g) | MTBE–H2O | TEA (10 mM/UP) | HCl (5–10 mM/LP) | JCA 822 (1998) 316 |
| Lappaconitine (10.5 g) | MTBE–THF–H2O (2:2:3) | TEA (10 mM/UP) | HCl (10 mM/LP) | JCA 923 (2001) 281 |
| Vincine and vincamine (0.3 g) | MTBE–H2O | TEA (5 mM/UP) | HCl (5 mM/LP) | JCA 753 (1996) 1 |
| Catecholamines (3 g) | MTBE–H2O | NH4OAc (200 mM/UP)+DEHPA (20%/UP) |
HCl (50 mM/LP) | JCA 724 (1996) 348 |
| Solamargine and solasonine (1 g) | EtOAc–BuOH–H2O (1:4:5) | TEA (5 mM/UP) | TFA (10 mM/LP) | J. Sep. Sci. 32 (2009) 3216 |
| Liensinine, isoliensinine and neferine (2.5 g) | MTBE–H2O | TEA (10 mM/UP) | HCl (5 mM/LP) | J. Sep. Sci .33 (2010) 539 |
| Fangchionoline and tetrandrine (3.5 g) | PE–EtOAc–MeOH–H2O (5:5:1:9) | TEA (10 mM/UP) | HCl (5 mM/LP) | Chromatographia 69 (2009) 959 |
| Sinoacutine (2 g) | Hex–EtOAc–MeOH–H2O (3:7:1:9) | TEA (10 mM/UP) | HCl (5 mM/LP) | JCB ATBLS 879 (2011) 945 |
| N-demethylarmepavine, nucifereine and roemerine (500 mg) | Hex–EtOAc–MeOH–H2O (1:6:1:6) | TEA (10 mM/UP) | HCl (5 mM/LP) | Molecules 16 (2011) 2551 |
| Alstonine, akuammigine, akuammine, picraline, akuammicine and picratidine (500 mg) | MTBE–AcN–H2O (2:2:3) | TEA (pH 10.7/UP) | HCl (pH 1.7/LP) | JLCRT 28 (2005) 775 |
| Caffeine and theophyline (3 g) | MtBE–H2O | TEA (10 mM/UP) | HCl (10 mM/LP) | JLCRT 27 (2004) 365 |
| Berberine, β-hydrodtine canadaline, canaline and isocorypalmine (1.6–2 g) | CHCl3/H2O | HCl (2–25 mM/UP) | TFA (0.05–0.3%/LP) | JJLCRT 24 (2001) 2445 |
| Protopine, corydine, isocorydine and graucine (1 g) | PE–EtOAc–MeOH–H2O (3:7:1:9) | TEA (20 mM/UP) | HCl (5 mM/LP) | JBC 879 (2011) 3767 |
| N-nornuciferine, nuciferine and roemerine (4 g) | PE–EtOAc–MeOH–H2O (5:5:2:8) | TEA (10 mM/UP) | HCl (5 mM/LP) | JCB 878 (2010) 1647 |
| Sicordine, cordine, tetrahydropalmatine, N-methylasimilobine and anonine (1.4 g) | MTBE–AcN–H2O (2:2:3) | TEA (10 mM/UP) | HCl (5 mM/LP) | JCB 878 (2010) 1881 |
| Sinoacutine (2 g) | Hex–EtOAc–MeOH–H2O (3:7:1:9) | TEA (10 mM/UP) | HCl (5 mM/LP) | JCB 879 (2010) 945 |
| Gelsemine, koumine, gelsevirine (1.5 g) | MTBE–AcN–H2O (3:1.5:4) | TEA (20 mM/UP) | HCl (5 mM/LP) | JCA 1218 (2011) 3695 |
| Protopine, tetrahydropalmatine and bicucultine (3.1 g) | MTBE–AcN–H2O (2:2:3) | TEA (5–10 mM/UP) | HCl (5–10 mM/LP) | JCA 1115 (2006) 267 |
| Catharantine, vindorine, vindorinine and vincrystaline (7 g) | MTBE–AcN–H2O (4:1:5) | TEA (10 mM/UP) | HCl (10 mM/LP) | JA 849 (1999) 421 |
| Dyes | ||||
| D&C Orange No. 5 (5 g) | DEE–AcN–10 mM NH4OAc (4:1:5) | TFA (0.2 ml/SS) | NH3 (LP/pH 9) | JACS 116 (1994) 704 |
| FD&C Red No. 3 (3 g) | DEE–AcN–10 mM NH4OAc (4:1:5) | TFA (0.4 ml/500 ml UP) | NH3 (LP/pH 7.5) | JCA 658 (1994) 505 |
| D&C Red No. 28 (3 g) | DEE–AcN–10 mM NH4OAc (4:1:5) | TFA (0.6 ml/500 ml UP | NH3 (LP/pH 8.1) | JCA 678 (1994) 77 |
| D&C Red No. 28 (6 g) | DEE–AcN–10 mM NH4OAc (4:1:5) | TFA (1.2 ml/SS) | NH3 (LP/pH 9.2) | JCA 678 (1994) 77 |
| D&C Red No. 22 (5 g) | DEE–AcN–10 mM NH4OAc (4:1:5) | TFA (0.8 ml/500 ml UP) | (0.01%/LP) | Mono 2/Ch. 12 (1996) 337 |
| TCF (1 g) | DEE–AcN–10 mM NH4OAc (4:1:5) | TFA (0.25 ml/SS) | NH3 (LP/pH 9.3) | Mono 1/Ch. 16 (1995) 203 |
| TCF (5 g) | MTBE–AcN–H2O (4:1:5) | TFA (0.2 ml/500 ml UP) | NH3 (LP/pH 10.7) | Mono 1/Ch. 16 (1995) 203 |
| Brominated TCF (5 g) | DEE–AcN–H2O (4:1:5) | TFA (24.7 mM/UP) | NaOH (65 mM/LP) | JCA 732 (1996) 283 |
| Rose bengal (1.5 g) | DEE–AcN–H2O (4:1:5) | TFA (5 mM/UP) | NH3 (19.8 mM/LP) | Mono 2/Ch. 12 (1996) 337 |
| Yellow No. 203 (5 g) | isoAmOH–MTBE–AcN–H2O (3:5:1:7) | DA (20%/UP) + H2SO4 (40 mM/SS) |
NH3 (163 mM/LP) | EncSS 6 (2000) 2588 |
| D&C Yellow No. 10 (1.6 g) | isoAmOH–MTBE–AcN–H2O (3:1:1:5) | DA (275 mM/UP) + H2SO4 (38 mM/UP) |
NH3 (80 mM/LP) | JCA 923 (2001) 87 |
| Red No. 106 (0.3 g) | 1-BuOH–H2O | H2SO4 (40 mM/UP) | NH3 (30 mM/LP) | JCA 946 (2002) 157 |
| FD&C Yellow No. 6 (2 g) | MTBE–AcN–H2O (4:1:5) | H2SO4 (0.2%/UP) + TDA (5%/UP) |
NH3 (0.4%/LP) | JCA 753 (1996) 1 |
| Quinoline Yellow (1 g) | isoAmOH–MTBE–AcN–H2O (3:5:1:7) | H2SO4 (18 mmol/SS) + DA (20% in UP) |
NH3 (113 mM/LP) | JCA 1216 (2009) 4161 |
| Quinoline Yellow (5 g) | isoAmOH–MTBE–AcN–H2O (3:5:1:7) | H2SO4 (40 mmol/SS) + DA (20%/UP) |
NH3 (163 mM/LP) | JCA 1216 (2009) 4161 |
| D&C Green No. 8 (20 g) | 1-BuOH–H2O | H2SO4 (0.5%) + DA (20%/UP) |
NaOH (0.1 M/LP) | JCA 1218 (2011) 8249 |
| Tetrachlorofluorecein (5 g) | MTBE–AcN–H2O (4:1:5) | TFA (5.4 mM/UP) | NH3 (15.5 mM/LP) | JLCRT 21 (1998) 183 |
| Isomers | ||||
| MMCCA (0.4 g) | Hex–EtOAc–MeOH–H2O (1:1:1:1) | TFA (1.3 mM/UP) + octanoic acid (3.4 mM/UP) |
NH3 (3.4 mM/LP) | JCA 685 (1994) 253 |
| NCMBA (10 g) | MTBE–AcN–H2O (4:1:5) | TFA (12 mM/UP) | NH3 (100 mM/LP) | JLCRT 21 (1998) 195 |
| NACBA (15 g) | MTBE–AcN–H2O (4:1:5) | TFA (0.32%/UP) | NH3 (0.8%/LP) | JLC 17 (1994) 3507 |
| (±)-DNB-leucine (2 g) | MTBE–H2O | TFA (40 mM/UP) + DPA (40 mM/UP) |
NH3 (20 mM/LP) | JCA 704 (1995) 75 |
| (±)-DNB-valine (2 g) | MTBE–H2O | TFA (40 mM/UP) + DPA (40 mM/UP) |
NH3 (20 mM/LP) | JCA 753 (1996) 1 |
| 3- and 4-Sulfophthalic acids (10 g) | 1-BuOH–H2O | HCl (488 mM/UP) | NH3 (105 mM/LP) | JCA 966 (2002) 111 |
| Caffeoylquinic acids (2 g) | MTBE–AcN–H2O (2:2:3) | TFA (10 mM/UP) | NH3 (8 mM/LP) | JCA 1212 (2008) 48 |
| Dicarboxylic acids (466 mg) | MTBE–AcN–H2O (4:1:5) | TFA (10.8 mM/UP) | NH3 (20.2 mM/LP) | JCA 1151 (2007) 82 |
| Polyphenols | ||||
| NDGA (20 g) | MTBE–H2O | TFA (25 mM/UP) | NaOH (100 mM/LP) | JLCRT 21 (1998) 171 |
| Curcumin (20 g) | MTBE–AcN–H2O (4:1:5) | TFA (20 mM/UP) | NaOH (30 mM/LP) | JLCRT 23 (2000) 2209 |
| Salvanolic acids (2 g) | MTBE–H2O | TFA (10 mM/UP) | NH3 (10 mM/LP) | J. Sep. Sci. 30 (2007) 3214 |
| Cichoric acid (3 g) | MTBE–AcN–H2O (4:1:5) | TFA (10 mM/UP) | NH3 (10 mM/LP) | JCA 1103 (2006) 166 |
| Miscellaneous | ||||
| Hydroxyanthraquinones (1.5 g) | MTBE–THF–H2O (2:2:3) | TFA (10 mM/UP) | NH3 (10 mM/LP) | JCA 1176 (2007) 163 |
| Polyketides (1.68 g) | MiBK–AcN–H2O (4:1:5) | TFA (10 mM/UP) | NaOH (10 mM/LP) | JLCRT 24 (2001) 1775 |
| Coumarin (0.3 g) | MTBE–H2O | TFA (10 mM/UP) | NH3 (20 mM/LP) | JCA 759 (1997) 47 |
| Indole auxins (0.8 g) | MTBE–H2O | TFA (0.04%/UP) | NH3 (0.05%/LP) | JCA 753 (1996) 1 |
| Fucans (0.8 g) | 10% LA in MiBK–25 mM NaOH | JCB 706 (1998) 43 | ||
| Tetrachlorobenzoic acid (1 g) | Hex–EtOAc–MeOH–H2O (6:4:5:5) | TFA (10 mM/UP) | NH3 (10 mM/LP) | JCA (in press) |
DNP: dinitrophenyl; CBZ: carbobenzoxy; βNA: naphthylamine; TCF: tetrachlorofluorescein; MMCCA: 1-methyl-4-methoxymethyl cyclohexane carboxylic acid; NCMBA: 2- and 6-nitro-4-chloro-3-methoxybenzoic acid; NACBA: 2- and 6-nitro-3-acetamido-4-chlorobenzoic acid; DNB: dinitrobenzoyl; NDGA: nordihydroguaiaretic acid.
MTBE: methyl tert.-butyl ether; AcN: acetonitrile; BuOH: butanol; THF: tetrahydrofuran; DEE: diethyl ether; NH4OAc: ammonium acetate; AmOH: amyl alcohol; Hex: hexane; EtOAc: ethyl acetate; MeOH: methanol; MiBK: methyl isobutyl ketone; LA: liquid amberlite; PE: petroleum-ether.
SP: stationary phase; MP: mobile phase; UP: upper phase; LP: lower phase: SS: sample solution; TFA: tetrafluoroacetic acid; TEA: triethylamine; DEHPA: di(2-ethylhexyl)phosphoric acid; DA: dodecylamine; EtOAc: ethyl acetate; TDA: tridodecylamine; DPA: N-dodecanoyl-l-proline-3,5-dimethylanilide (chiral selector).
JACS: Journal of American Chemical Society; EncSS: Encyclopedia of Separation Science, 2000 (Editors: I.D. Wilson, E.R. Adlard, M. Cooke, C.F. Poole) Academic Press; JCA: Journal of Chromatography; JLC: Journal of Liquid Chromatography; JLCRT: Journal of Liquid Chromatography and Related Technologies; Mono 1: ACS Monograph on Modern Counter-current Chromatography, 1995 (Editors: W.D. Conway and R.J. Petroski) (Ref. [4]); Mono 2: High-Speed Countercurrent Chromatography, 1996 (Editors: Y. Ito and W.D. Conway) Wiley (Ref. [3]).
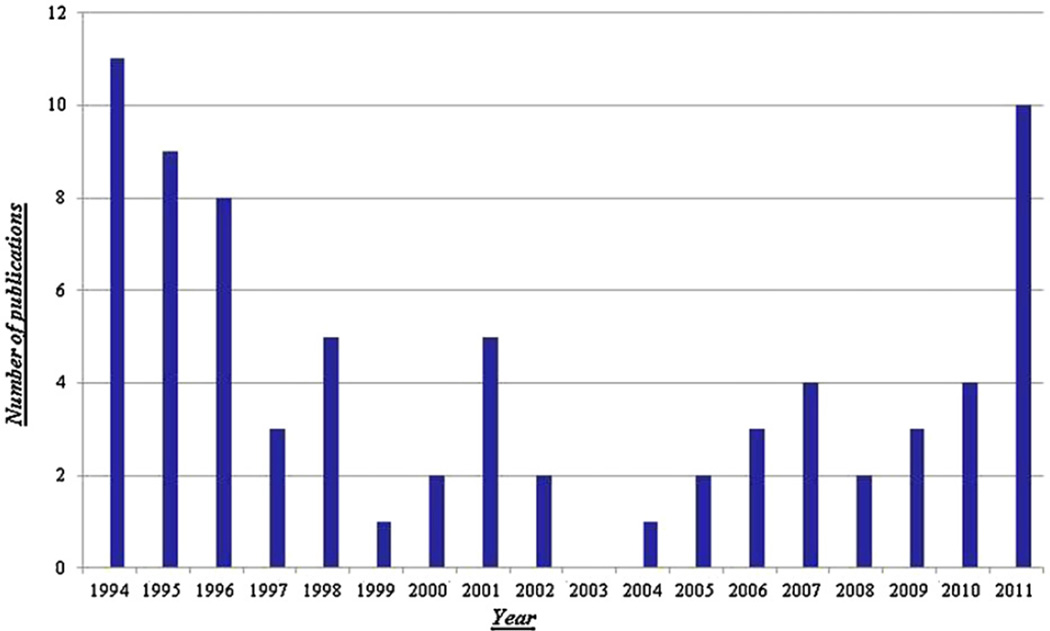
Fig. 22 shows a bar graph representing the yearly number of published research papers on pH-zone-refining CCC since 1994. The greatest number of papers was at the early stage, between 1994 and 1995, due to extensive research on separations of DNP-amino acid derivatives and dyes. After 1997, the output declined to a minimum in 2003 followed by a gradual increase in the number of publications due to increased applications to the natural products especially alkaloids. It is expected that the number of papers will steadily increase due to the novel applications to the separation of phenolic compounds such as flavonoids, lignans and polyphenols using NaOH or Na2CO3 as the eluter.
Fig. 22.
Annual number of research publications on pH-zone-refining CCC.
6. Conclusions (advantages of pH-zone-refining CCC)
As described in this paper, pH-zone-refining CCC has several important advantages over conventional HSCCC:
The sample loading capacity is increased over 10 times.
Fractions are highly concentrated near saturation level.
Yield is improved by increasing sample size.
Minute charged compounds are concentrated and detected at the peak boundaries.
Elution peaks of compounds with no chromophore can be monitored with a pH flow meter.
Since the introduction of pH-zone-refining CCC in 1994, over 70 research papers have been published. The papers presented at the 7th International Conference on Countercurrent Chromatography (CCC2012) held in Hangzhou, China indicate that the application of the method will be further extended to the separation of weaklyanionic compounds such as flavonoids, lignans and polyphenols, using with Na2CO3 and NaOH as an eluter.
Footnotes
Presented at the 7th International Conference on Countercurrent Chromatography, Hangzhou, China, 6–8 August 2012.
References
- 1.Ito Y. In: Countercurrent Chromatography: Theory and Practice. Mandava NB, Ito Y, editors. New York: Marcel Dekker; 1988. p. 79. [Google Scholar]
- 2.Conway WD. Countercurrent Chromatography, Principle, Apparatus and Applications. New York: VCH; 1990. [Google Scholar]
- 3.Ito Y. In: High-Speed Countercurrent Chromatography. Ito Y, Conway WD, editors. New York: Wiley; 1996. [Google Scholar]
- 4.Conway WD, Petroski PJ, editors. Modern Countercurrent Chromatography, ACS Symposium Series 593. Washington, DC: ACS; 1995. [Google Scholar]
- 5.Menet J-M, Thiébaut D, editors. Countercurrent Chromatography, Chromatographic Series, vol. 82. New York: Marcel Dekker; 1999. [Google Scholar]
- 6.Berthod A, editor. Countercurrent Chromatography: The Support-Free Liquid Stationary Phase. New York: Elsevier; 2002. [Google Scholar]
- 7.Ito Y. CRC Crit. Rev. Anal. Chem. 1986;17:65. [Google Scholar]
- 8.Cahnmann HJ, Conçalves E, Ito Y, Fales HM, Sokoloski EA. J. Chromatogr. 1991;538:165. doi: 10.1016/s0021-9673(01)91634-6. [DOI] [PubMed] [Google Scholar]
- 9.Ito Y, Shibusawa Y, Fales HM, Cahnmann HJ. J. Chromatogr. 1992;625:177. doi: 10.1016/0021-9673(92)85200-d. [DOI] [PubMed] [Google Scholar]
- 10.Weisz A, Scher AL, Shinomiya K, Fales HM, Ito Y. J. Am. Chem. Soc. 1994;116:704. [Google Scholar]
- 11.Ito Y, Ma Y. J. Chromatogr. A. 1996;753:1. doi: 10.1016/s0021-9673(96)00565-1. [DOI] [PubMed] [Google Scholar]
- 12.Scher AL, Ito Y. Chapter 15. In: Conway WD, Petroski PJ, editors. Modern Countercurrent Chromatography, ACS Symposium Series 593. Washington, DC: ACS; 1995. p. 182. [Google Scholar]
- 13.Weisz A, Scher AL, Ito Y. J. Chromatogr. A. 1996;732:283. doi: 10.1016/0021-9673(95)01266-4. [DOI] [PubMed] [Google Scholar]
- 14.Somanath M. Sample Preparation Techniques in Analytical Chemistry. New Jersey, USA: Wiley-Interscience; 2003. [Google Scholar]
- 15.Weisz A, Mazzola EP, Ito Y. J. Chromatogr. A. 2011;1218:8249. doi: 10.1016/j.chroma.2011.09.049. [DOI] [PMC free article] [PubMed] [Google Scholar]
- 16.Weisz A. Chapter 12. In: Ito Y, Conway WD, editors. High-Speed Countercurent Chromatography Chemical Analysis, vol. 132. New York: Wiley; 1996. p. 337. [Google Scholar]
- 17.Ma Y, Ito Y, Sokoloski EA, Fales HM. J. Chromatogr. A. 1994;685:259. doi: 10.1016/0021-9673(94)00667-9. [DOI] [PubMed] [Google Scholar]
- 18.Ma Y, Ito Y. J. Chromatogr. A. 1995;702:197. doi: 10.1016/0021-9673(94)00852-z. [DOI] [PubMed] [Google Scholar]
- 19.Ma Y, Ito Y. Anal. Chem. 1996;68:1207. doi: 10.1021/ac9509263. [DOI] [PubMed] [Google Scholar]
- 20.Ma Y, Ito Y. J. Chromatogr. A. 1997;771:81. doi: 10.1016/s0021-9673(97)00065-4. [DOI] [PubMed] [Google Scholar]
- 21.Ma Y, Sokoloski EA, Ito Y. JChromatogr. A. 1996;724:348. doi: 10.1016/0021-9673(95)00999-x. [DOI] [PubMed] [Google Scholar]
- 22.Weisz A, Mazzola EP, Matusik Je, Ito Y. J .Chromatogr. A. 2001;923:87. doi: 10.1016/s0021-9673(01)00984-0. [DOI] [PubMed] [Google Scholar]
- 23.Weisz A, Mazzola EP, Ito Y. J. Chromatogr. A. 2009;1216:4161. doi: 10.1016/j.chroma.2009.02.064. [DOI] [PMC free article] [PubMed] [Google Scholar]
- 24.Ma Y, Ito Y. J. Chromatogr. A. 1995;704:75. doi: 10.1016/0021-9673(95)00148-g. [DOI] [PubMed] [Google Scholar]


