

Abstract
Objective
While black-white and regional disparities in U.S. stroke mortality rates are well documented, the contribution of disparities in stroke incidence is unknown. We provide national estimates of stroke incidence by race and region, contrasting these to publicly available stroke mortality data.
Methods
This analysis included 27,744 men and women without prevalent stroke (40.4% black), aged ≥45 years from the REasons for Geographic And Racial Differences in Stroke (REGARDS) national cohort study, enrolled 2003–2007. Incident stroke was defined as first occurrence of stroke over 4.4 years of follow-up. Age-sex–adjusted stroke mortality rates were calculated using data from the Centers for Disease Control and Prevention (CDC) Wide-Ranging Online Data for Epidemiological Research (WONDER) System.
Results
There were 460 incident strokes over 113,469 person-years of follow-up. Relative to the rest of the United States, incidence rate ratios (IRRs) of stroke in the southeastern stroke belt and stroke buckle were 1.06 (95% confidence interval [CI], 0.87–1.29) and 1.19 (95% CI, 0.96–1.47), respectively. The age-sex–adjusted black/white IRRblack was 1.51 (95% CI, 1.26–1.81), but for ages 45–54 years the IRRblack was 4.02 (95% CI, 1.23–13.11) while for ages 85+ it was 0.86 (95% CI, 0.33–2.20). Generally, the IRRsblack were less than the mortality rate ratios (MRRs) across age groups; however, only in ages 55–64 years and 65–74 years did the 95% CIs of IRRsblack not include the MRRblack. The MRRs for regions were within 95% CIs for IRRs.
Interpretation
National patterns of black-white and regional differences in stroke incidence are similar to those for stroke mortality; however, the magnitude of differences in incidence appear smaller.
Stroke mortality rates declined dramatically in the 20th century, yielding 1 of the top 10 public health achievements of that era.1 Despite this, rates have remained consistently higher among blacks than any other race/ethnic group in the United States.2–5 This disparity in stroke mortality is largest at younger ages; at age 45 years, the mortality rate is 3 times higher for blacks than whites, with a decreasing racial disparity with increasing age: by age 85 years the difference is no longer apparent.2–4,6 There are also substantial geographic disparities in stroke mortality with higher rates in the southeastern United States, termed the “stroke belt.” First identified in 1965, excess stroke mortality rates in this region have existed since at least 1940 and have persisted.6–8 A 153-county region including the coastal plain of North Carolina, South Carolina, and Georgia is referred to as the “stroke buckle” due to even higher stroke mortality than the rest of the stroke belt.9 Because the stroke belt and buckle contain counties with very high stroke mortality rates and counties with average or even low stroke mortality, the overall stroke mortality is approximately 20% higher in the stroke belt than rest of the nation, with rates in the stroke buckle approximately 40% higher than rest of the nation.6–9
In the Greater Cincinnati/Northern Kentucky Stroke Study (GCNKSS), the black-white disparity in stroke mortality was primarily due to higher stroke incidence among blacks, with little contribution of case fatality, the other potential contributor to disparities in stroke mortality.10 National racial and geographic disparities in stroke mortality are documented based on death certificates through the national vital statistics system. National data on stroke incidence based on validated stroke events are not available. The goal of this report was to describe black-white and geographic differences in stroke incidence in a national population-based cohort and assess if the pattern and magnitude of stroke incidence rates mirror the disparities in stroke mortality.
Patients and Methods
The Reasons for Geographic And Racial Differences in Stroke (REGARDS) study is a longitudinal population-based cohort study designed to investigate factors associated with excess stroke mortality among blacks and residents of the stroke belt region, defined as the 8 southern states of North Carolina, South Carolina, Georgia, Tennessee, Mississippi, Alabama, Louisiana, and Arkansas.9 Community-dwelling individuals, aged ≥45 years, self-identified as non-Hispanic black or white, were enrolled January 2003–October 2007, resulting in a cohort of 30,239. Participants were randomly selected from a well-characterized commercially available list.11 Exclusion criteria included self-reported medical conditions (such as cancer) that would prevent long-term participation, or being on a waiting list for a nursing home. Participants were recruited to create a sample balanced on race and sex, and across the stroke buckle, stroke belt, and rest of the contiguous United States. The final sample comprised 21% from the stroke buckle, 35% from the rest of the stroke belt area, 44% from the other 40 contiguous states, and 42% black, 55% women (Fig 1).
FIGURE 1.
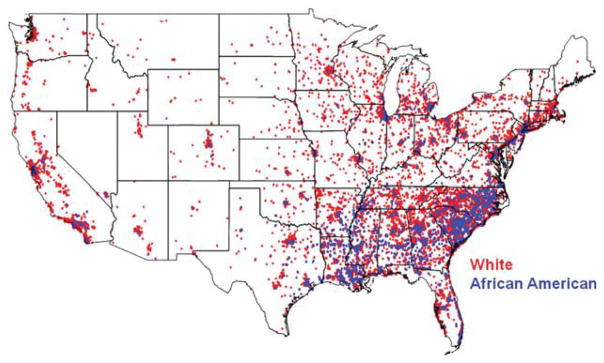
Location for REGARDS participants across the United States, red represents white participants, blue represents black participants. REGARDS = REasons for Geographic And Racial Differences in Stroke.
Potential participants were mailed a letter and brochure introducing the study and telephoned within 2 weeks. After providing verbal consent, participants were interviewed to assess demographics and cardiovascular health profile. In a subsequent visit to participant’s home, written informed consent was obtained, and standardized measurements of risk factors and collection of blood and urine were performed by a health professional. All involved institutional review boards approved the study protocol. Further details of methods are available elsewhere.12 Telephone response rate, defined according to American Association for Public Opinion Research standards,13 was 33% and cooperation rate was 49%, rates similar to those in other epidemiologic studies.14,15
Participants or their proxies were contacted every 6 months by telephone to identify hospitalizations, emergency department visits, overnight stays in nursing homes or rehabilitation centers, or death during the previous 6 months. Reasons for medical encounters were asked and medical records were sought for stroke, transient ischemic attack (TIA), death, unknown reason for hospitalization, or if reason was brain aneurysm, brain hemorrhage, sudden weakness, numbness, trouble speaking, sudden loss of vision, headache, or other stroke symptoms. For proxy reported deaths, interview was conducted with next of kin.
After initial review by a stroke nurse to exclude obvious noncases, medical records were reviewed by at least 2 physician members of a committee of stroke experts to validate and classify potential strokes. Disagreements were resolved by full committee review. Over time, if adjudicator disagreement with other adjudicators was >20%, the involved adjudicator underwent retraining.
Stroke events were defined following World Health Organization (WHO) definition as “rapidly developing clinical signs of focal, at times global, disturbance of cerebral function, lasting more than 24 hours or leading to death with no apparent cause other than that of vascular origin.”16 Events not meeting this definition but characterized by symptoms lasting <24 hours, with neuroimaging consistent with acute ischemia or hemorrhage were classified as “clinical strokes.” “Probable stroke” was defined for cases in which adjudicators agreed that the event was likely a stroke or death related to stroke but information was incomplete for WHO or clinical classification. Strokes were further classified as ischemic or hemorrhagic. Sensitivity analyses were performed to assess if results differed when analyses were restricted to only WHO strokes.
Calculation of Mortality Rates
Age-adjusted and sex-adjusted stroke mortality rates were calculated using data from compressed mortality file from the Centers for Disease Control and Prevention (CDC) Wide-Ranging Online Data for Epidemiological Research (WONDER) System.17 Data from 4 consecutive years, 2003–2006 (most recent data available), were used to provide stable estimates. For comparability with REGARDS, only data from blacks and whites aged ≥45 years were included. Mortality rate ratios (MRRs) for blacks compared to whites were determined in 10-year age strata starting at age 45 years, with the interval starting at age 85 years having no upper age limit. Regional differences were described by calculating age-sex–adjusted stroke mortality rates for the stroke belt, the stroke buckle, and the rest of the nation, and calculating MRRs for belt and buckle relative to the rest of the nation. Because these rates were based on census of all deaths occurring in the 4-year period, there is no sampling variance so 95% confidence limits (CIs) are not appropriate.
Statistical Analysis
The end of follow-up for analysis was May 24, 2010. Follow-up time for each participant was calculated from date of in-home visit to date of first stroke, death, or last telephone follow-up. Stroke incidence rates were calculated as number of incident events (WHO or clinical or probable stroke) divided by person-years at risk within each age-race-sex-region stratum, with 95% CIs calculated assuming a Poisson distribution. Adjusted rates were standardized to the 2000 U.S. population. Incidence rate ratios (IRRs) were calculated for stroke belt and stroke buckle relative to the rest of the country, and for blacks relative to whites within each age stratum.
To maximize the number of events included, we selected a recent date for end of follow-up that was close to the time of analysis. Thus, not all potential events were fully processed. Additionally, we were unable to retrieve records for some suspected events. Exclusion of these incompletely processed potential events would reduce estimates of event rates and could bias results. The outcome of these potential events for which the adjudication process was not completed are simply missing data, in these the use of multiple imputation has been encouraged as an approach to reduce potential biases and improve precision.18 We applied multiple imputation techniques to classify potential stroke events still in process, using a logistic function predicting the likelihood that an attempted record retrieval would result in an adjudicated stroke.19 This model included as predictors race, region, and reason prompting record retrieval attempt; no other available factors were associated with likelihood of adjudication as stroke. Ten datasets including imputed outcomes were generated, with estimates of incidence rates and IRRs produced by the SAS procedure MIANALYZE. Details of this approach are available elsewhere.19 Analyses were carried out in SAS version 9.02 (SAS Institute, Cary, NC).
Results
Of the 30,239 REGARDS participants, follow-up was available on 29,648 (98%). Of these, 1,886 (6%) with self-reported history of physician-diagnosed stroke at baseline were excluded. A total of 14 participants were excluded due to uncertain start of follow-up, 4 were excluded who had a stroke between their baseline telephone interview and in-home visit, resulting in an analysis cohort of 27,744. Demographic characteristics and baseline stroke risk factors by incident stroke status are provided in Table 1.
TABLE 1.
Characteristics of REGARDS Population by Incident Stroke Status
| Characteristic | Participantsa | |
|---|---|---|
| Without Incident Stroke (n = 27,284) | With Incident Stroke (n = 460) | |
| Black | 11 005 (40.3) | 198 (43.0) |
| Male | 12 126 (44.4) | 243 (52.8) |
| Age, yr, mean (SD) | 64.6 (9.4) | 70.3 (8.6) |
| Region of country | ||
| Stroke belt | 9 457 (34.7) | 158 (34.4) |
| Stroke buckle | 5 740 (21.0) | 93 (20.2) |
| Rest of country | 12 087 (44.3) | 209 (45.4) |
| Prevalent hypertensionb | 15 668 (57.6) | 338 (73.5) |
| Prevalent diabetesc | 5 505 (20.8) | 114 (25.7) |
| Current smoker | 3 816 (14.0) | 93 (20.3) |
n = 27,744.
Data represented as number (percentage) of participants unless otherwise indicated; continuous variables are expressed as mean (SD).
Hypertension defined as systolic blood pressure ≥140mmHg or diastolic blood pressure ≥90mmHg or self-reported use of antihypertensive medications.
Diabetes defined as defined as a fasting glucose level greater than 126ml/dl, nonfasting glucose greater than 200ml/dl, or self-reported medication use for glucose control.
REGARDS = REasons for Geographic And Racial Differences in Stroke; SD = standard deviation.
As of May 24, 2010, medical records and/or proxy interviews were sought on 4,410 suspected stroke events from 3,255 participants. Of these events, records were successfully reviewed for 3,417 (77.5%), still in process for 512 (11.6%), and could not be obtained for 481 (10.9%). The primary reason for inability to obtain medical records was participant or proxy declining to return a requested Health Insurance Portability and Accountability Act (HIPAA)-compliant hospital-specific authorization form. Among 3,417 suspected events with completed adjudication, there were 488 (14.3%) incident stroke events among 460 participants over a median follow-up of 4.4 years: 383 WHO strokes, 103 clinical strokes, and 2 probable strokes. In addition, 162 (4,7%) were adjudicated as TIAs and 2,767 (80.9%) as none-vents. Among the 488 strokes, only first ischemic stroke, first hemorrhagic stroke, or first nonspecific stroke for a participant was retained, yielding 464 cases. Four participants had 2 different types of strokes; 2 had ischemic stroke then hemorrhagic stroke, 1 had hemorrhagic stroke then ischemic stroke, 1 had hemorrhagic stroke then nonspecific stroke. Of the 460 participants with incident stroke, 384 (82.7%) were ischemic, 53 (11.4%) hemorrhagic, and 27 (5.8%) nonspecific (Table 2).
TABLE 2.
Number of Participants with an Incident Stroke Event and Person-Years of Observation by Type of Stroke, Race, and Sex
| Stroke Type | Men
|
Women
|
Totala | ||
|---|---|---|---|---|---|
| Black | White | Black | White | ||
| Ischemic | 72 | 126 | 94 | 92 | 384 |
|
| |||||
| Hemorrhagic | 11 | 21 | 13 | 8 | 53 |
|
| |||||
| Unclassified | 8 | 7 | 2 | 10 | 27 |
|
| |||||
| Totala | 90 | 153 | 108 | 109 | 460 |
|
| |||||
| Person-years of observation | 16,976 | 35,918 | 27,327 | 33,248 | 113,469 |
Four participants had 2 different types of strokes and appear in the table in 2 rows. Specifically, 2 participants had an infarction followed subsequently by a hemorrhage 21 days and 470 days later, respectively, 1 had a hemorrhage followed by an infarction 126 days later, and 1 had a hemorrhage followed by a nonspecific stroke 384 days later. The participants with 2 events were included in the analysis for ischemic and hemorrhagic strokes if relevant, but only the first stroke was counted for the all-stroke incidence analysis.
Table 3 provides estimated age-race-sex–adjusted stroke incidence rates per 100,000 person-years. For all strokes, the highest rate was in the stroke buckle (614/100,000 person-years), followed by the stroke belt (547/100,000), then the non–stroke belt (517/100,000). Compared to area outside the stroke belt, the IRR was 1.06 (95% CI, 0.87–1.29) in the stroke belt and 1.19 (95% CI, 0.96–1.47) in the stroke buckle, differences that were not statistically significant. The regional pattern and magnitude of differences were similar for ischemic stroke; however, for hemorrhagic stroke, there was no trend among regions, with rates ranging from 68 in 100,000 in the stroke belt to 70 in 100,000 in the non–stroke belt. As anticipated, sensitivity analyses restricted to only WHO strokes provided incidence estimates generally 25% below those provided in Table 3 (reflecting the exclusion of approximately 25% of strokes identified as clinical strokes); however, estimates of relative risk were not substantially affected by the restriction (data not shown.)
TABLE 3.
Estimated Stroke Incidence Rate (per 100,000 person-years) and Incidence Rate Ratio (with 95% CI) for all Stroke, Cerebral Infarction, and Hemorrhagic Stroke
| Participants at Risk For Events | All Strokesa
|
Ischemic Strokea
|
Hemorrhagic Strokea
|
||||
|---|---|---|---|---|---|---|---|
| Incidence Rate | Incidence Rate Ratio (95% CI) | Incidence Rate | Incidence Rate Ratio (95% CI) | Incidence Rate | Incidence Rate Ratio (95% CI) | ||
| Region (adjusted for age, race, and sex) | |||||||
|
| |||||||
| Non–stroke belt | 12,296 | 517 (429–623) | 1.0 (ref) | 416 (338–512) | 1.0 (ref) | 70 (42–117) | 1.0 (ref) |
|
| |||||||
| Stroke belt | 9,615 | 547 (447–670) | 1.06 (0.87–1.29) | 456 (361–575) | 1.10 (0.88–1.36) | 68 (40–118) | 0.98 (0.53–1.81) |
|
| |||||||
| Stroke buckle | 5,833 | 614 (487–773) | 1.19 (0.96–1.47) | 496 (381–645) | 1.19 (0.93–1.53) | 69 (36–134) | 0.99 (0.49–2.02) |
|
| |||||||
| Race (adjusted for sex) | |||||||
|
| |||||||
| All Ages | |||||||
|
| |||||||
| White | 16,541 | 479 (409–561) | 1.0 (ref) | 386 (320–465) | 1.0 (ref) | 56 (35–92) | 1.0 (ref) |
|
| |||||||
| Black | 11,203 | 722 (601–867) | 1.51 (1.26–1.81) | 584 (474–720) | 1.52 (1.24–1.85) | 85 (51–140) | 1.50 (0.87–2.60) |
|
| |||||||
| Age 45–54 yr | |||||||
|
| |||||||
| White | 1,936 | 71 (25–197) | 1.0 (ref) | 52 (15–174) | 1.0 (ref) | ||
|
| |||||||
| Black | 1,607 | 284 (156–518) | 4.02 (1.23–13.11) | 194 (94–401) | 3.73 (0.93–14.97) | ||
|
| |||||||
| Age 55–64 yr | |||||||
|
| |||||||
| White | 6,188 | 276 (216–352) | 1.0 (ref) | 245 (188–319) | 1.0 (ref) | ||
|
| |||||||
| Black | 4,535 | 492 (391–619) | 1.79 (1.27–2.51) | 403 (311–523) | 1.64 (1.13–2.39) | ||
|
| |||||||
| Age 65–74 yr | |||||||
|
| |||||||
| White | 5,412 | 548 (456–660) | 1.0 (ref) | 457 (372–562) | 1.0 (ref) | ||
|
| |||||||
| Black | 3,474 | 792 (633–990) | 1.44 (1.07–1.94) | 709 (561–896) | 1.55 (1.12–2.14) | ||
|
| |||||||
| Age 75–84 yr | |||||||
|
| |||||||
| White | 2,654 | 1086 (893–1319) | 1.0 (ref) | 883 (713–1095) | 1.0 (ref) | ||
|
| |||||||
| Black | 1,414 | 1450 (1130–1859) | 1.34 (0.98–1.82) | 1165 (864–1570) | 1.32 (0.92–1.89) | ||
|
| |||||||
| Age 85+ | |||||||
|
| |||||||
| White | 351 | 1353 (803–2277) | 1.0 (ref) | 1050 (558–1977) | 1.0 (ref) | ||
|
| |||||||
| Black | 173 | 1162 (514–2627) | 0.86 (0.33–2.20) | 1093 (439–2722) | 1.04 (0.33–3.23) | ||
Shown by region, and race-age strata for all stroke and infarction and by race for hemorrhagic stroke (detailed breakdown not possible because of a relatively small number of events).
The participants with 2 events were included in the analysis for ischemic and hemorrhagic strokes if relevant, but only the first stroke was counted for the all-stroke incidence analysis.
CI = confidence interval.
Overall, the black-white sex-adjusted IRR (Table 3) for all strokes was 1.51 (95% CI, 1.26–1.81); however, the magnitude of racial disparity differed significantly by age (pinteraction = 0.04). The highest black-white sex-adjusted IRR was for the youngest age group, 45–54 years (4.02; 95% CI, 1.23–13.11), with IRRs monotonically lower in each increasing age group, so there was no racial disparity for participants age ≥85 years (IRR 0.86; 95% CI, 0.33–2.20).
Figure 2 contrasts regional and racial differences in all stroke mortality for blacks and whites aged ≥45 years from CDC data to regional and racial IRRs calculated from REGARDS. For both region (see Fig 2A) and race (see Fig 2B), the pattern for CDC mortality and REGARDS incidence was similar. The magnitude of differences in stroke incidence was approximately one-half of the magnitude of differences in stroke mortality. Likewise, the pattern of greater racial disparities at younger ages was present for both REGARDS stroke incidence and CDC stroke mortality. In the youngest age stratum (45–54 years), the estimated REGARDS IRR was greater than the CDC MRR (4.02 vs 3.47); however, the magnitude of disparity in incidence was only approximately one-half of that observed for mortality for all other age strata. Only for age strata 55–64 years and 65–74 years did 95% CIs of IRRs not include the CDC MRR. For comparisons across regions, the MRRs were within the 95% CIs for IRRs observed in REGARDS.
FIGURE 2.

Comparison of stroke MRRs calculated from U.S. death statistics, and IRRs calculated from REGARDS; 95% confidence intervals are provided for the IRR estimates from REGARDS but the MRRs are based on all deaths over the age of 45 years in the United States and as such there is no sampling variation and 95% confidence limits cannot be calculated. (A) MRR and IRR are expressed for the stroke belt and stroke buckle relative to the rest of the nation. (B) Black rates are shown relative to whites within each age stratum. IRR = incidence rate ratio; MRR = mortality rate ratio; REGARDS = REasons for Geographic And Racial Differences in Stroke.
Discussion
In these first national data on black-white and regional differences in centrally-adjudicated stroke incidence, we observed that racial and regional patterns in stroke incidence were quite similar to patterns for stroke mortality, suggesting that disparities in incidence play a substantial role in mortality disparities. The magnitude of disparities in incidence was approximately one-half that for mortality, suggesting that incidence only partly explains mortality disparities and that differences in case fatality or other factors likely contribute to racial and geographic disparities in stroke mortality.
We show here that the well-described difference by age in the racial disparity in stroke mortality is also present for stroke incidence. The racial disparity in stroke mortality and incidence is greater at younger compared to older ages, with blacks between ages 35–64 years having 3 to 4 times the risk of dying from stroke than whites. With increasing age, the magnitude of this disparity in stroke mortality decreases, and by age 85 years, risk of stroke death is similar for blacks and whites.2–4,6 Our findings support heightened vigilance for detection, treatment, and control of stroke risk factors among young blacks.
The known contributing factors for the excess stroke incidence in blacks include higher prevalence of hypertension and diabetes and lower socioeconomic status,20–23 However, Giles and colleagues21 suggested that these factors explain only a small portion of the excess risk, and younger blacks are still at increased stroke risk even after adjustment for these risk factors.
Other pathways that could contribute include differential susceptibility of blacks to the same level of risk factors,24 incomplete quantification of risk factors in research, or differences by race in novel risk factors (eg, markers of inflammation25 and psychosocial factors.) An earlier onset of vascular risk factors in blacks may also play a role in explaining the larger racial disparities at younger ages.24,26 Investigation of these pathways is underway within REGARDS.
While the pattern of regional differences in stroke incidence reflects the pattern of regional differences in stroke mortality, the differences in incidence were not statistically significant. This was not unexpected, since geographic disparities in mortality are small (21% excess in the stroke belt, 36% excess in the stroke buckle relative to the rest of the nation.). Under the assumption that smaller geographic disparities in mortality are reflected in smaller geographic disparities in incidence, we expect lower statistical power to detect these geographic disparities. Thus, while we observed a similar geographic pattern for incidence and mortality, interpretation of results requires caution. Follow-up of the REGARDS cohort is ongoing, which will allow improved power for these analyses.
A number of other epidemiologic studies with clinically-reviewed stroke cases provide insights to black-white differences in stroke incidence across a broad age spectrum and in different regions of the United States. Data from these studies plus REGARDS are summarized in Table 4. A comparison of incidence rates across these studies should not be made without considering differences in methodology and population. Surveillance data from GCNKSS, previously the largest population-based comparison of black-white differences in clinically reviewed stroke incidence, reported a 2005 black-white age-sex–adjusted IRR for ischemic stroke of 1.6 (294/100,000 for blacks vs 179/100,000 for whites).27 These incidence rates are lower than we observed while the IRR is very similar. The higher REGARDS rates are probably due to older age of REGARDS participants and that about one-half of REGARDS participants resided in the stroke belt and buckle, whereas GCNKKS is outside the stroke belt. Our data are also similar to surveillance data from the Northern Manhattan Stroke Study (NOMASS), which reported age-adjusted IRRs for ischemic stroke of 2.2 for men and 2.8 for women28 and the Atherosclerosis Risk in Communities (ARIC) prospective cohort study that reported an IRR for blacks compared to whites of 2.6.20 However, differences in methodologies between these estimates made from surveillance studies and those estimated from this longitudinal cohort study implies hat comparisons need to be made with caution. The higher IRR in ARIC likely reflects the cohort’s lower age distribution of 45–64 years. A limitation of ARIC is that its black participants were primarily from 1 city in the stroke belt.20 The prospective cohort Cardiovascular Health Study (CHS) included individuals aged ≥65 years at baseline, thus it is not surprising that its black-white IRR was lowest of any study, 1.05,29 given the age-race interaction described above.10,21,27,28 An important limitation for all these studies is the restricted geographic areas, unlike REGARDS.
TABLE 4.
Age-Adjusted Annual Stroke Incidence Rates (per 100,000 person-years) and 95% CI by Race, Black-White IRR, and 95% CI for Epidemiologic Studies with Clinically Confirmed Stroke Events
| REGARDS Cohort (Nationalb, Ages 451 yr) | ARIC20 Cohort (4 Communities, Ages 45–64 yr) | CHS29 Cohort (4 Communities, Ages 651 yr) | NOMASS28 Surveillance (1 Community, Ages 201 yr) | GCNKSS27a Surveillance (1 Community, Ages 201 yr) | ||
|---|---|---|---|---|---|---|
| Menc | Womenc | |||||
| Participants with stroke, n | 460 | 267 | 665 | 115 | 195 | 1,921 |
| Person-years of FU (last calendar year of FU) | 113,469 (2010) | 109,330 (1995) | 46,976 (2000) | (1996) | (2005) | |
| Total stroke | ||||||
| White | 479 (409–561) | 172 (138–215) | 173 (154–191) | 118 (89–48) | 80 (61–100) | 208(199–218) |
| Black | 722 (601–867) | 445 (356–556) | 182 (137–228) | 259 (178–340) | 222 (177–268) | 331 (299–364) |
| IRR | 1.51 (1.26–1.81) | 2.58 (2.02–3.29) | 1.05c,d | 2.2 (1.5–3.3) | 2.8 (2.0–3.8) | 1.6c,d |
| Ischemic stroke | Not available | |||||
| White | 386 (320–465) | 148 (116–190) | 98 (72–124) | 58 (42–73) | 179 (170–188) | |
| Black | 584 (474–720) | 357 (277–461) | 196 (125–267) | 184 (143–226) | 294 (164–325) | |
| IRR | 1.52 (1.24–1.85) | 2.41 (1.85–3.15) | 2.0 (1.3–3.1) | 3.2 (2.2–4.6) | 1.6c,d | |
| Hemorrhagic strokee | Not available | |||||
| White | 56 (35–92) | 11 (5–23) | 20d | 23d | 38d | |
| Black | 85 (51–140) | 65 (37–114) | 63d | 38d | 76d | |
| IRR | 1.50 (0.87–2.60) | 5.9c,d | 3.2c,d | 1.6c,d | 2.0d | |
Total stroke for men and women unless indicated otherwise.
Data are age-adjusted and sex-adjusted to the 2000 U.S. Census.
REGARDS excludes Alaska and Hawaii.
Calculated from data provided in reference.
Information for calculating CIs was not available.
In NOMASS and GCNKSS, incidence rates for hemorrhagic stroke were calculated as the sum of the reported rates for ICH and SAH.
ARIC = Atherosclerosis Risk in Communities; CHS = Cardiovascular Health Study; CI = confidence interval; FU = follow-up; GCNKSS = Greater Cincinnati/Northern Kentucky Stroke Study; ICH = intracerebral hemorrhage; IRR = incidence rate ratio; NOMASS = Northern Manhattan Stroke Study; REGARDS = REasons for Geographic And Racial Differences in Stroke; SAH = subarachnoid hemorrhage.
Our study adds to the literature by providing the first estimates of regional differences in stroke incidence based on suspected events confirmed by central adjudication of medical records. The Health and Retirement Study (HRS), a nationally representative cohort of persons ≥50 years, provides national incidence rates based on self-reported or proxy-reported strokes through 2006 but data are not provided by region.30 Regional differences in incident stroke were reported by NHANES I Epidemiologic Follow-up Study using diagnosis codes from hospital records and death certificates, and from the Physicians’ Health Study (PHS) using self-report.31,32 In NHANES, stroke incidence rates were highest in the southeast compared to other regions31 and in the PHS, the unadjusted rate was 15% higher in the southeast than the rest of the nation.32 Both of these studies defined southeast according to U.S. Census categories, 12 states plus the District of Columbia, and several states with lower stroke mortality were included. We report 6% higher incidence in stroke belt and 19% higher in the stroke buckle compared to the rest of the United States.
The strengths and limitations of this work need to be considered. REGARDS is a geographically diverse study with a large sample size, and 1 of the largest cohorts of blacks evaluating stroke outcomes. There was potential for selection bias as those who participated may not be representative of the general population, and approximately 30% who initially consented by telephone did not continue to the in-home exam. Our cooperation rate compares favorably with other observational cardiovascular studies, and only race was identified as predictive of lower participation. Since our analysis is stratified by race, this should not introduce bias. Another limitation is exclusion of other race/ethnic groups. REGARDS was designed to assess black vs white differences in stroke risk because stroke mortality disparities for blacks are larger than for any other race/ethnic group in the United States.6 The number of participants with stroke in the youngest (45–54 years) and oldest (85+ years) age strata are relatively small, leading to wide CIs around estimated IRRs. As follow-up for stroke events is ongoing and additional stroke deaths will be identified, future analyses will offer more precise estimates of differences that may exist. Stroke cases could have been missed if participants did not recognize or seek care for stroke symptoms or if they did not recall a physician diagnosis, but these were minimized by seeking records for any evaluation of stroke symptoms. As in other studies, not all medical records for suspected stroke could be retrieved; records were unavailable for 11% of potential stroke events. We addressed this limitation by using multiple imputation techniques. Due to the relatively low numbers of stroke deaths in the cohort, we relied on CDC national data for regional mortality comparisons; future analyses will evaluate both incidence and case-fatality using REGARDS data.
Conclusions
These are the first national data describing racial and regional differences in adjudicated stroke incidence. We confirm an excess stroke incidence among blacks and a trend for higher incidence in the stroke belt region of the United States. The similarity of the patterns in stroke incidence in REGARDS and CDC stroke mortality suggests that incidence may be a major contributor to disparities in stroke mortality. The differences in incidence are of smaller magnitude than differences in mortality, suggesting that disparities in stroke case-fatality or other factors are also important. This information provides justification for directing risk factor prevention initiatives targeted to younger blacks and residents of the stroke belt and buckle regions.
Acknowledgments
This research was supported by a grant from the National Institutes of Health (National Institute of Neurological Disorders and Stroke cooperative agreement U01 NS041588) to GH.
We thank the investigators, staff, and participants of the REGARDS study for their valuable contributions. We also thank the members of the Stroke Adjudication Committee for their dedication and valuable contributions: Drs A. Anderson, S. Bowling, D. Brenner, C. Gomez, B. Kissela, D. Kleindorfer, D. Levine, J. Meschia, M. Safford, and G. Varela.
Footnotes
A full list of participating REGARDS investigators and institutions can be found at http://www.regardsstudy.org.
Potential Conflicts of Interest
D.R., G.H., and V.J.H. have received grant(s) from the NIH National Institute of Neurological Disorders and Stroke (NINDS) for the REGARDS Study. G.H. has grant(s) pending from the NIH-NINDS. B.K. has received funding from NIH-NINDS for the REGARDS study for travel to study meetings, effort for adjudication of stroke events, and authorship; has grant(s) pending (NINDS R-01 NS039987, NCRR 1UL1 RR026314); has consulted for Allergan; has developed educational presentations for and has been paid for travel from Allergan; and has provided expert testimony for various entities. D.O.K. has been paid travel expenses for meetings from NINDS REGARDS funding; has been paid for lectures from the Boehringer Ingelheim Speaker’s Bureau; and has grant(s) pending from NINDS. M.C. has received grant(s) from the NIH and has been reimbursed travel expenses for meetings from the NIH. L.M. has received grant(s), has grant(s) pending, and has received consulting fees (as a DSMB member) from NINDS. S.J. has received grant(s) and has received support for travel to meetings from NIH-NINDS.
References
- 1.Centers for Disease Control and Prevention. Ten great public health achievements–United States, 1900–1999. MMWR Morb Mortal Wkly Rep. 1999;48:241–243. [PubMed] [Google Scholar]
- 2.Howard G, Anderson R, Sorlie P, et al. Ethnic differences in stroke mortality between non-Hispanic whites, Hispanic whites, and blacks. The National Longitudinal Mortality Study. Stroke. 1994;25:2120–2125. doi: 10.1161/01.str.25.11.2120. [DOI] [PubMed] [Google Scholar]
- 3.Gillum RF. Stroke mortality in blacks. Disturbing trends. Stroke. 1999;30:1711–1715. doi: 10.1161/01.str.30.8.1711. [DOI] [PubMed] [Google Scholar]
- 4.Howard G, Howard VJ. Ethnic disparities in stroke: the scope of the problem. Ethn Dis. 2001;11:761–768. [PubMed] [Google Scholar]
- 5.Towfighi A, Ovbiagele B, Saver JL. Therapeutic milestone: stroke declines from the second to the third leading organ- and disease-specific cause of death in the United States. Stroke. 2010;41:499–503. doi: 10.1161/STROKEAHA.109.571828. [DOI] [PubMed] [Google Scholar]
- 6.Casper ML, Barnett E, Williams GI, Jr, et al. Atlas of stroke mortality: racial, ethnic, and geographic disparities in the United States. Atlanta, GA: Department of Health and Human Services, Centers for Disease Control and Prevention; 2003. [Google Scholar]
- 7.Borhani NO. Changes and geographic distribution of mortality from cerebrovascular disease. Am J Public Health. 1965;55:673–681. doi: 10.2105/ajph.55.5.673. [DOI] [PMC free article] [PubMed] [Google Scholar]
- 8.Lanska DJ, Kuller LH. The geography of stroke mortality in the United States and the concept of a stroke belt. Stroke. 1995;26:1145–1149. doi: 10.1161/01.str.26.7.1145. [DOI] [PubMed] [Google Scholar]
- 9.Howard G, Anderson R, Johnson NJ, et al. Evaluation of social status as a contributing factor to the stroke belt region of the United States. Stroke. 1997;28:936–940. doi: 10.1161/01.str.28.5.936. [DOI] [PubMed] [Google Scholar]
- 10.Kissela B, Schneider A, Kleindorfer D, et al. Stroke in a biracial population: the excess burden of stroke among blacks. Stroke. 2004;35:426–431. doi: 10.1161/01.STR.0000110982.74967.39. [DOI] [PubMed] [Google Scholar]
- 11.GENESYS Sampling Systems. [Accessed January 27, 2011]; Available at: http://www.genesys-sampling.com/home.aspx.
- 12.Howard VJ, Cushman M, Pulley L, et al. The REasons for Geographic And Racial Differences in Stroke (REGARDS) study: objectives and design. Neuroepidemiology. 2005;25:135–143. doi: 10.1159/000086678. [DOI] [PubMed] [Google Scholar]
- 13.Morton LM, Cahill J, Hartge P. Reporting participation in epidemiologic studies: a survey of practice. Am J Epidemiol. 2006;163:197–203. doi: 10.1093/aje/kwj036. [DOI] [PubMed] [Google Scholar]
- 14.Jackson R, Chambless LE, Yang K, et al. Differences between respondents nonrespondents in a multicenter community-based study vary by gender and ethnicity. J Clin Epidemiol. 1996;49:1441–1446. doi: 10.1016/0895-4356(95)00047-x. [DOI] [PubMed] [Google Scholar]
- 15. [Accessed January 27, 2011];MESA Exam 1 Participation Rate. Available at: http://www.mesa-nhlbi.org/PublicDocs/2004/Participation_10-13-2004.doc.
- 16.Stroke-1989. Recommendations on stroke prevention, diagnosis and therapy. Report of the WHO Task Force on Stroke and other Cerebrovascular Disorders. Stroke. 1989;20:1407–1431. doi: 10.1161/01.str.20.10.1407. [DOI] [PubMed] [Google Scholar]
- 17.Centers for Disease Control and Prevention, National Center for Health Statistics. Compressed Mortality File 1999–2006. [Accessed January 2011];CDC WONDER On-line Database, compiled from Compressed Mortality File 1999–2006 Series 20 No 2L. 2009 Available at: http://wonder.cdc.gov/cmf-icd10.html (retrieved and compiled on January 30, 2010)
- 18.Klebanoff MA, Cole SR. Use of multiple imputation in the epidemiologic literature. Am J Epidemiol. 2008;168:355–357. doi: 10.1093/aje/kwn071. [DOI] [PMC free article] [PubMed] [Google Scholar]
- 19.Howard G, McClure LA, Moy CS, et al. Imputation of events for “incomplete adjudication” in observational epidemiologic studies. Am J Epidemiol. (in press) [Google Scholar]
- 20.Rosamond WD, Folsom AR, Chambless LE, et al. Stroke incidence and survival among middle-aged adults: 9-year follow-up of the Atherosclerosis Risk in Communities (ARIC) cohort. Stroke. 1999;30:736–743. doi: 10.1161/01.str.30.4.736. [DOI] [PubMed] [Google Scholar]
- 21.Giles WH, Kittner SJ, Hebel JR, et al. Determinants of black-white differences in the risk of cerebral infarction. The National Health and Nutrition Examination Survey Epidemiologic Follow-up Study. Arch Intern Med. 1995;155:1319–1324. [PubMed] [Google Scholar]
- 22.Kittner SJ, White LR, Losonczy KG, et al. Black-white differences in stroke incidence in a national sample. The contribution of hypertension and diabetes mellitus. JAMA. 1990;264:1267–1270. [PubMed] [Google Scholar]
- 23.Kleindorfer DO, Lindsell C, Broderick J, et al. Impact of socioeconomic status on stroke incidence: a population-based study. Ann Neurol. 2006;60:480–484. doi: 10.1002/ana.20974. [DOI] [PubMed] [Google Scholar]
- 24.Sacco RL, Boden-Albala B, Abel G, et al. Race-ethnic disparities in the impact of stroke risk factors: the Northern Manhattan Stroke Study. Stroke. 2001;32:1725–1731. doi: 10.1161/01.str.32.8.1725. [DOI] [PubMed] [Google Scholar]
- 25.Cushman M, McClure LA, Howard VJ, et al. Implications of increased C-reactive protein for cardiovascular risk stratification in black and white men and women in the US. Clin Chem. 2009;55:1627–1636. doi: 10.1373/clinchem.2008.122093. [DOI] [PMC free article] [PubMed] [Google Scholar]
- 26.Howard G, Prineas R, Moy C, et al. Racial and geographic differences in awareness, treatment, and control of hypertension: the REasons for Geographic And Racial Differences in Stroke study. Stroke. 2006;37:1171–1178. doi: 10.1161/01.STR.0000217222.09978.ce. [DOI] [PubMed] [Google Scholar]
- 27.Kleindorfer DO, Khoury J, Moomaw CJ, et al. Stroke incidence is decreasing in whites but not in blacks: a population-based estimate of temporal trends in stroke incidence from the Greater Cincinnati/Northern Kentucky Stroke Study. Stroke. 2010;41:1326–1331. doi: 10.1161/STROKEAHA.109.575043. [DOI] [PMC free article] [PubMed] [Google Scholar]
- 28.Sacco RL, Boden-Albala B, Gan R, et al. Stroke incidence among white, black and Hispanic residents of an urban community: the Northern Manhattan Stroke Study. Am J Epidemiol. 1998;147:259–268. doi: 10.1093/oxfordjournals.aje.a009445. [DOI] [PubMed] [Google Scholar]
- 29.El-Saed A, Kuller LH, Newman AB, et al. Geographic variations in stroke incidence and mortality among older populations in four US communities. Stroke. 2006;37:1975–1979. doi: 10.1161/01.STR.0000231453.98473.67. [DOI] [PubMed] [Google Scholar]
- 30.Glymour MM, Avendano M. Can self-reported strokes be used to study stroke incidence and risk factors? Evidence from the Health and Retirement Study. Stroke. 2009;40:873–879. doi: 10.1161/STROKEAHA.108.529479. [DOI] [PubMed] [Google Scholar]
- 31.Gillum RF, Ingram DD. Relation between residence in the southeast region of the United States and stroke incidence. The NHANES I Epidemiologic Followup Study. Am J Epidemiol. 1996;144:665–673. doi: 10.1093/oxfordjournals.aje.a008979. [DOI] [PubMed] [Google Scholar]
- 32.Rich DQ, Gaziano JM, Kurth T. Geographic patterns in overall and specific cardiovascular disease incidence in apparently healthy men in the United States. Stroke. 2007;38:2221–2227. doi: 10.1161/STROKEAHA.107.483719. [DOI] [PubMed] [Google Scholar]