

Abstract
Throughout the brain, multiple interneuron types influence distinct aspects of synaptic processing. Interneuron diversity can thereby promote differential firing from neurons receiving common excitation. In contrast, Golgi cells are the sole interneurons regulating granule cell spiking evoked by mossy fibers, thereby gating inputs to the cerebellar cortex. Here, we examine how this single interneuron type modifies activity in its targets. We find that GABAA-mediated transmission at unitary Golgi cell → granule cell synapses consists of varying contributions of fast synaptic currents and sustained inhibition. Fast IPSCs depress and slow IPSCs gradually build during high frequency Golgi cell activity. Consequently, fast and slow inhibition differentially influence granule cell spike timing during persistent mossy fiber input. Furthermore, slow inhibition reduces the gain of the mossy fiber → granule cell input-output curve, while fast inhibition increases the threshold. Thus, a lack of interneuron diversity need not prevent flexible inhibitory control of synaptic processing.
Keywords: inhibition, spillover, input-output curve, spike timing, channelrhodopsin-2, dynamic clamp
Introduction
When neurons receive a common excitatory input, inhibition can provide dynamic and differential control over their spike output. This can entail modifying the relationship between input excitation and output firing rates (Chance et al., 2002; Mitchell and Silver, 2003; Vogels and Abbott, 2009), or varying the timing of spikes from the neuron (Cobb et al., 1995; Pouille and Scanziani, 2001; Pouille and Scanziani, 2004; Somogyi and Klausberger, 2005; Wehr and Zador, 2003). Typically multiple types of interneurons provide inhibition with distinct properties to selectively control different aspects of neuronal spike output (Banks et al., 2000; Freund and Buzsaki, 1996; Glickfeld and Scanziani, 2006; Gupta et al., 2000; Hefft and Jonas, 2005; Klausberger et al., 2003; Markram et al., 2004; McBain and Fisahn, 2001; Miles et al., 1996; Pouille and Scanziani, 2004; Tamas et al., 2003). In the cerebellar cortex individual mossy fibers excite many granule cells, yet granule cells are inhibited only by a single class of interneuron, Golgi cells (Eccles, 1967; Palay, 1974). While Golgi cells are known to play an important role in motor control (Watanabe et al., 1998), the extent to which they can promote differential firing in granule cells and regulate specific aspects of granule cell firing remains an open question.
Previous studies suggest that populations of Golgi cells can provide multiple types of inhibition. Golgi cell synapses onto granule cells are made within a glomerulus consisting of a mossy fiber bouton, 50 to 100 granule cell dendrites, and Golgi cell axons that have tens to hundreds of release sites (Hamori and Somogyi, 1983; Jakab and Hamori, 1988). Direct synaptic contacts between Golgi cells and granule cells produce fast IPSCs mediated primarily by α1-containing GABAA receptors (Nusser et al., 1998; Rossi and Hamann, 1998). In addition, the close spacing of release sites and scarcity of intervening glia within the glomerulus allow neurotransmitter to diffuse and act at distal sites beyond the opposing post-synaptic density (DiGregorio et al., 2002; Mitchell and Silver, 2000a; Mitchell and Silver, 2000b; Nielsen et al., 2004; Rossi and Hamann, 1998; Xu-Friedman and Regehr, 2003). This spillover transmission creates slow indirect IPSCs (Rossi and Hamann, 1998), as well as heterosynaptic modulation of mossy fiber and Golgi cell inputs (Mitchell and Silver, 2000a; Mitchell and Silver, 2000b). Furthermore, high affinity α6-containing GABAA receptors render granule cells sensitive to ambient GABA levels in the glomerulus, creating a tonic conductance that dampens excitability (Brickley et al., 1996; Hamann et al., 2002; Kaneda et al., 1995; Wall and Usowicz, 1997). Ultrastructural studies show that within a glomerulus the number and size of connections made by Golgi cell axons to granule cells is highly variable and 40% of granule cells are not directly contacted by a Golgi cell axon (Jakab and Hamori, 1988). These observations suggest that the potential for variation in the time course and properties of inhibition may be present at individual Golgi cell → granule cell synapses.
Our understanding of the functional role of Golgi cell inhibition has been limited by the fact that the properties of individual Golgi cell → granule cell connections have not been characterized in detail. Moreover, the properties of this synapse during elevated Golgi cell firing at rates observed in vivo (Holtzman et al., 2006; van Kan et al., 1993; Vos et al., 1999) has not been studied. As a consequence, studies of the effects of inhibition on the input-output relationship at the mossy fiber to granule cell synapses have focused on steady-state conditions and regulation by tonic inhibition provided by the Golgi cell (Mitchell and Silver, 2003; Rothman et al., 2009).
Here we investigate the properties of individual Golgi cell → granule cell synapses during elevated Golgi cell activity. We find that there is considerable diversity in the properties of individual synapses: some are dominated by fast IPSCs, others consist only of slow IPSCs, and many have both fast and slow components. The slow IPSC dominates charge transfer during high frequency trains, and is evident even in the absence of direct synaptic contacts. Dynamic clamp studies of the effect of Golgi cell inhibition on granule cell firing suggest that the two types of inhibition have differential effects on the timing and number of spikes evoked by mossy fiber input. Fast IPSCs are most effective at suppressing granule cell firing early in the stimulus train, whereas the slow IPSC dramatically reduces late spikes during sustained mossy fiber activity. Fast and slow inhibition also differentially regulate the input-output curves at the mossy fiber → granule cell synapse, with the slow component selectively reducing the gain and the fast component affecting the threshold of activation. Together these findings suggest that a single type of interneuron can regulate activity in different ways with distinct functional consequences.
Methods
Preparation of brain slices
Sagittal slices (250 μm thick) were prepared from the cerebellar vermis of 19 to 40 day old Sprague Dawley rats which were deeply anesthetized with halothane or isoflurane. Brains were dissected and sliced at 4 °C in a cutting solution consisting of (in mM): 83 NaCl, 2.4 KCl, 0.5 CaCl2, 6.8 MgCl2, 24 NaHCO3, 1.4 NaH2PO4, 24 glucose, and 71 sucrose. Slices were immediately transferred to cutting solution at 32 °C and maintained for at least 30 minutes, then transferred to an external solution consisting of (in mM): 125 NaCl, 2.5 KCl, 2 CaCl2, 1 MgCl2, 26 NaHCO3, 1.25 NaH2PO4, and 25 glucose. Slices were superfused at 2–3 ml/minute with external solution bubbled with 95% O2/5% CO2.
Electrophysiology
Whole-cell voltage clamp recordings of granule cells and on-cell voltage clamp recordings of Golgi cells were obtained from visually identified cells in the granule cell layer using glass pipettes of 2 – 5 MΩ, when filled with a internal recording solution consisting of (in mM): 35 CsF, 100 CsCl, 10 EGTA, 10 HEPES, adjusted to pH 7.2 with CsOH. For whole-cell recordings the access resistance and leak current were monitored, and experiments were rejected if either of these parameters changed significantly. GABAA-mediated synaptic currents were recorded at −60 mV in the presence of NBQX (10 μM) and R-CPP (5 μM) to block AMPAR-mediated synaptic currents and NMDAR-mediated synaptic currents, respectively. For experiments involving extracellular stimulation, a 1 – 2 MΩ glass pipette filled with external solution was used and trains were delivered every 60 seconds. Paired recordings were attempted for Golgi and granule cell pairs whose somas were typically separated by approximately 300 μm or less. The internal solution for whole-cell current clamp and voltage clamp recordings of Golgi cells, and dynamic clamp recordings of granule cells consisted of (in mM): 130 HMeSO4, 10 NaCl, 2 MgCl2, 0.16 CaCl2, 0.5 EGTA, 10 HEPES, 4 Na ATP, 0.4 Na GTP, 14 Tris-phosphocreatine, adjusted to pH 7.3 with KOH. Experiments were performed at 32–35° C. Outputs from an Axopatch 700A (Axon Instruments, Foster City, CA) amplifier were digitized with an ITC-18 A/D converter using custom routines (written by M. A. Xu-Friedman, State University of New York at Buffalo) in Igor Pro (Wavemetrics, Lake Oswego, OR). Recordings were sampled at 50 kHz, and filtered for display at 1 – 5 kHz.
Data Analysis
The estimation of the slow IPSC during trains was performed by averaging the last 5 milliseconds of the interval between two stimuli and setting the current amplitude within that interval equal to this average. This is shown in more detail in Figure S1. Synaptic events were detected using a threshold (average peak to peak noise in the baseline) of the first derivative, second derivative, and raw current trace, and confirmed visually. Data are expressed as mean ± SEM.
Preparation of Lentivirus
Lentivirus for the expression of channelrhodopsin-2 (ChR2) was prepared by transfection of HEK 293 FT cells with: 1) pLenti-synapsin I–hChR2–mCherry (K. Deisseroth, Stanford), 2) pCMV-Δ8.74, and 3) pCMV – VsVg. Virus was collected by ultracentrifugation, resuspended in PBS, and stored at −80° C. Lentivirus was delivered via stereotaxic injection into rats aged postnatal day (p) 12 to p15. Two holes were drilled in the skull 2– 4 mm caudally from λ, and ±2 mm from the midline, and virus was injected at a depth of approximately 1 – 3 mm below the surface of the brain. Injections (50 nl) were given every 20 s, and the total volume per injection site was between 1 and 2 μl. Acute slices were cut at least 6 days after virus injection. Cells expressing ChR2 were visually identified using mCherry fluorescence. Golgi and Purkinje cells were primarily labeled. Golgi cells were identified based on the size, shape and location of their soma, as well as their spontaneous firing pattern. Typically fewer than 20 ChR2-expressing Golgi cells were observed in a slice, and their density decreased with distance from the injection site.
Photostimulation
ChR2-expressing cells were activated with a blue laser (Opto Engine 473 nm, 50 mW) with a Q495LP dichroic and a HQ: 525/50 emission filter (Chroma, Rockingham, VT). The size of the stimulation window was adjusted to closely box in the soma of the expressing Golgi cell (typically 20 – 30 μm in diameter, using an Olympus fluorescence attachment (modified by Till photonics) in order to minimize direct illumination of the Golgi cell axon. Short duration light pulses (typically 1 ms) were delivered and the intensity was adjusted to achieve reliable single spikes in response to single light pulses. Trains of varying frequency (5 – 100 Hz) were delivered every 60 seconds and the spiking of the Golgi cell was always monitored with an on-cell electrode containing Cs-based internal solution.
Dynamic clamp
Dynamic clamp recordings were made using the built in dynamic clamp mode of the ITC-18 (Instrutech, Great Neck, NY). Conductance trains for the AMPAR and NMDAR components of mossy fiber EPSCs were constructed by convolving individual events using parameters obtained from voltage clamp recordings of AMPA and NMDA mediated trains of synaptic events at the mossy fiber to granule cell synapse (Fig S3). AMPAR and NMDAR conductances reversed at 0 mV. NMDAR to AMPAR ratios were 0.1 – 0.5, in the range observed previously at this synapse (Cathala et al., 2000). A custom IGOR XOP (written by M. A. Xu-Friedman, State University of New York at Buffalo) interacting with a PCI-MIO-16XE-10 board (National Instruments, Austin, TX) was used for online generation of NMDA conductances. The voltage dependence of the NMDA component was approximated by the equation: I(t) = (Vrev − Vm) GNMDA (t)/(1 + exp (V1/2 − Vm)/Vrate), where Vrev is the reversal potential (0 mV), Vm is the recorded membrane potential, V1/2 is the membrane potential for half-maximal activation (−11 mV), and Vrate specifies the rate of dependence on membrane potential (18 mV). The reversal potential for inhibitory conductances was set at −75 mV (Mitchell and Silver, 2003; Rothman et al., 2009). Dynamic clamp recordings were performed in the presence of NBQX (10 μM), CPP (5 μM), and picrotoxin (50 μM). Current was injected to maintain the membrane potential of the granule cell between −75 and −80 mV.
Reagents
All chemicals were from Sigma/RBI (St. Louis, MO) except CPP, CGP 55845, and NBQX (Tocris Cookson, Ellisville, MO).
Results
The frequency dependence of Golgi cell → granule cell synapses
We examined the frequency dependence of inhibition at the Golgi cell → granule cell synapse by stimulating Golgi cell axons with an extracellular electrode placed in the granular layer and recording IPSCs in granule cells. Synapses were activated with 100 stimuli at 5 to 100 Hz, with excitatory transmission blocked. Low frequency spontaneous IPSCs were observed in the absence of stimulation. Stimulation evoked inhibitory currents that consisted of fast IPSCs (Fig. 1A) riding atop a slow IPSC component (Fig. 1A, red traces, see Fig. S1). Increases in stimulus frequency increased the amplitude of the slow IPSC, whereas the amplitude of the fast IPSCs decreased. The relative contribution of the fast and slow components of the IPSC was determined by integrating the currents measured in Fig. 1A to quantify the total synaptic charge (Fig. 1B, black) and then by integrating the slow component of the synaptic current (Fig. 1B, red), with the traces normalized to the total IPSC integral. For the examples shown, the slow IPSC carried 59% and 88% of the total synaptic charge at 10 Hz and 50 Hz, respectively. In the representative experiment, the fast IPSCs decreased from 130 pA at 10 Hz to 75 pA at 50 Hz (Fig. 1C). Average fast IPSC amplitudes decreased steadily above stimulation frequencies of 10 Hz, reaching 32% ± 6% of their initial value at 100 Hz (Fig. 1D). The fractional contribution of the slow component increased from 37% ± 6% at 5 Hz to 96% ± 2% at 100 Hz (Fig. 1E, n=4 cells). These data suggest that for these experimental conditions fast IPSCs are most prominent at low stimulus frequencies, but the slow IPSC dominates at higher frequencies.
Figure 1. Frequency dependence of fast and slow IPSCs at the Golgi cell → granule cell synapse.
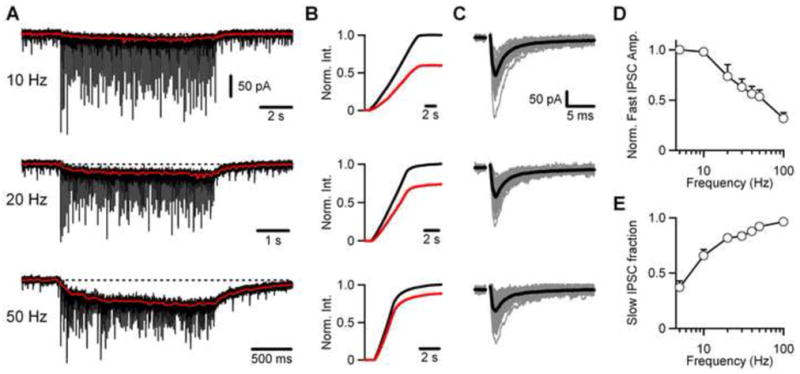
(A) Representative traces of IPSCs recorded in a granule cell in response to trains of extracellular stimulation at 10, 20, and 50 Hz. Each train is the average of three trials of 100 stimuli at each frequency. The superimposed red traces depict the slow component of the IPSC (see Figure S1), and the dotted line denotes the baseline current. (B) Normalized integrals of the total IPSC (black lines) and the slow IPSC (red lines) during the trains shown in A. (C) Individual fast IPSCs (grey traces) are shown superimposed and baseline subtracted, along with the average event (black trace) for each train shown in A. (D) Normalized fast IPSC amplitude versus frequency (n=4 cells). (E) Average fraction of IPSC charge carried by the slow IPSC versus frequency (n=4 cells).
Previous studies have shown that granule cells express high affinity α6-containing GABAA receptors, which can be enriched extrasynaptically (Nusser et al., 1998) and may preferentially carry the slow IPSC (Hamann et al., 2002; Rossi and Hamann, 1998). We determined the dependence of the slow IPSC on these receptors by evoking trains in the presence of furosemide. Although this drug can block K-Cl cotransporters (Payne, 1997), it only blocks those GABAA receptors containing the α6 subunit (Korpi et al., 1995). Furosemide (100 μm) decreased the amplitude of the total IPSC integral by approximately 50%, but did not selectively reduce the fraction carried by the slow IPSC (Fig S2). The inhibitory currents were eliminated by bicuculline (20 μM; data not shown). Overall, these data suggest that under these conditions both α1 and α6-containing GABAA receptors contribute to the fast and slow components of the Golgi cell → granule cell IPSC.
Properties of individual Golgi cell → granule cell connections
Electron microscopic reconstructions indicate that dendrites from many granule cells are contained within a single glomerulus, but Golgi cell axons make direct contacts onto only 60% of them (Jakab and Hamori, 1988). If direct synapses mediate fast IPSCs and nearby release sites onto other granule cells mediate slow IPSCs via spillover as suggested by previous work (Rossi and Hamann, 1998), these morphological studies suggest that there is likely to be diversity with regard to the contribution of fast and slow IPSCs at individual synapses. Moreover, for granule cells receiving direct Golgi cell synapses the size and number of these connections is variable (Jakab and Hamori, 1988), suggesting the efficacy of the fast IPSC is not uniform across individual synapses. We tested these possibilities by examining inhibition at individual Golgi cell → granule cell connections.
Paired recordings were made with a whole cell electrode to record postsynaptic responses in granule cells, and an on cell electrode to monitor spontaneous Golgi cell firing. Twenty six percent (42/163) of the cell pairs studied were connected. In a representative pair (Fig. 2A–C) a fraction of presynaptic Golgi cell spikes are accompanied by a large short-latency synaptic current in the granule cell with a prominent fast IPSC. The latency, measured from the peak of the downward deflection of the spike to the peak of the first derivative of the average unitary IPSC, was 1.3 milliseconds for this pair. In addition to these short-latency IPSCs, there were also IPSCs observed that were not linked to spiking in the Golgi cell being monitored (Fig. 2A, *). It is likely that such IPSCs are evoked by spontaneous firing of other Golgi cells. Putative connections were analyzed using Golgi cell spike-triggered averages of the granule cell recording. A subset of 25 Golgi cell spikes are shown for the sample pair (Fig. 2B, upper) along with the corresponding postsynaptic currents (Fig. 2B, lower, grey traces), which exhibited a broad amplitude distribution (Fig. 2C). This pair had an average unitary IPSC amplitude of 14 pA, a failure rate of 0.48, and a potency (average of successes) of 26 pA. At 36 connections exhibiting a fast IPSC the latencies were similarly short and narrowly distributed, with a mean of 1.15 ± 0.05 ms (Fig. 2D, black). The functional properties of these short-latency connections varied considerably. The failure rate (Fig. 2E) and potency (Fig. 2F) at each pair was broadly distributed with an average potency of 32 ± 3 pA (n=36, Fig. 2F, black), and an average failure rate of 0.58 ± 0.04 (n=36, Fig. 2E). Thus, the efficacy of the fast IPSC varies markedly between pairs. Interestingly, a small subset of pairs (5/42) exhibited unitary IPSCs with markedly longer latencies, averaging 10 ± 2.5 ms (Fig. 2D, red), and had very small unitary IPSC amplitudes, averaging 3.0 ± 0.4 pA (Fig. 2F, red). As discussed below, these long-latency connections lack a fast component of inhibition. These data highlight the variation in the functional properties of individual Golgi cell → granule cell connections.
Figure 2. Diversity in the contribution of fast and slow IPSCs at individual Golgi cell → granule cell connections.
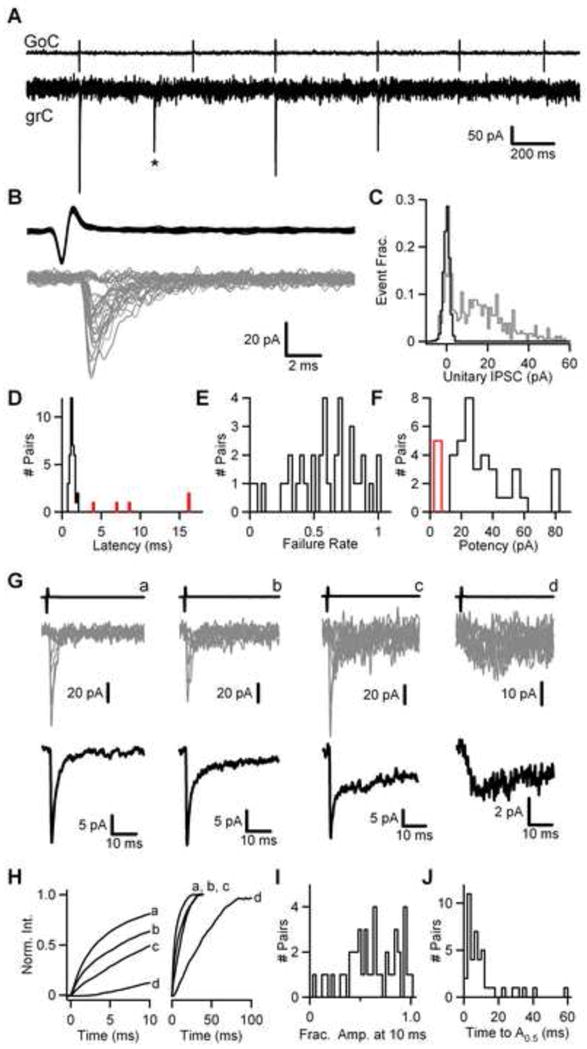
(A) Representative recording of spontaneous activity at a Golgi cell → granule cell connection, showing spikes in the presynaptic Golgi cell (upper) and the corresponding responses in the granule cell (lower). The asterisk denotes an event not temporally linked to spiking in the Golgi cell being monitored. (B) 25 superimposed Golgi cell spikes (upper), and corresponding granule cell IPSCs (lower, grey traces) from the experiment shown in B. (C) Normalized amplitude histogram of 500 events from the same experiment (grey), along with an amplitude histogram of the baseline preceding the event (black). (D) Histogram of the IPSC latency, defined as time between the peak of the downward deflection of the presynaptic spike and the peak of the first derivative of the average unitary IPSC. Pairs lacking a fast IPSC are shown in red. Histogram of failure rate (E) and potency (F) for 36 Golgi cell → granule cell connections. The average unitary IPSC amplitude for 5 additional pairs lacking a fast IPSC are shown in red. (G) Sample traces from four individual Golgi cell → granule cell connections (a–d) depicting the average presynaptic spike (upper), 10 superimposed IPSCs (middle, grey) and the average unitary IPSC (lower, black) from 58 to 253 events at each pair. (H) Average unitary IPSCs from (G) are shown integrated and normalized to their peak. The integrated currents are plotted over the first 10 ms (left) and 100 ms (right). (I) Histogram of the fractional amplitude at 10 ms of IPSCs from 42 Golgi cell → granule cell connections. (J) Histogram of the half-amplitude times for the same IPSCs shown in (I).
To examine the relative contribution of fast and slow IPSCs at a Golgi cell → granule cell pair, the time course of charge transfer following a spike was quantified. A subset of 10 IPSCs from four sample connections (Fig. 2G, middle, grey traces) are shown aligned to the presynaptic spike (Fig. 2G, upper), along with the average unitary IPSC (Fig. 2G, lower, black trace). Connections differed markedly with regard to their time course (Fig. 2Ga–d, lower). In some cases pairs exhibited a large fast IPSC that decayed rapidly (Fig. 2Ga). In others, which correspond to the long-latency pairs discussed above, an exclusively slow IPSC was observed (Fig. 2Gd). In addition, many pairs exhibited fast IPSCs with slower decays indicative of a progressively larger contribution of the slow IPSC at that connection (Fig. 2Gb, c). To quantify this variation in the time course of synaptic currents across Golgi cell → granule cell pairs the unitary IPSC was integrated and normalized to the peak of the integral. The fractional IPSC charge at ten milliseconds after onset (Fig. 2H, left) ranged from 12% for the pair with the exclusively slow IPSC (Fig. 2Gd) to 81% for the pair with the rapidly decaying fast IPSC (Fig. 2Ga), and from approximately 5% to 100% across all 42 connections (Fig. 2I). Over longer time scales (Figs. 2H right, 2J) the time to half-amplitude (A0.5) exhibited a broad distribution, with a peak near 10 ms and a tail consisting of pairs with larger contributions of the slow IPSC. These data indicate that the contribution of fast and slow IPSCs, as reflected in the time course of the unitary IPSC across Golgi cell → granule cell connections, varies markedly.
Inhibition mediated by individual Golgi cell → granule cell synapses during high frequency activation
We next sought to determine the properties of individual synapses during activation with stimulus trains. On-cell recordings allowed us to noninvasively monitor the properties of individual synapses, but they are limited by the reliance on synapses driven by the spontaneous Golgi cell activity. To allow activation of individual Golgi cells in this configuration, we generated a lentivirus to express mCherry-tagged channelrhodopsin-2 (ChR2) in the cerebellum under the control of the synapsin I promoter (Boyden et al., 2005). Brief blue light pulses (1 ms, 473 nm) of increasing intensity delivered to the soma of a ChR2-expressing Golgi cell (Fig. 3A) produced progressively larger depolarizations, sufficient to reach the action potential threshold (Fig. 3B). Golgi cell firing could be entrained by brief suprathreshold blue light pulses (Fig. 3C). The currents evoked by these light pulse trains show desensitization (Fig. 3D, upper), but are still able to drive 50 Hz firing of Golgi cells and precisely maintain a single spike per light pulse (Fig. 3D, lower).
Figure 3. Using channelrhodopsin-2 to study individual Golgi cell → granule cell synapses.
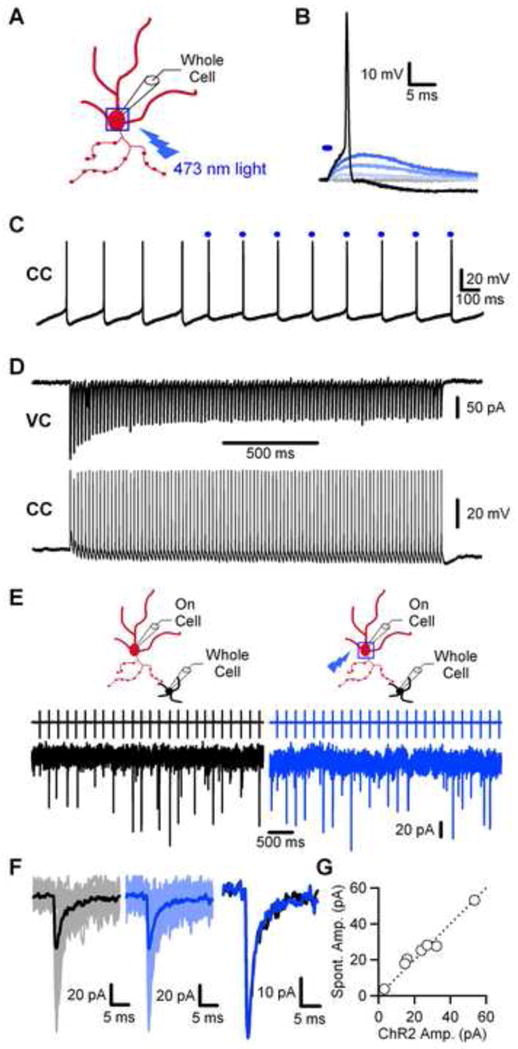
(A) Schematic depicting the typical region, a box around the soma, used for light activation of Golgi cells. A whole-cell electrode was used to monitor membrane potential during light activation of the cell. (B) Representative recording of ChR2-evoked depolarization of a Golgi cell with brief stimulus (denoted by the blue bar) of increasing intensity (1 ms pulse, 1 – 2 V applied to 50 mW 473 nm laser). (C) Sample recording of the entrainment of Golgi cell firing with brief suprathreshold blue light pulses (denoted by the blue bars). (D) Example recording from a ChR2-expressing Golgi cell of a train of 100 1 millisecond light pulses delivered at 50 Hz in voltage clamp (upper) and current clamp (lower). (E) Representative paired recording with a ChR2-expressing Golgi cell. An on-cell electrode was used to monitor Golgi cell spikes and unitary IPSCs were recorded from a granule cell with a whole-cell electrode. IPSCs were recorded either during spontaneous Golgi cell firing (left, black) or when Golgi cells were stimulated with light at approximately the rate of spontaneous firing (right, blue). (F) Overlay of 25 granule cell IPSCs, along with the average unitary IPSC, from spontaneous activity (left, grey/black traces) or from ChR2-evoked activity (right, light/dark blue traces). The average unitary IPSC from spontaneous firing (far right, black trace) is shown overlayed with the average ChR2-evoked current (far right, blue trace). (G) Summary plot of the average spontaneous IPSC amplitude plotted against the average ChR2-evoked IPSC amplitude (n= 7 pairs).
We compared the properties of inhibition evoked by spontaneous Golgi cell firing or blue light pulses at the soma (Fig. 3E–G). A sample paired recording with a ChR2-expressing Golgi cell is shown in Fig. 3E, in which IPSCs are recorded during spontaneous firing and when firing is entrained at the spontaneous frequency with light. Overlaying average spontaneous IPSCs (Fig. 3F, left, grey/black traces) and those evoked by ChR2 at the same frequency (Fig. 3F, right, light/dark blue traces) demonstrates that release is not obviously perturbed by light activation. A plot of spontaneous IPSC amplitude against ChR2-evoked amplitude falls along the unity line (Fig. 3G, n=7 cells). Overall, these data indicate that ChR2 precisely and reliably drives Golgi cell spiking and does not alter properties of release under our conditions.
We used ChR2 to evoke trains of Golgi cell activity in connected pairs. Figure 4 shows sample trains of 100 stimuli at 10 Hz, 20 Hz, and 50 Hz evoked at three connections with differing properties. The firing of the presynaptic Golgi cell was always monitored with an on-cell electrode, and postsynaptic events were detected using a presynaptic spike-triggered average. In the first sample pair spontaneous activity in the Golgi cell produced a unitary IPSC with a large, reliable fast component (release probability = 0.9, potency = 56 pA, unitary amplitude = 51 pA) and an A0.5 of 15 milliseconds (Fig. 4A). High frequency activation at this pair evoked large fast IPSCs and, as observed in extracellular stimulation experiments, a slow IPSC that became increasingly prominent with increases in stimulation frequency (Fig. 4B, red traces). The slow IPSC contributed 55% of the charge at 10 Hz, increasing to 87% at 50 Hz. In a second pair, Golgi cell stimulation at 10 Hz evoked a unitary IPSC with a smaller, less reliable fast component (potency = 17 pA, release probability = 0.12, unitary amplitude = 3 pA) and a longer A0.5 of 23 ms (Fig. 4C). A prominent slow IPSC, that carried 90% to 99% of the charge as the Golgi cell firing rate increased from 10 Hz to 50 Hz, was still evident (Fig. 4D). At the third connection, which contained no fast IPSC (average = 4 pA, A0.5 = 34 ms, Fig. 4E), trains of Golgi cell activity evoked a slow IPSC that carried all of the charge and increased in amplitude with stimulation frequency (Fig. 4F). The small phasic events seen in Fig. 4F are not linked to the spiking of the activated Golgi cell, and likely arise from activity in a different cell. These findings indicate that high frequency firing in a single Golgi cell is sufficient to produce a prominent slow IPSC during high frequency trains, even in the absence of a fast IPSC from a direct connection. The slow IPSC grows with increases in the firing rate to dominate charge transfer (range = 78% – 100% at 50 Hz, n=9), similar to our observations with extracellular stimulation.
Figure 4. Properties of IPSCs evoked by trains of activity at diverse Golgi cell → granule cell pairs.
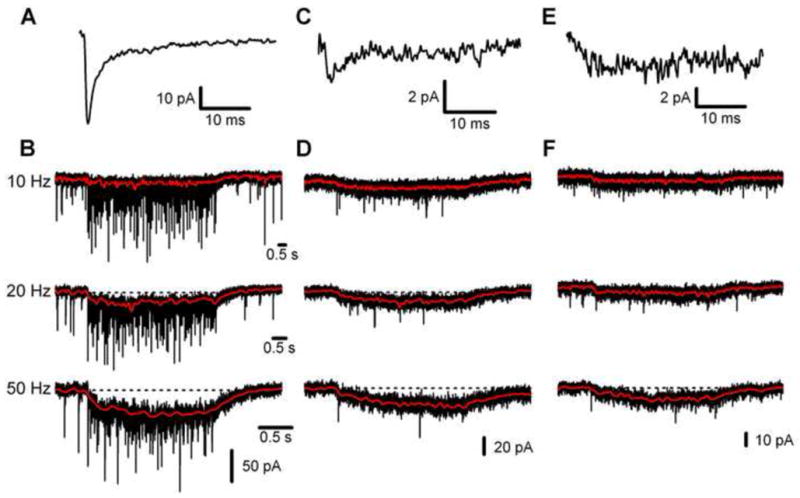
Properties of single Golgi cell → granule cell synapses were examined using spontaneous activity to determine the average IPSC (A, C, E), as in Fig. 2, and using light to evoke spikes in ChR2 expressing cells at 10 Hz, 20 Hz, and 50 Hz (B, D, F). In the first pair (A, B) a large reliable fast IPSC was observed (A, 82 events), in the second pair (C, D) smaller fast IPSCs occurred only at low rates (B, 100 events), and the third connection (E, F) contained only a small slow IPSC (C, 94 events). (B, D, F) The red traces depict the slow component of the IPSC during stimulus trains, and the dotted lines denote the baseline current.
Differential functional roles of fast and slow inhibition
Our data demonstrate that fast IPSCs and slow IPSCs contribute to Golgi cell inhibition of granule cells differentially between individual connections and across Golgi cell firing rates. We wanted to determine the functional consequences of heterogeneity in the time course of inhibition with regard to synaptic integration in granule cells. Specifically, we sought to understand how fast and slow inhibition influence the timing of spikes during a train of mossy fiber input, and how they shift the relationship between mossy fiber input and granule cell output across frequencies. To address these issues we used dynamic clamp recordings, which are feasible given that granule cells are electrically compact (Silver et al., 1996). To determine how the time course of inhibition alters the integration of excitatory input by granule cells, we delivered inhibitory waveforms corresponding to 50 Hz Golgi cell firing. Granule cell activity was driven with regular trains of mossy fiber input, including both the AMPA and NMDA component (Fig. 5A, black), based on properties of mossy fiber EPSCs recorded in voltage clamp (Fig. S3). When delivered to the granule cell, along with tonic inhibition (0.1 – 0.3 pS), trains of action potentials were generated (Fig. 5B, black). Inhibition consisted of either a train of fast IPSCs (Fig. 5A, red), a slow IPSC (Fig. 5A, blue), or mixed inhibition where the fast IPSC train and slow IPSC contribute equally (Fig. 5A, purple). The total inhibitory charge was constant for all three conditions. Fast (Fig. 5B, red), slow (Fig. 5B, blue), and mixed (Fig. 5B, purple) inhibition all reduced the number of spikes generated in response to the excitatory conductance, though spike timing within the train was differentially affected. To quantify this, spike numbers were binned into 100 millisecond intervals for the duration of the stimulation, normalized to the control frequency in the first bin, and plotted versus time. Relative to control conditions (Fig. 5C, black), fast inhibition (Fig. 5C, red) decreased the initial spike rate by approximately 60%, while slow inhibition decreased the initial spike rate by less than 20% (Fig. 5C, blue). During the last half of the train the spike rate during fast inhibition remained relatively stable over time, and reduced relative to control conditions. Slow inhibition, on the other hand, dramatically suppressed spikes late in the train, the frequency decreased from 84% to 2% of control between the first and last bin. Thus, fast inhibition is more effective at suppressing spikes early in the train. In contrast, slow inhibition has very little influence on early spikes, but dramatically suppresses spiking late in the train as the slow IPSC grows. Mixed inhibition had intermediate effects on granule cell firing (Fig. 5C, purple). The initial firing rate was reduced by 45%, and the average spike rate during the last half of the train was 11% of the control firing rate (Fig. 5C, purple), compared to 25% for fast inhibition (Fig. 5C, red) and 3% for slow inhibition (Fig. 5C, blue). This suggests that the fractional contribution of fast and slow inhibition will dictate how inhibition affects granule cell spike timing during ongoing mossy fiber activity.
Figure 5. Differential effects of fast and slow inhibition on the timing of spikes evoked by trains of excitation in granule cells.
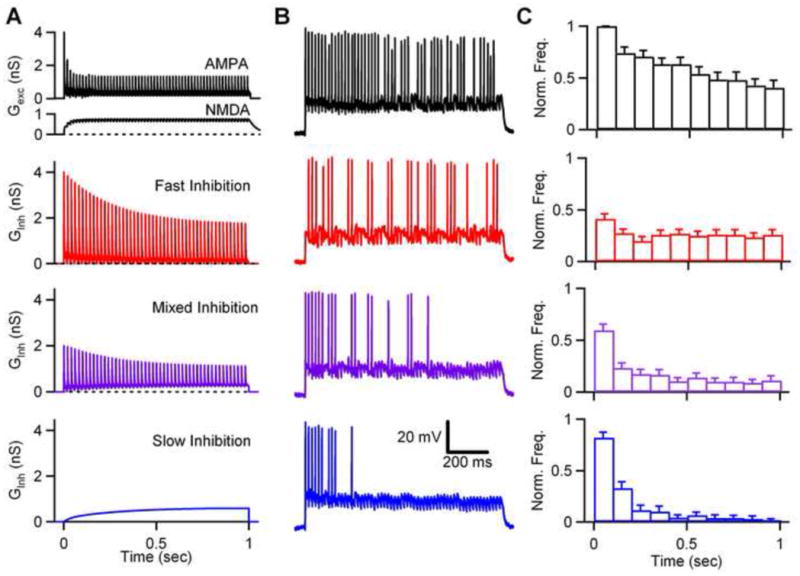
Dynamic clamp was used to examine the spiking evoked in granule cells by trains of mossy fiber activity. The properties of AMPA and NMDA conductances were determined by activating mossy fibers and measuring the resulting EPSCs in granule cells (Figure S3). AMPA and NMDA conductances are shown for 60 Hz stimulation in a sample cell (A, black). The conductance waveforms are also shown for inhibition consisting of either fast inhibition alone (A, red), slow inhibition alone (A, blue), or mixed inhibition (A, purple) evoked by a 50 Hz train of Golgi cell activity. The inhibitory charge carried by fast and slow inhibition was equal in all experiments. (B) Dynamic clamp studies were performed using excitatory conductances alone (black), and excitatory conductances accompanied by either fast inhibition (red), slow inhibition (blue), or mixed inhibition (purple). In all experiments a small tonic inhibitory conductance (0.1 – 0.3 pS) was also present. Representative traces of granule cell spiking are shown for control (black), fast inhibition (red), slow inhibition (blue), and mixed inhibition (purple). (C) Histograms of spike frequencies (normalized to the first 100 ms in control conditions) are plotted as a function of time for each condition (n=17 cells).
The transfer function between excitatory synaptic input frequency and output spike rate determines the manner in which the information carried by those synapses is encoded. Inhibition may change the shape of the input-output curve by altering the slope or sensitivity to a given excitatory input, the range of input frequencies to which a given cell responds, or both. We used dynamic clamp to deliver regular trains of mossy fiber input across a range of frequencies between 10 Hz and 200 Hz to generate input-output curves for granule cells in response to these stimuli, and tested the influence of fast, slow, and mixed trains of inhibition (as in Fig. 5A). We focused on a simple case in which a single mossy fiber was active at regular frequencies and a single Golgi cell was active at one fixed frequency. Additional experimental information will be needed to extend this approach to more complicated conditions that include irregular firing patterns, the activation of multiple mossy fibers and Golgi cells, coupling of Golgi cells through gap junctions (Dugue et al., 2009), and consideration of how the activity of mossy fibers and Golgi cells co-varies under physiological conditions.
Raster plots of granule cell spiking in response to 40 Hz, 80 Hz and 150 Hz trains of excitatory input in control conditions (Fig. 6A, black), and with fast (Fig. 6A, red), slow (Fig. 6A, blue) or mixed (Fig. 6A, purple) inhibition are shown. Fast inhibition and slow inhibition influenced the input-output curves in different ways. Over the course of the 1 second train the main influence of fast inhibition was a small rightward shift in the frequency range that activates granule cell spiking without a large change in slope (Fig. 6B. red). Slow inhibition dramatically decreased the slope with minimal effect on the threshold (Fig. 6B. blue). The effect of inhibition on the input-output curves evolved during the train due to the respective temporal dynamics of fast and slow inhibition. If spiking only in the first 100 ms is considered, the primary effect of inhibition was to decrease the slope, with fast inhibition being much more effective than slow inhibition (Fig. 6C). Later in the train, when the dynamics of the synaptic conductances approach steady state, fast inhibition only modestly shifted the input-output curve while slow inhibition greatly reduced the gain of the input-output curve (Fig. 6D). These findings indicate different roles for fast and slow inhibition in shaping the input-output curves at the mossy fiber → granule cell synapse. Mixed inhibition yielded input-output curves intermediate to those observed for fast inhibition and slow inhibition (Fig. 6BCD, purple). This suggests the proportion of fast and slow IPSC charge, which can vary between connections and across frequencies at a given connection, will determine the extent of shifts in threshold and slope.
Figure 6. Fast and slow inhibition differentially alter the input-output curve at the mossy fiber → granule cell synapse.
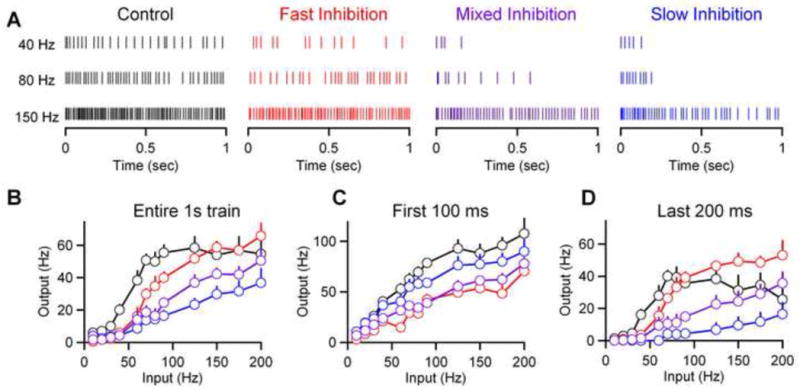
Dynamic clamp experiments were conducted as in Fig. 5 with trains of mossy fiber activity at frequencies of 10 Hz to 200 Hz using excitatory conductances alone (black), and in the presence of fast inhibition (red), slow inhibition (blue), or mixed inhibition (purple). (A) Raster plots of spikes evoked in granule cells at 40 Hz, 80 Hz, and 150 Hz are shown for each condition. (B) Average input-output curves are shown with input frequencies corresponding to the frequency of mossy fiber input trains and output frequencies corresponding to granule cell spiking (n= 9 cells). (C) Input-output curves from the same data set, considering only spiking in the first 100 ms (left) or last 200 ms (right) of the conductance injection.
Discussion
Here we find that individual Golgi cell → granule cell connections exhibit IPSCs with diverse properties as a result of heterogeneity in the contribution of fast and slow IPSCs. The slow component of IPSCs becomes increasingly prominent during stimulus trains of 20 to 50Hz. For granule cell spiking evoked by high frequency mossy fiber trains, slow inhibition reduces spiking evoked late in the train, whereas fast inhibition is more effective early in the train. These two forms of inhibition differentially affect the input-output curve at the mossy fiber → granule cell synapse, with slow inhibition reducing the gain and fast inhibition increasing the threshold for evoking spikes.
The frequency-dependence of Golgi cell inhibition
Previous studies have shown that inhibition evoked by extracellular stimulation at the Golgi cell → granule cell synapse has a fast component from direct synapses and a slow component from indirect spillover transmission (Rossi and Hamann, 1998). Here, we determined the properties of inhibition during trains of evoked activity and its dependence on stimulation frequency. At spontaneous Golgi cell firing rates (5 –10Hz; Holtzman et al., 2006; van Kan et al., 1993; Vos et al., 1999) fast and slow IPSCs make a roughly equivalent contribution to inhibitory charge transfer. As the frequency of extracellular stimulation increases the fast IPSC amplitude decreases, and the slow component grows to dominate charge transfer. Moreover the dynamics of the two components during a train differ markedly, as the fast IPSCs exhibit depression and the slow component gradually builds. Thus, the fast and slow components contribute in very different ways to the frequency dependence and dynamics of inhibition provided by Golgi cells.
Role of α6-containing GABAA receptors
Granule cells express multiple GABAA receptor subtypes that may differentially contribute to fast and slow inhibition. High affinity, desensitization-resistant α6β2/3δ receptors are preferentially extrasynaptic (Nusser et al., 1998). Deletion of the 6 subunit or block of α6-containing receptors eliminates a tonic GABAA conductance that is observed in granule cells (Brickley et al., 2001; Hamann et al., 2002; Rossi et al., 2003). However, blockade of α6-containing receptors blockade of has variable effects on the amplitude and decay of single IPSCs (Hamann et al., 2002; Rossi and Hamann, 1998; Wall, 2002). In addition, both α6 and α1-containing receptors are detected at synapses and α1-containing receptors can be found in extrasynaptic membranes (Nusser et al., 1995; Nusser et al., 1998). We tested the possibility that during trains α6-containing receptors preferentially mediate the slow component. The blockade of α6-containing receptors did not alter the relative contribution of fast and slow components during trains (Fig S2), suggesting that α6- and α1-containing receptors both contribute to the fast and slow components.
Golgi cell → granule cell connections are heterogeneous
We observed diverse potencies (range: 10–78 pA, mean=32 pA; n=36), failure rates (range: 0 – 0.99, mean=0.58; n=36) and time courses (A0.5 range: 1.5 – 58 ms, mean=10.8; n=42) in unitary IPSCs across Golgi cell → granule cell pairs. Differences in the number of direct synaptic contacts made by Golgi cells onto granule cells within a glomerulus have been observed (Jakab and Hamori, 1988), which could contribute to this diversity in synaptic properties. Moreover, granule cells typically have 1 to 4 dendrites (Palay, 1974), and it is possible that Golgi cells could contact glomeruli on multiple dendrites. Thus, a large variation in the number of direct synapses between different cell pairs may contribute to the wide range of potencies and failure rates we observe at individual connections. In addition, the distribution of Golgi cell synapses within a glomerulus may also be a factor in determining the balance of fast and slow IPSCs at a particular connection. The exclusively slow IPSCs (~12 %, 5/42) we observe at some connections may reflect the observation that 40% of granule cells in a glomerulus are not directly contacted by a Golgi cell (Jakab and Hamori, 1988), if, as previously suggested (Rossi and Hamann, 1998), spillover generates slow IPSCs. Although it is also possible that connections to some of the dendrites could have been lost during slicing, it is unlikely that this had a major influence on the properties of unitary IPSCs because care was taken to patch cells deep within the slice, and granule cells have short dendrites.
Golgi cell diversity could also contribute to the diverse properties of the unitary IPSCs. While Golgi cells are glycinergic and GABAergic pacemaking interneurons with dendrites extending into molecular layer and a large profusely-ramifying axon (Dieudonne, 1998; Dugue et al., 2005; Forti et al., 2006; Kaneda et al., 1995; Ottersen et al., 1988; Palay, 1974), they differ in their soma size and in the expression of markers such as neurogranin and mGluR2 (Geurts et al., 2001; Neki et al., 1996; Simat et al., 2007). It will be of interest to determine if the synaptic diversity correlates with Golgi cell neurochemical phenotype.
Slow IPSCs can arise from activity in a single Golgi cell
We demonstrate that realistic trains of activity in a single Golgi cell are sufficient to drive slow IPSCs at individual connections. These findings establish that the slow component of inhibition does not require the synchronous activation of multiple Golgi cells. Interestingly, isolated slow IPSCs are observed during trains in a small fraction of pairs, suggesting that lack of a direct morphological connection does not preclude a significant inhibitory drive from a Golgi cell.
Fast and slow IPSCs differentially affect synaptic integration
Dynamic clamp experiments revealed that fast and slow IPSCs differentially influence spiking evoked by trains of mossy fiber activation. Slow inhibition strongly suppresses late spikes, but has minimal influence on spiking early in a train. In contrast, fast inhibition is more effective at reducing granule cell spiking early in the train. In this way, sustained mossy fiber activation evokes a brief burst of granule cell spikes early in a train, or more sustained spiking throughout the train depending on whether inhibition is dominated by slow or fast IPSCs, respectively.
These findings have important implications for models of cerebellar learning, such as eyeblink conditioning. A leading model of eyeblink conditioning requires that a continuous tone elevates spiking in different granule cells at different times following the onset of the tone (Medina et al., 2000). Only those synapses from granule cells that are active just prior to a puff of air to the eye will undergo plasticity, and in this way an animal can learn to close its eye immediately prior to an expected air puff. Our dynamic clamp experiments show that sustained mossy fiber activity, as might occur during a continuous tone (Aitkin and Boyd, 1978; Freeman and Muckler, 2003), can evoke firing in its granule cell targets that have with very different timing depending upon the relative contributions of fast and slow inhibition from Golgi cells. In this way the two components of inhibition we describe could be crucial to timing-dependent cerebellar behaviors such as eyeblink conditioning.
Golgi cell inhibition alters the threshold and gain of the input-output curves relating mossy fiber activity to granule cell activity. This is critical for controlling the fraction of active granule cells during sensorimotor activity. Previous studies at this synapse demonstrate that tonic inhibition increases the threshold of the input-output curve, and can reduce gain when converging inputs are noisy (Mitchell and Silver, 2003) or when synaptic depression causes the relationship between excitatory conductance and input frequency to become sublinear (Rothman et al., 2009). Here we have found that fast and slow IPSCs evoked by trains of Golgi cell activity differentially influence the input-output curve of the granule cell in response to regular, depressing trains of mossy fiber input. Slow IPSCs preferentially reduce the gain whereas fast IPSCs preferentially increase the threshold. These findings suggest that the same Golgi cell can have very different effects on the input-output curves of the various granule cells it targets.
Fast and slow inhibition in other brain regions
Slow forms of inhibition through ionotropic receptors are observed in several brain regions and may entail phasic events with very slow decay times (Bacci et al., 2003; Banks et al., 2000; Price et al., 2005; Sceniak and Maciver, 2008; Szabadics et al., 2007), long-lasting asynchronous release (Best and Regehr, 2009; Hefft and Jonas, 2005; Lu and Trussell, 2000), or tonic forms of inhibition that depend more on firing rate (Balakrishnan et al., 2009; Glykys and Mody, 2007a; Glykys and Mody, 2007b; Park et al., 2007). In some brain regions, different interneuron subtypes are known to provide either fast or slow inhibition (Banks et al., 2000; Hefft and Jonas, 2005; Szabadics et al., 2007). Thus, distinct cell types may differentially control the input-output curves of principal cells in these regions. In contrast, because Golgi cells are the sole source of inhibition to cerebellar granule cells, the fractional contribution of fast and slow inhibition must be regulated to control the properties of the input-output curves and the timing-dependence of the target cell response.
Supplementary Material
Figure S1. Estimation of the slow IPSC during trains. The slow IPSC was estimated by blanking the fast component, and making the region between two successive stimuli equal to the average of the last 5 ms of that interval. (A) Representative IPSC recorded in a granule cell (black) overlayed with an estimate of the slow component (red). An expanded view of the event is shown on the right. (B) Depiction of the slow IPSC during trains. The total IPSC (black) for a 40 Hz train of stimuli is shown overlayed with the estimate of the slow component (red). These traces are integrated to determine charge transfer during the total IPSC and slow IPSC. A filtered version of this slow IPSC trace is shown overlayed with the total trains in Fig. 1 and Fig. 4. An expanded view of the first six events in the train is shown below.
Figure S2. Blockade of α6-containing GABAA receptors does not selectively block the slow IPSC. (A) Representative recording of the total IPSC recorded in a granule cell evoked by a train of 30 stimuli delivered at 50 Hz (upper, black trace) along with the slow IPSC (upper, white trace) in control conditions (10 μM NBQX, 5 μM CPP, 2 μM CGP 55845) and in the presence of 100 μM furosemide (lower, red, white traces). (B) Fast IPSCs from the trains in (A) are shown superimposed and baseline subtracted, for control conditions (upper, grey, traces) and furosemide (lower, light red traces). The average fast IPSC for control (upper, black trace) and furosemide (lower, dark red trace) are superimposed on the individual events in each condition. (C) Normalized integral of the total IPSC (solid line) and slow IPSC (dotted line) in control conditions (upper, black traces) and in furosemide (lower, red traces). (D) Summary plot of the effect of furosemide on the total integral of the IPSC (n=7 cells, grey traces) along with the average ±SEM (black trace). (E) Summary plot of the effect of furosemide on the fraction of the IPSC carried by the slow component (n=7 cells, grey traces) along with the average ±SEM (black trace).
Figure S3. Dynamic clamp conductances from AMPA and NMDA components of EPSC trains at the mossy fiber → granule synapse. (A, left) Representative one second trains of AMPA EPSCs evoked in a granule cell by extracellular mossy fiber stimulation at 10 – 200 Hz. Responses are shown normalized to the first EPSC. NMDA receptors were blocked by R-CPP (5 μM) and GABAA receptors were blocked with bicuculline (20 μM). Recordings were made at −60 mV. (A, right) Dynamic clamp conductances are shown for the corresponding frequencies. Conductances were generated by convolving a single event and amplitudes were estimated from exponential fits of EPSC depression observed in voltage clamp trains, and were check by integrating the entire train to determine total charge. (B, left) NMDA component of EPSC trains at the mossy fiber → granule cell synapse. Representative NMDA EPSCs evoked by extracellular mossy fiber stimulation trains at 10 – 200 Hz, shown normalized to the first EPSC. AMPA receptors were blocked by NBQX (10 μM) and GABAA receptors were blocked with bicuculline (20 μM). Recordings were made at −30 mV. (B, right) Dynamic clamp conductances are shown for the corresponding frequencies. Conductances were generated by convolving a single event and were check by integrating and comparing total charge.
Acknowledgments
We thank Miklos Antal, Aaron Best, Megan Carey, Court Hull, Andreas Liu, Michael Myoga, and Todd Pressler for comments on the manuscript. We thank Bernardo Sabatini and his laboratory for assistance with the preparation of lentivirus. This work was supported by NIH grant R37 NS032405 (W. G. R.) and the HMS Neurobiology training grant T32NS007484 (J.J.C.).
Footnotes
Publisher's Disclaimer: This is a PDF file of an unedited manuscript that has been accepted for publication. As a service to our customers we are providing this early version of the manuscript. The manuscript will undergo copyediting, typesetting, and review of the resulting proof before it is published in its final citable form. Please note that during the production process errors may be discovered which could affect the content, and all legal disclaimers that apply to the journal pertain.
References
- Aitkin LM, Boyd J. Acoustic input to the lateral pontine nuclei. Hear Res. 1978;1:67–77. doi: 10.1016/0378-5955(78)90010-2. [DOI] [PubMed] [Google Scholar]
- Bacci A, Rudolph U, Huguenard JR, Prince DA. Major differences in inhibitory synaptic transmission onto two neocortical interneuron subclasses. J Neurosci. 2003;23:9664–9674. doi: 10.1523/JNEUROSCI.23-29-09664.2003. [DOI] [PMC free article] [PubMed] [Google Scholar]
- Balakrishnan V, Kuo SP, Roberts PD, Trussell LO. Slow glycinergic transmission mediated by transmitter pooling. Nat Neurosci. 2009;12:286–294. doi: 10.1038/nn.2265. [DOI] [PMC free article] [PubMed] [Google Scholar]
- Banks MI, White JA, Pearce RA. Interactions between distinct GABA(A) circuits in hippocampus. Neuron. 2000;25:449–457. doi: 10.1016/s0896-6273(00)80907-1. [DOI] [PubMed] [Google Scholar]
- Best AR, Regehr WG. Inhibitory regulation of electrically coupled neurons in the inferior olive is mediated by asynchronous release of GABA. Neuron. 2009;62:555–565. doi: 10.1016/j.neuron.2009.04.018. [DOI] [PMC free article] [PubMed] [Google Scholar]
- Boyden ES, Zhang F, Bamberg E, Nagel G, Deisseroth K. Millisecond-timescale, genetically targeted optical control of neural activity. Nat Neurosci. 2005;8:1263–1268. doi: 10.1038/nn1525. [DOI] [PubMed] [Google Scholar]
- Brickley SG, Cull-Candy SG, Farrant M. Development of a tonic form of synaptic inhibition in rat cerebellar granule cells resulting from persistent activation of GABAA receptors. J Physiol. 1996;497(Pt 3):753–759. doi: 10.1113/jphysiol.1996.sp021806. [DOI] [PMC free article] [PubMed] [Google Scholar]
- Brickley SG, Revilla V, Cull-Candy SG, Wisden W, Farrant M. Adaptive regulation of neuronal excitability by a voltage-independent potassium conductance. Nature. 2001;409:88–92. doi: 10.1038/35051086. [DOI] [PubMed] [Google Scholar]
- Cathala L, Misra C, Cull-Candy S. Developmental profile of the changing properties of NMDA receptors at cerebellar mossy fiber-granule cell synapses. J Neurosci. 2000;20:5899–5905. doi: 10.1523/JNEUROSCI.20-16-05899.2000. [DOI] [PMC free article] [PubMed] [Google Scholar]
- Chance FS, Abbott LF, Reyes AD. Gain modulation from background synaptic input. Neuron. 2002;35:773–782. doi: 10.1016/s0896-6273(02)00820-6. [DOI] [PubMed] [Google Scholar]
- Cobb SR, Buhl EH, Halasy K, Paulsen O, Somogyi P. Synchronization of neuronal activity in hippocampus by individual GABAergic interneurons. Nature. 1995;378:75–78. doi: 10.1038/378075a0. [DOI] [PubMed] [Google Scholar]
- Dieudonne S. Submillisecond kinetics and low efficacy of parallel fibre-Golgi cell synaptic currents in the rat cerebellum. J Physiol. 1998;510(Pt 3):845–866. doi: 10.1111/j.1469-7793.1998.845bj.x. [DOI] [PMC free article] [PubMed] [Google Scholar]
- DiGregorio DA, Nusser Z, Silver RA. Spillover of glutamate onto synaptic AMPA receptors enhances fast transmission at a cerebellar synapse. Neuron. 2002;35:521–533. doi: 10.1016/s0896-6273(02)00787-0. [DOI] [PubMed] [Google Scholar]
- Dugue GP, Brunel N, Hakim V, Schwartz E, Chat M, Levesque M, Courtemanche R, Lena C, Dieudonne S. Electrical coupling mediates tunable low-frequency oscillations and resonance in the cerebellar Golgi cell network. Neuron. 2009;61:126–139. doi: 10.1016/j.neuron.2008.11.028. [DOI] [PubMed] [Google Scholar]
- Dugue GP, Dumoulin A, Triller A, Dieudonne S. Target-dependent use of co-released inhibitory transmitters at central synapses. J Neurosci. 2005;25:6490–6498. doi: 10.1523/JNEUROSCI.1500-05.2005. [DOI] [PMC free article] [PubMed] [Google Scholar]
- Eccles J, Ito M, Szentagothai J. The Cerebellum as a Neuronal Machine. New York, Heidelberg: Springer-Verlag; 1967. [Google Scholar]
- Forti L, Cesana E, Mapelli J, D’Angelo E. Ionic mechanisms of autorhythmic firing in rat cerebellar Golgi cells. J Physiol. 2006;574:711–729. doi: 10.1113/jphysiol.2006.110858. [DOI] [PMC free article] [PubMed] [Google Scholar]
- Freeman JH, Jr, Muckler AS. Developmental changes in eyeblink conditioning and neuronal activity in the pontine nuclei. Learn Mem. 2003;10:337–345. doi: 10.1101/lm.63703. [DOI] [PMC free article] [PubMed] [Google Scholar]
- Freund TF, Buzsaki G. Interneurons of the hippocampus. Hippocampus. 1996;6:347–470. doi: 10.1002/(SICI)1098-1063(1996)6:4<347::AID-HIPO1>3.0.CO;2-I. [DOI] [PubMed] [Google Scholar]
- Geurts FJ, Timmermans J, Shigemoto R, De Schutter E. Morphological and neurochemical differentiation of large granular layer interneurons in the adult rat cerebellum. Neuroscience. 2001;104:499–512. doi: 10.1016/s0306-4522(01)00058-6. [DOI] [PubMed] [Google Scholar]
- Glickfeld LL, Scanziani M. Distinct timing in the activity of cannabinoid-sensitive and cannabinoid-insensitive basket cells. Nat Neurosci. 2006;9:807–815. doi: 10.1038/nn1688. [DOI] [PMC free article] [PubMed] [Google Scholar]
- Glykys J, Mody I. Activation of GABAA receptors: views from outside the synaptic cleft. Neuron. 2007a;56:763–770. doi: 10.1016/j.neuron.2007.11.002. [DOI] [PubMed] [Google Scholar]
- Glykys J, Mody I. The main source of ambient GABA responsible for tonic inhibition in the mouse hippocampus. J Physiol. 2007b;582:1163–1178. doi: 10.1113/jphysiol.2007.134460. [DOI] [PMC free article] [PubMed] [Google Scholar]
- Gupta A, Wang Y, Markram H. Organizing principles for a diversity of GABAergic interneurons and synapses in the neocortex. Science. 2000;287:273–278. doi: 10.1126/science.287.5451.273. [DOI] [PubMed] [Google Scholar]
- Hamann M, Rossi DJ, Attwell D. Tonic and spillover inhibition of granule cells control information flow through cerebellar cortex. Neuron. 2002;33:625–633. doi: 10.1016/s0896-6273(02)00593-7. [DOI] [PubMed] [Google Scholar]
- Hamori J, Somogyi J. Differentiation of cerebellar mossy fiber synapses in the rat: a quantitative electron microscope study. J Comp Neurol. 1983;220:365–377. doi: 10.1002/cne.902200402. [DOI] [PubMed] [Google Scholar]
- Hefft S, Jonas P. Asynchronous GABA release generates long-lasting inhibition at a hippocampal interneuron-principal neuron synapse. Nat Neurosci. 2005;8:1319–1328. doi: 10.1038/nn1542. [DOI] [PubMed] [Google Scholar]
- Holtzman T, Mostofi A, Phuah CL, Edgley SA. Cerebellar Golgi cells in the rat receive multimodal convergent peripheral inputs via the lateral funiculus of the spinal cord. J Physiol. 2006;577:69–80. doi: 10.1113/jphysiol.2006.117218. [DOI] [PMC free article] [PubMed] [Google Scholar]
- Jakab RL, Hamori J. Quantitative morphology and synaptology of cerebellar glomeruli in the rat. Anat Embryol (Berl) 1988;179:81–88. doi: 10.1007/BF00305102. [DOI] [PubMed] [Google Scholar]
- Kaneda M, Farrant M, Cull-Candy SG. Whole-cell and single-channel currents activated by GABA and glycine in granule cells of the rat cerebellum. J Physiol. 1995;485(Pt 2):419–435. doi: 10.1113/jphysiol.1995.sp020739. [DOI] [PMC free article] [PubMed] [Google Scholar]
- Klausberger T, Magill PJ, Marton LF, Roberts JD, Cobden PM, Buzsaki G, Somogyi P. Brain-state- and cell-type-specific firing of hippocampal interneurons in vivo. Nature. 2003;421:844–848. doi: 10.1038/nature01374. [DOI] [PubMed] [Google Scholar]
- Korpi ER, Kuner T, Seeburg PH, Luddens H. Selective antagonist for the cerebellar granule cell-specific gamma-aminobutyric acid type A receptor. Mol Pharmacol. 1995;47:283–289. [PubMed] [Google Scholar]
- Lu T, Trussell LO. Inhibitory transmission mediated by asynchronous transmitter release. Neuron. 2000;26:683–694. doi: 10.1016/s0896-6273(00)81204-0. [DOI] [PubMed] [Google Scholar]
- Markram H, Toledo-Rodriguez M, Wang Y, Gupta A, Silberberg G, Wu C. Interneurons of the neocortical inhibitory system. Nat Rev Neurosci. 2004;5:793–807. doi: 10.1038/nrn1519. [DOI] [PubMed] [Google Scholar]
- McBain CJ, Fisahn A. Interneurons unbound. Nat Rev Neurosci. 2001;2:11–23. doi: 10.1038/35049047. [DOI] [PubMed] [Google Scholar]
- Medina JF, Nores WL, Ohyama T, Mauk MD. Mechanisms of cerebellar learning suggested by eyelid conditioning. Curr Opin Neurobiol. 2000;10:717–724. doi: 10.1016/s0959-4388(00)00154-9. [DOI] [PubMed] [Google Scholar]
- Miles R, Toth K, Gulyas AI, Hajos N, Freund TF. Differences between somatic and dendritic inhibition in the hippocampus. Neuron. 1996;16:815–823. doi: 10.1016/s0896-6273(00)80101-4. [DOI] [PubMed] [Google Scholar]
- Mitchell SJ, Silver RA. GABA spillover from single inhibitory axons suppresses low-frequency excitatory transmission at the cerebellar glomerulus. J Neurosci. 2000a;20:8651–8658. doi: 10.1523/JNEUROSCI.20-23-08651.2000. [DOI] [PMC free article] [PubMed] [Google Scholar]
- Mitchell SJ, Silver RA. Glutamate spillover suppresses inhibition by activating presynaptic mGluRs. Nature. 2000b;404:498–502. doi: 10.1038/35006649. [DOI] [PubMed] [Google Scholar]
- Mitchell SJ, Silver RA. Shunting inhibition modulates neuronal gain during synaptic excitation. Neuron. 2003;38:433–445. doi: 10.1016/s0896-6273(03)00200-9. [DOI] [PubMed] [Google Scholar]
- Neki A, Ohishi H, Kaneko T, Shigemoto R, Nakanishi S, Mizuno N. Metabotropic glutamate receptors mGluR2 and mGluR5 are expressed in two non-overlapping populations of Golgi cells in the rat cerebellum. Neuroscience. 1996;75:815–826. doi: 10.1016/0306-4522(96)00316-8. [DOI] [PubMed] [Google Scholar]
- Nielsen TA, DiGregorio DA, Silver RA. Modulation of glutamate mobility reveals the mechanism underlying slow-rising AMPAR EPSCs and the diffusion coefficient in the synaptic cleft. Neuron. 2004;42:757–771. doi: 10.1016/j.neuron.2004.04.003. [DOI] [PubMed] [Google Scholar]
- Nusser Z, Roberts JD, Baude A, Richards JG, Somogyi P. Relative densities of synaptic and extrasynaptic GABAA receptors on cerebellar granule cells as determined by a quantitative immunogold method. J Neurosci. 1995;15:2948–2960. doi: 10.1523/JNEUROSCI.15-04-02948.1995. [DOI] [PMC free article] [PubMed] [Google Scholar]
- Nusser Z, Sieghart W, Somogyi P. Segregation of different GABAA receptors to synaptic and extrasynaptic membranes of cerebellar granule cells. J Neurosci. 1998;18:1693–1703. doi: 10.1523/JNEUROSCI.18-05-01693.1998. [DOI] [PMC free article] [PubMed] [Google Scholar]
- Ottersen OP, Storm-Mathisen J, Somogyi P. Colocalization of glycine-like and GABA-like immunoreactivities in Golgi cell terminals in the rat cerebellum: a postembedding light and electron microscopic study. Brain Res. 1988;450:342–353. doi: 10.1016/0006-8993(88)91573-9. [DOI] [PubMed] [Google Scholar]
- Palay S, Chan-Palay V. Cerebellar Cortex Cytology and Organization. New York, Heidelberg: Springer-Verlag; 1974. [Google Scholar]
- Park JB, Skalska S, Son S, Stern JE. Dual GABAA receptor-mediated inhibition in rat presympathetic paraventricular nucleus neurons. J Physiol. 2007;582:539–551. doi: 10.1113/jphysiol.2007.133223. [DOI] [PMC free article] [PubMed] [Google Scholar]
- Payne JA. Functional characterization of the neuronal-specific K-Cl cotransporter: implications for [K+]o regulation. Am J Physiol. 1997;273:C1516–1525. doi: 10.1152/ajpcell.1997.273.5.C1516. [DOI] [PubMed] [Google Scholar]
- Pouille F, Scanziani M. Enforcement of temporal fidelity in pyramidal cells by somatic feed-forward inhibition. Science. 2001;293:1159–1163. doi: 10.1126/science.1060342. [DOI] [PubMed] [Google Scholar]
- Pouille F, Scanziani M. Routing of spike series by dynamic circuits in the hippocampus. Nature. 2004;429:717–723. doi: 10.1038/nature02615. [DOI] [PubMed] [Google Scholar]
- Price CJ, Cauli B, Kovacs ER, Kulik A, Lambolez B, Shigemoto R, Capogna M. Neurogliaform neurons form a novel inhibitory network in the hippocampal CA1 area. J Neurosci. 2005;25:6775–6786. doi: 10.1523/JNEUROSCI.1135-05.2005. [DOI] [PMC free article] [PubMed] [Google Scholar]
- Rossi DJ, Hamann M. Spillover-mediated transmission at inhibitory synapses promoted by high affinity alpha6 subunit GABA(A) receptors and glomerular geometry. Neuron. 1998;20:783–795. doi: 10.1016/s0896-6273(00)81016-8. [DOI] [PubMed] [Google Scholar]
- Rossi DJ, Hamann M, Attwell D. Multiple modes of GABAergic inhibition of rat cerebellar granule cells. J Physiol. 2003;548:97–110. doi: 10.1113/jphysiol.2002.036459. [DOI] [PMC free article] [PubMed] [Google Scholar]
- Rothman JS, Cathala L, Steuber V, Silver RA. Synaptic depression enables neuronal gain control. Nature. 2009;457:1015–1018. doi: 10.1038/nature07604. [DOI] [PMC free article] [PubMed] [Google Scholar]
- Sceniak MP, Maciver MB. Slow GABA(A) mediated synaptic transmission in rat visual cortex. BMC Neurosci. 2008;9:8. doi: 10.1186/1471-2202-9-8. [DOI] [PMC free article] [PubMed] [Google Scholar]
- Silver RA, Cull-Candy SG, Takahashi T. Non-NMDA glutamate receptor occupancy and open probability at a rat cerebellar synapse with single and multiple release sites. J Physiol. 1996;494(Pt 1):231–250. doi: 10.1113/jphysiol.1996.sp021487. [DOI] [PMC free article] [PubMed] [Google Scholar]
- Simat M, Parpan F, Fritschy JM. Heterogeneity of glycinergic and gabaergic interneurons in the granule cell layer of mouse cerebellum. J Comp Neurol. 2007;500:71–83. doi: 10.1002/cne.21142. [DOI] [PubMed] [Google Scholar]
- Somogyi P, Klausberger T. Defined types of cortical interneurone structure space and spike timing in the hippocampus. J Physiol. 2005;562:9–26. doi: 10.1113/jphysiol.2004.078915. [DOI] [PMC free article] [PubMed] [Google Scholar]
- Szabadics J, Tamas G, Soltesz I. Different transmitter transients underlie presynaptic cell type specificity of GABAA, slow and GABAA, fast. Proc Natl Acad Sci U S A. 2007;104:14831–14836. doi: 10.1073/pnas.0707204104. [DOI] [PMC free article] [PubMed] [Google Scholar]
- Tamas G, Lorincz A, Simon A, Szabadics J. Identified sources and targets of slow inhibition in the neocortex. Science. 2003;299:1902–1905. doi: 10.1126/science.1082053. [DOI] [PubMed] [Google Scholar]
- van Kan PL, Gibson AR, Houk JC. Movement-related inputs to intermediate cerebellum of the monkey. J Neurophysiol. 1993;69:74–94. doi: 10.1152/jn.1993.69.1.74. [DOI] [PubMed] [Google Scholar]
- Vogels TP, Abbott LF. Gating multiple signals through detailed balance of excitation and inhibition in spiking networks. Nat Neurosci. 2009;12:483–491. doi: 10.1038/nn.2276. [DOI] [PMC free article] [PubMed] [Google Scholar]
- Vos BP, Volny-Luraghi A, De Schutter E. Cerebellar Golgi cells in the rat: receptive fields and timing of responses to facial stimulation. Eur J Neurosci. 1999;11:2621–2634. doi: 10.1046/j.1460-9568.1999.00678.x. [DOI] [PubMed] [Google Scholar]
- Wall MJ. Furosemide reveals heterogeneous GABA(A) receptor expression at adult rat Golgi cell to granule cell synapses. Neuropharmacology. 2002;43:737–749. doi: 10.1016/s0028-3908(02)00085-0. [DOI] [PubMed] [Google Scholar]
- Wall MJ, Usowicz MM. Development of action potential-dependent and independent spontaneous GABAA receptor-mediated currents in granule cells of postnatal rat cerebellum. Eur J Neurosci. 1997;9:533–548. doi: 10.1111/j.1460-9568.1997.tb01630.x. [DOI] [PubMed] [Google Scholar]
- Watanabe D, Inokawa H, Hashimoto K, Suzuki N, Kano M, Shigemoto R, Hirano T, Toyama K, Kaneko S, Yokoi M, et al. Ablation of cerebellar Golgi cells disrupts synaptic integration involving GABA inhibition and NMDA receptor activation in motor coordination. Cell. 1998;95:17–27. doi: 10.1016/s0092-8674(00)81779-1. [DOI] [PubMed] [Google Scholar]
- Wehr M, Zador AM. Balanced inhibition underlies tuning and sharpens spike timing in auditory cortex. Nature. 2003;426:442–446. doi: 10.1038/nature02116. [DOI] [PubMed] [Google Scholar]
- Xu-Friedman MA, Regehr WG. Ultrastructural contributions to desensitization at cerebellar mossy fiber to granule cell synapses. J Neurosci. 2003;23:2182–2192. doi: 10.1523/JNEUROSCI.23-06-02182.2003. [DOI] [PMC free article] [PubMed] [Google Scholar]
Associated Data
This section collects any data citations, data availability statements, or supplementary materials included in this article.
Supplementary Materials
Figure S1. Estimation of the slow IPSC during trains. The slow IPSC was estimated by blanking the fast component, and making the region between two successive stimuli equal to the average of the last 5 ms of that interval. (A) Representative IPSC recorded in a granule cell (black) overlayed with an estimate of the slow component (red). An expanded view of the event is shown on the right. (B) Depiction of the slow IPSC during trains. The total IPSC (black) for a 40 Hz train of stimuli is shown overlayed with the estimate of the slow component (red). These traces are integrated to determine charge transfer during the total IPSC and slow IPSC. A filtered version of this slow IPSC trace is shown overlayed with the total trains in Fig. 1 and Fig. 4. An expanded view of the first six events in the train is shown below.
Figure S2. Blockade of α6-containing GABAA receptors does not selectively block the slow IPSC. (A) Representative recording of the total IPSC recorded in a granule cell evoked by a train of 30 stimuli delivered at 50 Hz (upper, black trace) along with the slow IPSC (upper, white trace) in control conditions (10 μM NBQX, 5 μM CPP, 2 μM CGP 55845) and in the presence of 100 μM furosemide (lower, red, white traces). (B) Fast IPSCs from the trains in (A) are shown superimposed and baseline subtracted, for control conditions (upper, grey, traces) and furosemide (lower, light red traces). The average fast IPSC for control (upper, black trace) and furosemide (lower, dark red trace) are superimposed on the individual events in each condition. (C) Normalized integral of the total IPSC (solid line) and slow IPSC (dotted line) in control conditions (upper, black traces) and in furosemide (lower, red traces). (D) Summary plot of the effect of furosemide on the total integral of the IPSC (n=7 cells, grey traces) along with the average ±SEM (black trace). (E) Summary plot of the effect of furosemide on the fraction of the IPSC carried by the slow component (n=7 cells, grey traces) along with the average ±SEM (black trace).
Figure S3. Dynamic clamp conductances from AMPA and NMDA components of EPSC trains at the mossy fiber → granule synapse. (A, left) Representative one second trains of AMPA EPSCs evoked in a granule cell by extracellular mossy fiber stimulation at 10 – 200 Hz. Responses are shown normalized to the first EPSC. NMDA receptors were blocked by R-CPP (5 μM) and GABAA receptors were blocked with bicuculline (20 μM). Recordings were made at −60 mV. (A, right) Dynamic clamp conductances are shown for the corresponding frequencies. Conductances were generated by convolving a single event and amplitudes were estimated from exponential fits of EPSC depression observed in voltage clamp trains, and were check by integrating the entire train to determine total charge. (B, left) NMDA component of EPSC trains at the mossy fiber → granule cell synapse. Representative NMDA EPSCs evoked by extracellular mossy fiber stimulation trains at 10 – 200 Hz, shown normalized to the first EPSC. AMPA receptors were blocked by NBQX (10 μM) and GABAA receptors were blocked with bicuculline (20 μM). Recordings were made at −30 mV. (B, right) Dynamic clamp conductances are shown for the corresponding frequencies. Conductances were generated by convolving a single event and were check by integrating and comparing total charge.