

Abstract
Transcription initiation sites of the asparagine synthetase gene were investigated in human hepatoma cells after amino acid limitation by incubation in amino acid-complete minimal essential medium or medium lacking histidine. Cells incubated in complete minimal essential medium had mRNA transcripts with starting positions spanning across the 69 nucleotides immediately upstream of a previously designated transcription start site (+1), whereas the majority of mRNA transcripts started at nucleotide +1 in cells incubated in histidine-free medium. Similar results were obtained regardless of whether the analysis was by 5′ rapid amplification of cDNA ends or a ribonuclease protection assay. Low ASNS mRNA expression in amino acid-complete medium was associated with the wide range of initiation sites, whereas preferred alignment of the general transcription machinery at nucleotide +1, observed in the amino acid deprived condition, was associated with a concurrent increase in transcription activity. To our knowledge, these results are the first example in a mammalian cell of transcription start selection by nutrient availability.
Introduction
Amino acid availability modulates a number of fundamental steps of gene expression, including transcription factor recruitment, mRNA processing, and translation [for a review see (1)]. Transcription from specific genes is induced following amino acid deprivation of mammalian cells (2–4) and among these is asparagine synthetase (ASNS)2. The ASNS proximal promoter region contains 2 genomic enhancer elements, nutrient sensing response element-1 (NSRE-1) and NSRE-2, that together function as an amino acid response element to mediate induced ASNS transcription following amino acid limitation (5–7). Electrophoresis mobility shift analysis shows that there are multiple protein complexes containing activating transcription factor 4 (ATF4) and CCAAT enhancer binding protein-β (C/EBPβ) that recognize the NSRE-1 sequence (8,9), and that the DNA binding activity of these factors increases following amino acid limitation. Chromatin immuno-precipitation analysis revealed that, during amino acid deprivation, transcription factors ATF4, C/EBPβ, and ATF3 bind the amino acid response element region in a temporally sequential manner and that the transcriptional activation of the ASNS gene occurred following the recruitment of general transcription factors, such as transcription factor IIB (TFIIB) and RNA polymerase II (10).
Transcriptional activation in eukaryotes initiates when transcriptional activators are recruited and a preinitiation complex is formed on the promoter (11–13). Proper transcription initiation is one of the essential steps for efficient mRNA synthesis. Two previous studies on the human ASNS gene by independent laboratories have published conflicting results on the transcription start site of human ASNS. Zhang et al. (14) reported a single transcription start site and mapped it to a position 203 nucleotides (nt) upstream of the translation start site. In contrast, Greco et al. (15) simultaneously reported a genomic structure analysis of the human ASNS gene, but they observed multiple transcription start sites, spanning a 62-nt region, within the putative first exon as reported by Zhang et al. Greco et al. observed that the 5′-most transcription start site was 24 nt downstream from the one that Zhang et al. proposed. However, Greco et al. (15) also determined that the 3′-most transcription start site, 117 nt upstream of the translation start site, was the major transcription start site. Subsequent publications, including those from our laboratory (6,7), have designated this major transcription start site as +1. The +1 designation places many of the multiple transcription start sites reported by Greco et al. (15) in the proximal promoter region containing NSRE-1 (nt −68 to −60) and NSRE-2 (nt −48 to −43). The cells in the studies reported by both Zhang et al. (14) and Greco et al. (15) had been incubated in amino acid-complete culture medium. It is not clear what mechanisms are involved in the multiple transcription start site selection in cells influenced by this fed condition. In vivo footprinting data showed that NSRE-1 and NSRE-2 enhancers are already occupied by proteins, even under the amino acid–complete condition, but that amino acid deprivation induces further protein-DNA interaction (7). Therefore, under the amino acid–deprived condition, the proposed upstream transcription start sites proposed by Greco et al. (15) overlap with the NSRE-1 and NSRE-2 protein-binding sites.
The present studies were designed to extend the previous conflicting reports by determining the main transcription start site for the human ASNS gene after incubation of cells in either an amino acid–complete medium or a medium lacking an essential amino acid to activate transcription from the gene. Consistent with our previously published data (10), increased transcriptional activity and a net accumulation of ASNS mRNA occurred following histidine limitation. The transcription initiation site was analyzed by 2 independent methods, rapid-amplification of cDNA ends (RACE) and ribonuclease protection assay (RPA). Numerous transcription start sites, spread over a 70-nt region of the proximal promoter (nt −69 to +1), were evident when cells were cultured in amino acid–complete medium. Unexpectedly, amino acid deprivation caused a shift in the alignment of the transcriptional machinery such that a specific transcription start site (+1) was heavily favored.
Materials and Methods
Cell culture
Human HepG2 hepatoma cells were cultured in minimal essential medium (MEM), pH 7.4 (Invitrogen GIBCO), supplemented to contain 25 mmol/L NaHCO3, 4 mmol/L glutamine, 10 mg/L streptomycin sulfate, 100 mg/L penicillin G, 28.4 mg/L gentamycin, 0.023 mg/L N-butyl-p-hydroxybenzoate, and 5% (v:v) fetal bovine serum. Cells were maintained at 37°C in a 5% CO2 to 95% air incubator.
Cell treatment and RNA isolation
HepG2 cells were seeded on 60-mm dishes (2.5 × 10⁶ cells) for 24 h in amino acid–complete MEM, then the cells were transferred for 12 h to a fresh complete MEM or a histidine-free MEM (MEM –His), each supplemented with 5% dialyzed FBS. Total cellular RNA was isolated using an RNeasy Mini Kit according to the manufacturer’s procedure (QIAGEN).
Identification of transcription start sites by RACE
The FirstChoice RLM-RACE Kit (Ambion) was used to analyze transcription start sites for the ASNS gene. The kit uses RNA ligase-mediated RACE to selectively amplify 5′-capped RNA. Following a random-primed reverse transcription reaction, ASNS-specific transcripts were produced by nested PCR using the manufacturer’s primers corresponding to the 5′ adapter sequence and ASNS gene-specific primers (ASNS-5′ outer and ASNS-5′ inner). The gene-specific primers were: ASNS-5′ outer, 5′-CCATTG-TAACAGAGCCAC-3′, corresponding to nt +346 to +326 of the ASNS mRNA and ASNS-5′ inner, 5′-CATGGTGCAATGAAGCTATAA-3′, corresponding to nt +120 to +100 of the ASNS mRNA. For the nucleotide numbering throughout this article, the major transcription start site identified by Greco et al. (15) was designated +1. Samples from at least 2 independent 5′ RACE reactions were used for PCR. The amplified products from the nested PCR were then cloned using the TOPO TA Cloning kit (Invitrogen), and from each 5′ RACE PCR reaction, 50–60 clones were sequenced by the Interdisciplinary Center for Biotechnology Research Sequencing Core Facility at the University of Florida.
Mapping the transcription start sites by ribonuclease protection assay (RPA)
For a probe to be used in a RPA, an ASNS antisense riboprobe (nt −173 to +51) was synthesized with the MAXIscript-T7 kit (Ambion) and RPA was carried out using the RPA III kit (Ambion). Ten μg total RNA was hybridized overnight at 42°C with 2.5 × 10⁴ cpm of a 32P-labeled probe, according to manufacturer’s instructions, and then the sample was digested with 2.5 U RNase A and 100 U RNase T1 in 150 μL of RNase buffer by incubation at 37°C for 30 min. Ten μg yeast total RNA was used as a control for the ribonuclease digestion. Precipitated RNA was resolved on a 9% acrylamide · 8 mol · L−1 urea denaturing gel at 350 V for 3–4 h. After electrophoresis, the gel was exposed to Kodak X-ray film and quantification was performed using Un-Scan-It software (Silk Scientific).
Real-time quantitative RT-PCR
To measure the relative amount of ASNS mRNA, quantitative real-time RT-PCR (qRT-PCR) analysis was performed using a DNA Engine Opticon 2 system (MJ Research) and detection with SYBR Green I. The ASNS primers for amplification were: sense primer, 5′-GCAGCTGAAAGAAGCCCAAGT- 3′ and antisense primer, 5′-TGTCTTCCATGCCAATTGCA- 3′. The reactions were incubated at 50°C for 30 min followed by 95°C for 15 min to activate the Taq polymerase and amplification for 35 cycles at 95°C for 15 s, and at 60°C for 60 s. After PCR, melting curves were acquired by a stepwise increase of the temperature from 55°C to 95°C to ensure that a single product was amplified in the reaction. As the internal control, the β-actin mRNA level was measured at the same time. The primers for β-actin amplification were: sense primer, 5′-GCTCCTCCTGAGCGCAAGTATC - 3′ and antisense primer, 5′-GTGGACAGCGAGGCCAGGAT - 3′. PCR was performed in duplicate for each sample and samples were analyzed from at least 3 independent experiments. Means ± the SEM between conditions were compared by Student’s t test.
Transcriptional activity determination
Total RNA was treated with DNase I treatment using the procedures described in the Qiagen RNeasy Kit (Qiagen) to eliminate DNA contamination. To measure the transcription activity from the ASNS gene, primer sequences across the ASNS intron 12 and exon 13 boundary were used to measure the short-lived heterogeneous nuclear RNA (hnRNA). The primers for amplification were: sense primer, 5′-CCTGCCATTTTAAGCCATTTTGC- 3′ and anti-sense primer, 5′-TGGGCTGCATTTGCCATCATT- 3′. This protocol for measuring transcription activity is based on that described by Lipson and Baserga (16) except that, in our case, the hnRNA was assayed by qRT-PCR. Reactions without reverse transcriptase were performed as a negative control to rule out amplification from any residual genomic DNA, although these tests were always negative. The reactions were incubated at 50°C for 30 min followed by 95°C for 15 min to activate the Taq polymerase and amplification for 35 cycles at 95°C for 15 s, and at 58°C for 60 s. After the PCR, melting curves were acquired by a stepwise increase of the temperature from 55°C to 95°C to ensure that a single product was amplified in the reaction.
Results
We have previously shown that the transcription activity from the ASNS gene begins to increase within 45 min after histidine limitation and continues to rise to a peak of ~20 times the control value (10). To illustrate the difference in the ASNS transcription activity at this time point between amino acid–fed and amino acid–deprived HepG2 cells, the levels of heterogeneous nuclear RNA (hnRNA) were measured by qRT-PCR after an 8-h incubation in complete MEM or MEM –His. Given that introns are rapidly removed from hnRNA during splicing, this procedure has been shown to be a valid measure of transcription, similar to the data obtained by nuclear run-on analysis (16). An increase in ASNS transcription activity of 9 times the control value was observed (Fig. 1). When the steady-state ASNS mRNA accumulation was measured using the same samples, an elevated level was also observed, reaching a maximum of ~9 times the control. These data confirm our previous observation that induction of transcription substantially contributes to the increase in ASNS mRNA from histidine-deprived HepG2 cells (10).
Figure 1.

Analysis of ASNS steady-state mRNA content (A) and gene transcription activity (B) in HepG2 hepatoma cells following histidine deprivation for 8 h. Values are means ± SEM, n = 3 independent experiments with each sample was measured in duplicate.
To determine the 5′ end of the ASNS transcripts, RNA was isolated from HepG2 cells incubated for 12 h in either complete MEM or MEM –His and then subjected to 5′ RACE analysis. Electrophoresis of the RT-PCR products showed 2 major bands (Fig. 2), one of which was rather broad (MEM-upper), suggesting a possible heterogeneity of transcription start sites. Quantification of the bands by densitometry showed that, in cells incubated in complete MEM, the longer products (the broad band termed the “upper-band”) represented 77% of the total RT-PCR products (i.e., both bands). Interestingly, histidine deprivation resulted in a shift in the preference for the transcription initiation site causing the shorter product (a sharp band termed the “lower-band”) to be predominant, which represented 71% of the total products under the MEM –His condition. The total reaction pool of RT-PCR products (both bands) from either the MEM or MEM –His-incubated cells were used to generate cDNA clones, and 53 individual clones from the MEM-derived cells and 55 individual clones from the MEM –His-derived cells were randomly chosen and sequenced (Fig. 3). Within the MEM-derived RNA, 15 different transcription start sites were represented, but only 14 of 53 (26%) of the clones sequenced began at the +1 nucleotide previously identified by Greco et al. (15). In keeping with that original report, we referred to this nucleotide as +1 in previous publications from our laboratory and continue to use that designation throughout this article as well. In contrast, this +1 nucleotide was used as the transcription start site in 35 of 55 clones (64%) sequenced from the –His-derived RNA.
Figure 2.
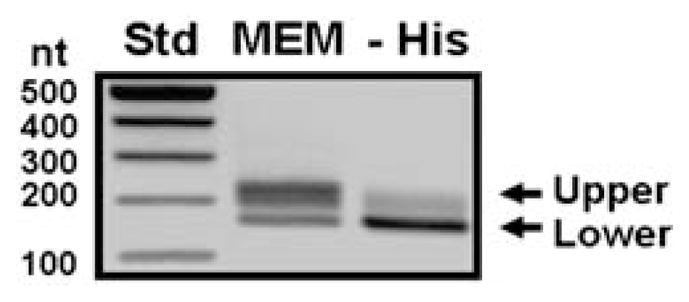
The 5′ RNA ligase-mediated rapid amplification of cDNA ends (5′ RACE) assay was used to analyze transcription start sites for the ASNS gene in HepG2 hepatoma cells after histidine deprivation for 12 h. A representative gel image of a RACE analysis is labeled to show the broad upper (MEM) and sharper lower (MEM –His) bands that were analyzed by densitometry to obtain the percentage values given in the text.
Figure 3.

Sequences of ASNS 5′ RACE products randomly cloned from total RNA isolated from HepG2 cells lacking histidine for 12 h. Sequences representing 1–3 clones are shown by a black line, 4–10 clones by a gray box, and ≥10 clones by a black box. The number of clones is shown to the left of each sequence. The locations of NSRE-1, NSRE-2, the TATA box, and the major +1 transcription start site identified by Greco et al. (15) are shown in the diagram.
To verify the distribution of mRNA species within the products generated from 5′ RACE, a second series of experiments were performed in which the primary PCR products were first separated by gel electrophoresis and then each band was purified for cloning and sequencing (Fig. 4). Twenty-three clones from either the upper (MEM band) or lower (–His band) band were sequenced. Results showed that the MEM band represented transcripts with transcription initiation sites from nt −63 to −18, whereas the –His band contained a majority of transcripts starting from +1. These results are consistent with the random cloning from the total pool shown in Fig. 3.
Figure 4.

Sequencing of 5′ RACE products prepared from gel-purified bands representing the 2 primary ASNS mRNA populations shown in Figure 2. The locations of NSRE-1, NSRE-2, the TATA box, and the major +1 transcription start site identified by Greco et al. (15) are shown in the diagram. Sequences representing 1–3 clones are shown by a black line, whereas the lone sequence showing >3 clones is shown by a black box. The number of clones is shown to the left of each sequence.
To analyze the selectivity for the transcription start site by a completely independent approach, a ribonuclease protection assay (RPA) was performed using RNA samples from cells incubated in either MEM or MEM –His collected at 1–12 h (Fig. 5A). The control lane (labeled “C”) shows the completeness of ribonuclease digestion, and the undigested probe (lane labeled “P”) was also run to show the size of the full-length probe. The collection of transcripts that resulted from initiation sites 5′ upstream from +1 are referred to as the upstream transcripts. The results from the RPA confirmed a wide spectrum of transcription start sites in the upstream transcripts, and also illustrated the increase in the transcription activity starting at 2 h after histidine depletion (Fig. 5A). Results for the samples from 1 and 12 h were quantified by densitometry and are shown in Fig. 5B. ASNS mRNA from cells incubated in MEM did not show much change in abundance between 1 and 12 h, regardless of the transcription start sites. Likewise, transcripts that started from upstream sites did not show a large change following histidine limitation (Fig. 5B, open portion of the bars). In contrast, the abundance of the transcripts that initiated at nt +1 was increased by >9-fold in cells deprived of histidine for 12 h compared with MEM incubated cells (Fig. 5B, filled portion of the bars). Quantification of the upstream vs. +1 transcripts docu-ented that after histidine limitation for 12 h, ASNS mRNA species that began at +1 represented 72% of the total transcripts, in agreement with the 5′ RACE data.
Figure 5.

Mapping transcription start sites for the human ASNS gene by a ribonuclease protection assay (RPA). Panel A shows a representative gel and the areas of the lanes that were quantified for panel B are indicated by the bracket (upstream mRNA) and the arrow (+1). The control lane, C, shows the completeness of the ribonuclease digestion with yeast RNA; and the lane labeled P shows the undigested probe. Panel B represents the quantification of band intensity from the gel shown in panel A. The open portion of the bars represents the combined intensity of all the bands in the upstream mRNA (bracket in panel A) and the closed portion of the bars represents quantification of the band (arrow in panel A) that corresponds to mRNA starting at the +1 nucleotide.
Discussion
In the present study, 2 independent methods demonstrated that the low level of basal transcription that occurs from the human ASNS gene, in cells in nutritionally complete medium, initiates at multiple sites within the −69 to +1 region of the proximal promoter with only ~25% of the transcripts initiating at the +1 site. Interestingly, activation of the gene by amino acid deprivation triggers the transcriptional machinery to favor a specific nucleotide, designated as +1, as the initiation site. This alignment of the initiation site at the +1 site coincides with a substantial increase in the overall transcription activity.
There are many reports showing the existence of multiple transcription initiation sites for a particular gene, but only a few examples of stimulus-modified initiation. Recently, Howcroft et al. (17) reported that the major histocompatibility complex class I gene is transcriptionally regulated by 2 independent pathways during either basal or activated conditions. The authors propose that the 2 pathways recruit 2 different transcription factor complexes and consequently initiate transcription at 2 different regions within the core promoter. The basal transcription initiation is determined by the interaction between upstream stimulatory factor 1 and TBP associated factor II-250, but after activation, transcription initiates at a different cluster of start sites and is independent of TBP associated factor II-250 (17). Although the ASNS gene is the first example of nutrient availability modulating the transcription start site for a mammalian gene, an example exists in the methylotropic yeast Hansenula polymorpha. In this organism, the methanol oxidase gene, MOX, is transcribed from 2 different transcription start sites under the repressed and the derepressed conditions. A shift from glucose-containing medium to glycerol or methanol medium causes repression of the longer transcript and a strong activation from the initiation site that produces the shorter mRNA (18). The shorter mRNA is then efficiently translated into the functional MOX protein, which aids the cell in avoiding toxic levels of hydrogen peroxide.
Transcription initiation site selection is associated with cis-elements such as a TATA-box, an initiator sequence (Inr), or a TFIIB-responsive element (13,19). Mechanistic studies have identified TBP, TFIIB, TFIIF, and RNA polymerase II, as the major factors interacting with these DNA sequences and with each other during the transcription start site selection process (12,20). TFIIB binding influences the positioning of RNA polymerase II and thereby influences the transcription initiation site (21), and ChIP analysis of the ASNS gene has documented that TFIIB binding at the proximal promoter region is enhanced following amino acid limitation (10). The human ASNS gene has a prototypical TATA-box and a conserved Inr element. The increased binding of TBP following amino acid deprivation may also allow for the preinitiation complex to interact with the TATA-box in the ASNS promoter (10). Therefore, a regulatory mechanism for transcription start site selection may be activated during amino acid limitation. During the fed state, the ASNS gene, like many so-called housekeeping genes, exhibits a casual transcription start site determination. However, in response to amino acid limitation, binding of ATF4 and other NSRE1/NSRE2 binding proteins may direct recruitment of the general transcription/chromatin remodeling machinery and subsequently help assemble the preinitiation complex on the promoter in a selective and sequence-specific manner. The result is that the preinitiation complex preferentially assembles at the +1 site and a much higher rate of transcription is observed. Actual measurements of the transcription activity from the ASNS gene support this interpretation (Fig. 1). Another possibility is that occupation of NSRE1 or NSRE2 by ATF4 and other transcription factors may simply sterically block the less-efficient upstream start sites. However, the argument for steric hindrance is weakened by the observation that the NSRE1/NSRE2 enhancer is position-independent and can be moved further upstream or downstream of the promoter while continuing to mediate the increase in transcription (22).
To our knowledge, the present data represent the first demonstration in a mammalian cell that nutrient availability can modify the site of assembly of the transcription initiation machinery. The results also add to the breadth of steps, from DNA to RNA to protein, which are regulated by amino acid availability (1). How these control mechanisms, at multiple steps of protein expression, are coordinated during amino acid limitation, represents an interesting avenue for future investigation.
Footnotes
This research was supported by grants to M.S.K. from the Institute of Diabetes, Digestive, and Kidney Diseases, the NIH (DK-52064, DK-70647).
Abbreviations used: ATF, activating transcription factor; ASNS, asparagine synthetase; MEM, minimal essential medium; MEM –His, MEM lacking histidine; NSRE, nutrient sensing response element; nt, nucleotide; RACE, rapid amplification of cDNA ends; RPA, ribonuclease protection assay; TBP, TATA binding protein; TF, transcription factor.
Literature Cited
- 1.Kilberg MS, Pan YX, Chen H, Leung-Pineda V. Nutritional control of gene expression: how mammalian cells respond to amino acid limitation. Annu Rev Nutr. 2005;25:59–85. doi: 10.1146/annurev.nutr.24.012003.132145. [DOI] [PMC free article] [PubMed] [Google Scholar]
- 2.Fafournoux P, Bruhat A, Jousse C. Amino acid regulation of gene expression. Biochem J. 2000;351:1–12. doi: 10.1042/0264-6021:3510001. [DOI] [PMC free article] [PubMed] [Google Scholar]
- 3.Kilberg MS, Barbosa-Tessmann IP. Genomic sequences necessary for transcriptional activation by amino acid deprivation of mammalian cells. J Nutr. 2002;132:1801–4. doi: 10.1093/jn/132.7.1801. [DOI] [PubMed] [Google Scholar]
- 4.Kilberg MS, Zhong C, McClellan R, Pan Y-X. Transcriptional regulatory mechanisms for the response to amino acid deprivation of mammalian cells. 2004. pp. 5–24. [Google Scholar]
- 5.Barbosa-Tessmann IP, Pineda VL, Nick HS, Schuster SM, Kilberg MS. Transcriptional regulation of the human asparagine synthetase gene by carbohydrate availability. Biochem J. 1999;339:151–8. [PMC free article] [PubMed] [Google Scholar]
- 6.Barbosa-Tessmann IP, Chen C, Zhong C, Schuster SM, Nick HS, Kilberg MS. Activation of the unfolded protein response pathway induces human asparagine synthetase gene expression. J Biol Chem. 1999;274:31139–44. doi: 10.1074/jbc.274.44.31139. [DOI] [PubMed] [Google Scholar]
- 7.Barbosa-Tessmann IP, Chen C, Zhong C, Siu F, Schuster SM, Nick HS, Kilberg MS. Activation of the human asparagine synthetase gene by the amino acid response and the endoplasmic reticulum stress response pathways occurs by common genomic elements. J Biol Chem. 2000;275:26976–85. doi: 10.1074/jbc.M000004200. [DOI] [PubMed] [Google Scholar]
- 8.Siu F, Bain PJ, LeBlanc-Chaffin R, Chen H, Kilberg MS. ATF4 is a mediator of the nutrient-sensing response pathway that activates the human asparagine synthetase gene. J Biol Chem. 2002;277:24120–7. doi: 10.1074/jbc.M201959200. [DOI] [PubMed] [Google Scholar]
- 9.Siu FY, Chen C, Zhong C, Kilberg MS. CCAAT/enhancer-binding protein beta (C/EBPb) is a mediator of the nutrient sensing response pathway that activates the human asparagine synthetase gene. J Biol Chem. 2001;276:48100–7. doi: 10.1074/jbc.M109533200. [DOI] [PubMed] [Google Scholar]
- 10.Chen H, Pan YX, Dudenhausen EE, Kilberg MS. Amino acid deprivation induces the transcription rate of the human asparagine synthetase gene through a timed program of expression and promoter binding of nutrient-responsive bZIP transcription factors as well as localized histone acetylation. J Biol Chem. 2004;279:50829–39. doi: 10.1074/jbc.M409173200. [DOI] [PubMed] [Google Scholar]
- 11.Naar AM, Lemon BD, Tjian R. Transcriptional coactivator complexes. Annu Rev Biochem. 2001;70:475–501. doi: 10.1146/annurev.biochem.70.1.475. [DOI] [PubMed] [Google Scholar]
- 12.Smale ST, Kadonaga JT. The RNA polymerase II core promoter. Annu Rev Biochem. 2003;72:449–79. doi: 10.1146/annurev.biochem.72.121801.161520. [DOI] [PubMed] [Google Scholar]
- 13.Taatjes DJ, Marr MT, Tjian R. Regulatory diversity among metazoan co-activator complexes. Nat Rev Mol Cell Biol. 2004;5:403–10. doi: 10.1038/nrm1369. [DOI] [PubMed] [Google Scholar]
- 14.Zhang YP, Lambert MA, Cairney AEL, Wills D, Ray PN, Andrulis IL. Molecular structure of the human asparagine synthetase gene. Genomics. 1989;4:259–65. doi: 10.1016/0888-7543(89)90329-7. [DOI] [PubMed] [Google Scholar]
- 15.Greco A, Gong SS, Ittmann M, Basilico C. Organization and expression of the cell cycle gene, ts 11, that encodes asparagine synthetase. Mol Cell Biol. 1989;9:2350–9. doi: 10.1128/mcb.9.6.2350. [DOI] [PMC free article] [PubMed] [Google Scholar]
- 16.Lipson KE, Baserga R. Transcriptional activity of the human thymidine kinase gene determined by a method using the polymerase chain reaction and an intron-specific probe. Proc Natl Acad Sci USA. 1989;86:9774–7. doi: 10.1073/pnas.86.24.9774. [DOI] [PMC free article] [PubMed] [Google Scholar]
- 17.Howcroft TK, Raval A, Weissman JD, Gegonne A, Singer DS. Distinct transcriptional pathways regulate basal and activated major histocompatibility complex class I expression. Mol Cell Biol. 2003;23:3377–91. doi: 10.1128/MCB.23.10.3377-3391.2003. [DOI] [PMC free article] [PubMed] [Google Scholar]
- 18.Genu V, Godecke S, Hollenberg CP, Pereira GG. The Hansenula polymorpha MOX gene presents two alternative transcription start points differentially utilized and sensitive to respiratory activity. Eur J Biochem. 2003;270:2467–75. doi: 10.1046/j.1432-1033.2003.03618.x. [DOI] [PubMed] [Google Scholar]
- 19.Smale ST. Transcription initiation from TATA-less promoters within eukaryotic protein-coding genes. Biochim Biophys Acta. 1997;1351:73–88. doi: 10.1016/s0167-4781(96)00206-0. [DOI] [PubMed] [Google Scholar]
- 20.Lemon B, Tjian R. Orchestrated response: a symphony of transcription factors for gene control. Genes Dev. 2000;14:2551–69. doi: 10.1101/gad.831000. [DOI] [PubMed] [Google Scholar]
- 21.Fairley JA, Evans R, Hawkes NA, Roberts SG. Core promoter-dependent TFIIB conformation and a role for TFIIB conformation in transcription start site selection. Mol Cell Biol. 2002;22:6697–705. doi: 10.1128/MCB.22.19.6697-6705.2002. [DOI] [PMC free article] [PubMed] [Google Scholar]
- 22.Zhong C, Chen C, Kilberg MS. Characterization of the nutrient sensing response unit in the human asparagine synthetase promoter. Biochem J. 2003;372:603–9. doi: 10.1042/BJ20030076. [DOI] [PMC free article] [PubMed] [Google Scholar]