Abstract
CD81 is an integral membrane protein belonging to the tetraspanin superfamily. It has two extracellular domains that interact with cell surface proteins and two intracellular tails that contribute to cellular processes. Although there are considerable data about how CD81 affects T- and B-cell function, not much is known about how it impacts macrophages. To address this, we established four cell lines from mouse bone marrow in the presence of macrophage colony stimulating factor and transfection with SV40 large T antigen. Two were CD81−/− (ASD1 and ASD2) and two were CD81+/− (2ASD1.10 and 2BSD1.10). Cells were Mac-2-, PU.1-, and c-fms-positive and all the cell lines were phagocytic indicating that they were macrophage-like. In mixtures of the two cell types in tissue culture, CD81−/− cells out competed CD81+/− cells with CD81-bearing cells being undetectable after 50 cell culture passages. Although cell divisions during log-phase growth were not significantly different between CD81+/− macrophage cells and CD81−/− macrophage cells, we found that CD81−/− macrophage cells reached a higher density at confluency than CD81+/− macrophage cells. CD81 transcript levels increased as cultures became confluent, but transcript levels of other tetraspanin-related molecules remained relatively constant. Transfection of CD81 into ASD1 (CD81−/−) cells reduced the density of confluent cultures of transformants compared to cells transfected with vector alone. These data suggest that CD81 potentially plays a role in macrophage cell line growth regulation.
Keywords: Monocytes/Macrophages, Cell Surface Molecules, Cell Proliferation, CD81
INTRODUCTION
CD81 is a 26-kDa cell-surface protein that is widely expressed across kingdoms and contributes to a variety of biological responses. CD81 shares about 60% protein sequence identity among various species and it is unique among tetraspanins because it is not glycosylated (Levy et al., 1998). These molecules span the plasma membrane 4 times (tetraspanins) and most of the sequence variation is in the large extracellular loop. The small extracellular loop and the cytoplasmic and transmembrane domains are highly conserved (Fernandez-Sesma et al., 1998).
CD81 is expressed in all cell types, excluding red blood cells and platelets. Although ubiquitous, CD81 molecules have cell-type specific functions. On B cells, CD81 functions as part of the B cell co-receptor complex, which consists of CD21, CD19, and Leu13 (an interferon inducible antigen) (Fearon and Carter, 1995). CD21 (also known as CR2) is a receptor for complement component C3d. Upon engagement the co-receptor complex cross-links with the B cell receptor, thereby reducing the threshold for B cell activation (Levy et al., 1998). The absence of CD81 prevents the formation of this molecular complex (Shoham et al., 2003). Maecker and Levy (Maecker and Levy, 1997) found that CD19 expression was also reduced in mice lacking CD81, but these mice developed normal B cells.
On T cells, CD81 associates with CD4 and CD8. The cell-cell adhesiveness of thymocytes is regulated by a signal derived from CD81 through activation of the integrin, LFA-1, also known as CD18/CD11a. The selection of T cells requires the MHC-peptide recognized by CD4 and CD8 along with molecules such as CD18/CD11a to form the T cell receptor (TCR)/CD3 complex (Mittelbrunn et al., 2002; Todd et al., 1996). Once assembled, this complex works with CD3 to provide co-stimulatory signaling.
The role of CD81 in macrophage function is less clearly defined. In the absence of both CD81 and CD9, macrophages form giant cells when stimulated with concanavalin A (Takeda et al., 2003). Osteoclastogenesis was also higher compared to normal mice (Takeda et al., 2003). Therefore, there are some suggestions that CD81 affects macrophage function. To test this hypothesis, we generated macrophage cell lines from CD81 knock-out mice and heterozygous littermates. In this report, we detail the creation of these cell lines and document that CD81 expression regulates their growth.
MATERIALS AND METHODS
Mice
C.129-cd81TM1 mice were a generous donation by S. Levy (Stanford University Medical Center, CA) (Maecker and Levy, 1997). These mice were maintained on the Balb/c background by brother-sister crosses of homozygous CD81-negative males and heterozygous CD81 females because of infertility/low fecundity of homozygous CD81 females (Rubinstein et al., 2006). All offspring were genotyped for CD81 alleles as described below. Mice were maintained and reared in the animal facility of the Division of Biology at Kansas State University with approval and monitoring by the Institutional Animal Care and Use Committee.
Reagents
Dulbecco's Modified Eagle's Medium (DMEM) (Atlanta Biologicals, Lawerenceville, GA) was supplemented with 1% Nu Serum (Collaborative Biomedical Products, Bedford, MA), 1% Fetal Bovine Serum (FBS) (Atlanta Biologicals), and 10% Opti-MEM reduced Serum Medium (Invitrogen, Carlsbad, CA) (DMEM2). Biomedium was made from DMEM2 with an additional 50 μg per ml gentamycin (Atlanta Biologicals), 1.5 ng per ml Recombinant mouse macrophage colony stimulating factor (M-CSF; R & D Systems, Minneapolis, MN), and 10% LM929 supernatant. Phosphate buffered saline (PBS): 0.8% NaCl, 0.002% KH2PO4, 0.02% KCl, 0.115% NaHPO4 anhydrous, pH 7.35. ACK lysing buffer reagent: 0.15 M NH4Cl, 10 mM KHCO3, and 0.1 mM Na2EDTA were also used in this study.
The TNF-sensitive fibroblast cell line LM929 was obtained from the American Type Culture Collection (CCL1.2, Rockville, MD). It was maintained in DMEM2 and was passaged 2–3 times weekly. The supernatant from this cell line contains M-CSF (Armstrong et al., 1995) and was used to induce and maintain bone marrow macrophages in culture. Derived macrophage cell lines (i.e., ASD1, ASD2, 2ASD1.10, and 2BSD1.10) were maintained at 37° C in 8% CO2 in 60- or 100-mm dishes and passaged at confluency.
Cells were dispersed using standard passaging methods (Beharka et al., 1998). Solutions were tested and confirmed to be free of endotoxin using the Limulus Ameobocyte Lysate Assay (Associated of Cape Cod, Inc., East Falmouth, MA).
Peritoneal exudate macrophages were induced by intraperitoneal injection of 1.5 ml of sterile, 2.9% thioglycollate (DIFCO, Detroit, MI). Four days after injection, mice were anesthetized by Halothane (Halocarbon, Riveredge, NJ) inhalation and were euthanized by cervical dislocation. Peritoneal exudate macrophages were collected from euthanized mice by washing the peritoneal cavity twice with 12 ml of ice cold PBS.
Genotyping
Mice were genotyped using tail DNA and confirmed for all experimental animals from liver DNA obtained from the animal at the time of sacrifice. To obtain DNA for genotyping, 3 mm of tail was removed and digested as per manufacturer's instructions (DirectPCR (Tail), Viagen Biotech, Los Angeles, CA). The digested samples containing the DNA were stored at 4° C until analyzed by standard PCR methodologies.
The primers used were specific for sequences in the sixth and seventh exon of CD81 (Table 1) (Maecker and Levy, 1997). Primers specific for neo were used to detect the presence of the neo gene (Table 1). Primers specific for the 14S ribosomal protein gene (Rhoads and Roufa, 1985) were used to assess the quality of the DNA sample for instances where neo- or CD81-specific PCR reactions were negative (Table 1). The amplicons, loaded in tandem, were detected in ethidium bromide-(Ethidium Bromide Tablets, 10 mg, MidSci., St. Louis, MO) stained 1.5% agarose (Agarose, Low EEL, Fisher Scientific) gels (Table 1).
Table 1.
Primers used to identify gene expression by PCR, reverse transcriptase-PCR or quantitative real time reverse transcriptase-PCR
| Gene name | Amplicon Size (RT-PCR) | GenBank Accession # | Primer: Sense 5'→ 3' | Primer: Antisense 5'→ 3' |
|---|---|---|---|---|
| S14 | 402 bp | M11241 | CAATCCGCCCAATCTTCATCCC | GACGACGTTCAGAAATGGCACC |
| Neo | 254 bp | U02434 | CCATGATATTCGGCAAGCAGGCAT | ATCCATCATGGCTGATGCAATGCG |
| CD81 | 542 bp | NC 000073 | CTCAACTGTTGTGGCTCCAAC | CCAATGAGGTACAGCTTCCC |
| β-actin | 600 bp | NM 007393.1 | ATGGATGACGATATCGCT | ATGAGGTAGTCTGTCAGGT |
| SV40 T | 209 bp | NC 001669 | GGAAAGTCCTTGGGGTCTTC | CTGACTTTGGAGGCTTCTGG |
| Gene name | Real Time Probe (qRT-PCR) | GenBank Accession # | Primer: Sense 5'→ 3' | Primer: Antisense 5'→ 3' |
|---|---|---|---|---|
| S14 | 5'-/56-FAM/TGGGCATCACTGCCCTGCATATCAAA/3IAblkFQ/-3' | M11241 | ATGAAGGTGAAGGCTGACCGAGA | TGACATCCTCAATCCGCCCAATCT |
| EWI-2 | 5'-DFAM/CTGAGTGGATTCAGGATCCT/DTAM | NM 080419 | ACTGATCGGTACCGAATGGT | CTGCACATCAACATGAGCCA |
| TSP2 | 5V56-FAM/AGACAGGGCAAGAGGAAATGGAAC/3BHQ_1/-3' | BC007185 | GAAGGATTTATCATCAGAGGACAAG | CTGGGAGCTCCTTTGGACACGTGG |
| CD81 | 5V56-FAM/TGCCTTGTGATCCTGTTTGCCTGTGA/3BHQ_1/-3'. | NM 133655.1 | TGCTGTACCTGGAACTGGGAAACA | TTGCTGAAGGGCCTGGTCATAGAA |
Differentiation of Bone Marrow Macrophages
Bone marrow cells were isolated from long bones (femora, tibiae and humerii) as previously described (Armstrong et al., 1993). The undifferentiated cells were resuspended in Biomedium, counted and 3 to 5 × 10⁶ cells were plated per 100-mm dish. Cells were incubated at 37° C in 8% CO2 and passaged for up to 7 times but after multiple attempts, spontaneous immortalization did not occur as described for the C2D macrophage cells (Beharka et al., 1998). Therefore, bone marrow cells were then transformed with SV40 large T antigen to create immortalized cell lines.
Transfection of Bone Marrow Macrophages and Detection of SV40 Large T Antigen
Bone marrow macrophages were incubated for one week at 37° C in 8% CO2 in Biomedium. Transfection was performed on cells between 50% and 75% confluency with SV40 large T antigen (Beharka et al., 1998; Janabi et al., 1995). Cells were carefully washed with 2 to 3 ml of saline and the monolayer was covered with 3 ml of serum-free DMEM. In a 1.5 ml centrifuge tube, 193 μl of serum-free medium was mixed with 3 μl of Fugene 6 Transfection Reagent (R F. Hoffmann-La Roche Ltd, Basel, Switzerland). The mixture was vortexed and incubated at room temperature for 5 minutes before adding 5 μg of pSV3-SV40-T antigen plasmid DNA (0.5 μg per μl) and again vortexed. The mixture was incubated at room temperature for 20 minutes and the entire contents of the tube were added to the plated cells. The cells were incubated at 37° C in 8% CO2 for 24 hours before 2 ml of Biomedium were added. Three days after transfection, the cells were returned to a normal culturing regimen (splitting 2–3 times per week).
Cells were assessed for T antigen expression by RT-PCR using the Access RT-PCR Kit (Promega).
Limiting Dilution Cloning of Cell Lines
Cells were dispersed with trypsin/EDTA, pelleted and were resuspended in DMEM2. The cells were counted, and each dilution was plated in 48 wells of a Costar 96-well, flat-bottom tissue culture plate. A 1:10 serial dilution was generated starting at 1000 cells/well in 100 μl DMEM2 and ending at 0.01 cell/well. Cells were then incubated at 37° C in 8% CO2. Only clones that grew from dilutions having less than a 30% positive rate were selected and expanded.
Phagocytosis Assays
Peritoneal exudate macrophages were recovered, washed in medium, counted, and plated at 1 × 10⁶ cells per well of 24-well tissue culture plates (Corning Costar, 3524). The peritoneal macrophages were incubated for 2 hours at 37° C in 8% CO2. For the cell line macrophages, cells were plated at 5 × 10⁵ cells per well and incubated at 37° C in 8% CO2 overnight so that there would be 1 × 10⁶ cells for the assay. Negative controls were incubated at 4° C while experimental samples were kept at 37° C for two hours. Cytochalasin D from Zygosporium mansonii (Sigma Aldrich, St. Louis, MO) was then added to the cold negative control plate to additionally inhibit phagocytosis. Twenty five μl of red fluorescent polystyrene beads (diameter, 0.86 μm, Duke Scientific Corporation, Fremont, CA) were added to each well. Phagocytosis was stopped after 20 min by centrifuging the 24-well plates at 350 × g for 5 minutes, removing the supernatant, and dispersing the cells with 500 μl of trypsin/EDTA. The trypsin action was stopped by adding double the volume of PBS and transferring the suspended cells to 12 × 75 mm polystyrene tubes (Falcon). Cells were centrifuged for 5 minutes at 350 × g and the supernatant was removed from the pellet. The cells were washed two additional times with 2 ml of PBS to remove free beads and suspended in 200 μl of 2% formalin/PBS. The cells were placed on ice and phagocytosis was assessed by flow cytometry using a FACS Caliber analytical flow cytometer (Becton Dickson, San Jose, CA) measuring 10,000 events for each sample. Data analysis was performed with WinList software (Verity Software House, Topsham, ME). Cells with fluorescent beads were analyzed against cells with cold treatment, fluorescent beads, and cytochalasin D treatment. The percent phagocytosis in the experimental groups was assessed after subtracting the percent positively stained cells in the negative control treatment group.
Antibody Phenotyping of Macrophage Cell Lines and Flow Cytometry
ASD1, ASD2, 2ASD1.10, and 2BSD1.10 cells were phenotyped using fluorescent antibody as was previously described (Potts et al., 2008) using the predetermined optimal concentration of primary or isotype antibodies for an hour on ice (Table 2). Samples were analyzed by flow cytometry as described for phagocytosis. Percent expression in the experimental samples was determined after subtracting the background staining from its respective negative isotype control.
TABLE 2.
Antibodies used in flow cytometry.
| 1° Antibody (fluorochrome) | Amount | 2°/Isotype Antibody (fluorochrome) | Amount |
|---|---|---|---|
| CD31 (FITC)a | 1.0 μg/50 μl | Rat IgG2a (FITC)a | 1.0 μg/50 μl |
| Mac-2 (FITC)b | 7.0 μg/50 μl | Rat IgG2a (FITC)a | 7.0 μg/50 μl |
| ER-MP20 (FITC)c | 0.5 μg/50 μl | Rat IgG2a (FITC)a | 0.5 μg/50 μl |
| ER-MP58c | 5.4 μg/50 μl | Goat anti Rat IgM (FITC)d | 0.3 μg/50 μl |
| F4/80 (FITC)a | 0.6 μg/50 μl | IgG2a (FITC)a | 0.6 μg/50 μl |
| EAT2 (CD81)e | 2.0 μg/50 μl | Hamster IgG/Goat anti hamster (FITC)d | 0.3 μg/50 μl |
| CD11b (PE)a | 0.1 μg/50 μl | Rat IgG2b (PE)a | 0.1 μg/50 μl |
| CD11c (PE)a | 0.4 μg/50 μl | Armenian Hamster IgG (PE)a | 0.4 μg/50 μl |
| Gr-1 (ly6G) (PE)a | 0.04 μg/50 μl | Rat IgG2b (PE)a | 0.04 μg/50 μl |
| CCR2-purifiedf | 5.0 μg/50 μl | Goat anti rabbit IgG (FITC)d | 0.03 μg/50 μl |
| PU.1-purifiedf | 5.0 μg/50 μl | Goat anti rabbit IgG (FITC)d | 0.03 μg/50 μl |
| cfms-purifiedf | 5.0 μg/50 μl | Goat anti rabbit IgG (FITC)d | 0.03 μg/50 μl |
| c-fos-purifiedf | 3.0 μg/50 μl | Goat anti rabbit IgG (FITC)d | 0.03 μg/50 μl |
| CD45R (B220) (PE)a | 0.5 μg/50 μl | IgG2a (PE)a | 0.5 μg/50 μl |
Antibodies were purchased from eBioscience, San Diego, CA
Antibodies were purified from hybridomas obtained from the American Type Culture Collection.
Antibodies were obtained from Biomedicals AG, Switzerland.
Antibodies were obtained from MP Biomedicals, Solon, OH.
Antibodies were purified from hybridomas obtained from S. Todd, Kansas State University.
Antibodies were obtained from Santa Cruz, Santa Cruz, CA.
Assessment of Cell Growth
To determine cell growth, cells were dispersed, counted and plated in a Costar 96-well, flat-bottom tissue culture plate at 1000 cells per well in 100 μl DMEM2. Cells were then incubated at 37° C in 8% CO2. At 1, 24, 48, 72, 96, and 120 hours, 100 μl of 3-(4, 5-dimethylthiazol-2-yl)-2, 5-diphenyl tetrazolium bromide (MTT) were added to quadruplicate wells of each cell line. Formazin was dissolved by adding 100 μl of IsoPBS (66.649% isopropyl alcohol, 33.324% PBS, 0.027% 5N HCl) to the wells to dissolve the crystals. Absorbance was read at 570 nm using a microtiter plate spectrophotometer (Packard Bioscience and Instrument Company, Inc., Spectra Count Plate Reader Version 3.0).
Cells numbers were also enumerated directly using a hemacytometer. 5 × 10⁴ cells were seeded into wells of a 24-well plate. The following day and each test day thereafter, the medium was aspirated from triplicate wells and the cells were washed with 1 ml PBS. The cells were dispersed for enumeration on a hemacytometer. Viability was assessed with trypan blue (Sigma).
Cloning Mouse CD81
The mouse gene for CD81 was obtained by RT-PCR of total RNA from 2ASD1.10 cells and cloned into the pcDNA3.1/Hygro vector (Invitrogen). The forward primer included a NheI restriction site (underlined) 5'-TTTGCTAGCCATGGGGGTGGAGGG and the reverse primer included an XhoI restriction site (underlined) 5'-TTTCTCGAGTCAGTACACGGAGCTG (IDT, Integrated DNA Technologies, Coralville,IA).
Transfection of ASD1 cells with CD81
One μg of the pCDNA3.1/Hygro vector with and without the CD81 gene was linearized by Bgl II restriction. Linearized DNA was allowed to complex with 6 μl of lipofectamine 2000 (Invitrogen) in 600 μl of serum-free Opti-MEM for 15 min at room temperature. 5 × 10⁵, pelleted, ASD1 cells were resuspended in 500 μl of the complexed DNA medium. The cells were incubated at room temperature for 20 min with occasional pipetting to keep the cells in suspension. The cells were transferred to a well in a 6-well plate, 500 μl of serum-free Opti-MEM added and the cells were incubated overnight at 37°C. The following day, 2 ml of DMEM2 were added and the cells were returned to the incubator. After a two day incubation/recovery period, hygromycin B (InvivoGen, San Diego, CA) was added directly to the medium to a final concentration of 5 mg per ml. Selection was done for 2 days and the remaining viable cells were washed free of the antibiotic and 3 ml of fresh DMEM2 medium was added. When the remaining cells began to grow, the antibiotic was reapplied for 2 days before cloning by limiting dilution under selective conditions to establish stable tranfectants.
Real-time RT-PCR
The primers and probes for quantitative real-time RT-PCR for 14S ribosomal protein RNA, TSP2, CD81 (IDT), and EWI-2 (Sigma) are listed in Table 1. The RNA concentration was adjusted to 100 ng per 5μl in RNase-free H2O containing 1 μl RNasin per 50μl (40 U per μl, Promega). Each RT-PCR reaction received 5μl or 100 ng of total RNA. Each 25 μl reaction contained: 9 μl RNase-free H2O, 5 μl 5× buffer (RT-PCR system, Promega), 3 μl 25 mM MgSO4, 1 μl 10 mM dNTP, 0.75 μl Taq (5 U per μl, Promega), 0.25 μl 10 μM reverse primer, 0.25 μl 10 μM forward primer, 0.25 μl 10 μM probe, 5 μl prepared total RNA, with or without 0.5 μl AMV reverse transcriptase (Promega). Real time RT-PCR was performed in a BioRad icycler using the following program: 45 min at 45°C followed by 40 cycles of 30 sec at 95°C, 30 sec at 55°C and 25 sec at 72°C. The PCR efficiency was calculated from the following equation 10−1/slope, whereby the slope was determined as a function of CT values vs. the log values of the RNA concentration. The PCR reactions were assessed to be 97 to 100% efficient over a 2 to 3 log serial dilution (Pfaffl, 2001). To assess CD81 transcriptional activity, approximately 2.5 × 10⁵ cells were seeded per well of a 6-well plate. Starting the following day and every test day thereafter, the cells were removed, enumerated on a hemacytometer, and dissolved in Tri-reagent for RNA isolation.
Statistical Analysis
All experiments were repeated as described in the legends. Data are reported as mean ± standard error of the mean (SEM). Data were analyzed by paired Student's t-test. Data with p values ≤ 0.05 were considered significantly different.
RESULTS
Isolation of CD81−/− and CD81+/− Macrophage Cell Lines
Female CD81−/− mice have low fecundity (Rubinstein et al., 2006). Therefore, it was not practical to maintain this knockout strain with homozygous breeders. This initially limited our access to homozygous CD81−/− mice and their tissues. Our group has established and characterized other macrophage cell lines (Beharka et al., 1998; Chapes et al., 1988). Therefore, we decided to create a bone marrow-derived CD81−/− macrophage cell line to have a consistent source of CD81−/− cells.
Attempts to create a spontaneously immortalized macrophage cell line were unsuccessful and led to the effort described here. Bone marrow was obtained from two mice that were initially screened as CD81-negative. Bone marrow cells were pooled and placed in culture with M-CSF for 1 week to induce macrophage differentiation and were subsequently transfected with SV40 large T antigen. After transfection, we observed continuous cell growth and RT-PCR of RNA from the cells verified that the cells were SV40 large T antigen positive. Cells were adherent and were passable using standard tissue culture techniques and reagents (0.25% trypsin/0.2% EDTA). Cells tested for expression of CD81 were positive, which was inconsistent with the initial genotyping of tail tissue. Subsequent genotyping of cells verified that the cells were CD81+/−. These cells were named “Balb/c macrophage cells”. Some of these cells were frozen at passage 10 and a culture was maintained in vitro for approximately one year. At passage 110, we discovered that the Balb/c macrophage cells no longer expressed CD81 or carried the wild-type allele using both RNA and DNA analyses. Re-examination of a DNA sample of Balb/c macrophage cells at passage 12 and frozen cells at passage 10 verified that the cells were initially CD81+/−. Therefore, the cells lost CD81 expression after passage 12 due to a mutation or because the original culture was a mixture of CD81+/− and CD81−/− cells. The Balb/c macrophage cells were made from a mixture of bone marrow from two mice. Therefore, it was possible that one of the mice was CD81+/− and one was CD81−/−.
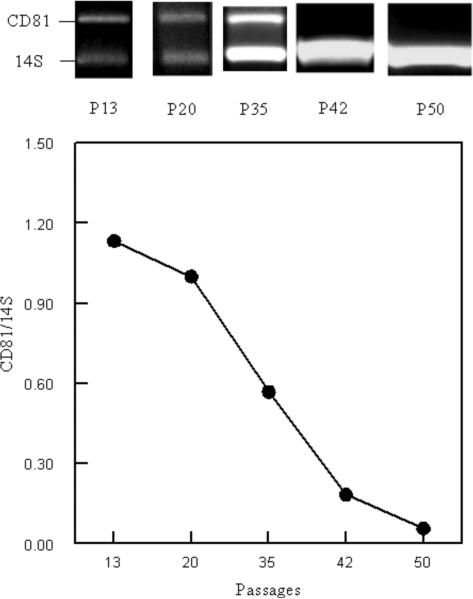
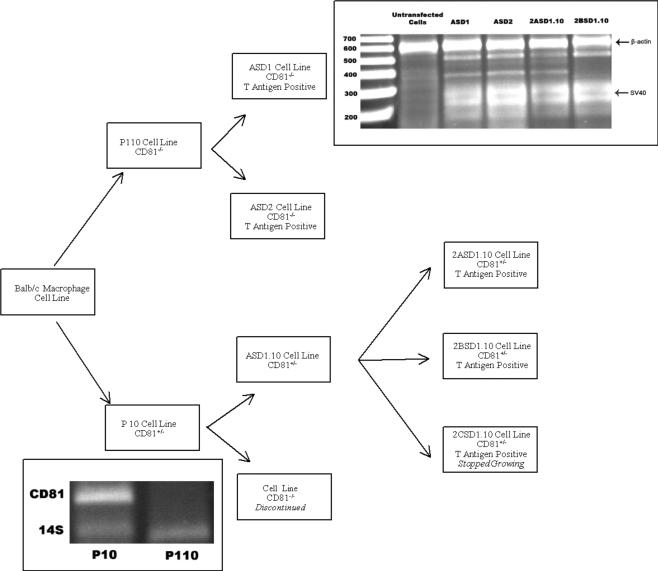
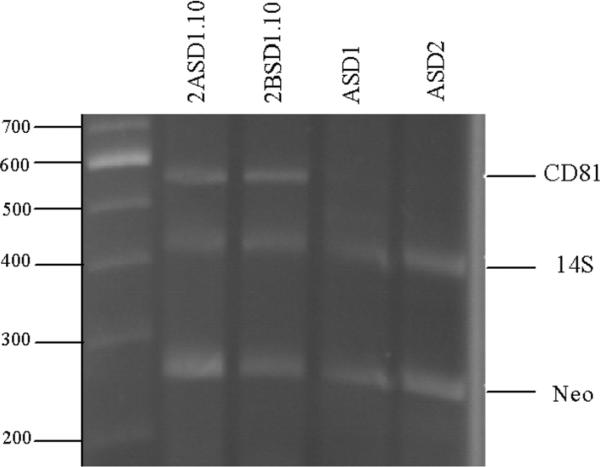
To test the hypothesis that the original Balb/c macrophage cell line was a heterogeneous population and that, over time, CD81−/− cells out grew the CD81+/− cells, we did two experiments. In the first experiment, we thawed Balb/c macrophage cells that had been frozen at passage 10. The cells were monitored over several passages for the presence of CD81 (Figure 1). We observed that at passage 13, Balb/c macrophage cell DNA was positive for CD81. However, over time, we observed a steady decrease in CD81 DNA. In fact, by passage 50, we could no longer detect CD81 by PCR (Figure 1). Therefore, we confirmed our first serendipitous observation that a CD81−/− population out-competed the initial CD81+/− cell population. In the second experiment, cells from passage 10 or 110 (Figure 2) were subjected to limiting dilution cloning. We identified both CD81+/− and CD81−/− cell genotypes in passage 10 subclones (Figure 2). These data confirmed that the original Balb/c macrophage cells were a heterogeneous population. The CD81+/− cells were cloned by limiting dilution a second time and two heterozygous (CD81+/−) cell lines, 2ASD1.10 and 2BSD1.10, were established. We also subcloned CD81−/− cells from the passage 110 Balb/c macrophage cells. From this limiting dilution cloning, two cell lines, ASD1 (CD81−/−) and ASD2 (CD81−/−), were established (Figure 2). All four cell lines tested positive for SV40 large-T antigen by RT-PCR (Figure 2). Therefore, we successfully transformed at least two and perhaps four independent cell lines with SV40 large T antigen during the original transfection. Moreover, we have established four cell lines with two different CD81 genotypes, ASD1 (CD81−/−), ASD2 (CD81−/−), 2ASD1.10 (CD81+/−), and 2BSD1.10 (CD81+/−) (Figure 3) that can be maintained in standard tissue culture.
Figure 1.
The CD81 genotype of Balb/c macrophage cells in continuous tissue culture was assessed over time. Upper Panel) Balb/c cells were assessed after 13, 20, 35, 42, and 50 in vitro passages for the presence of CD81 DNA by PCR using primers and conditions described in the Materials and Methods. The passage number (P) is presented below the Figure and the amplicon is identified on the left side of the Figure. Lower Panel) Ratio of CD81/14S ribosomal protein DNA over time. Ratio was determined semi-quantitatively by densitometry. The points indicated are from the data in the upper panel.
Figure 2.
Ontogeny of ASD1, ASD2, 2ASD1.10, and 2BSD1.10 macrophage cell lines. Balb/c macrophages were passaged in vitro 10 or 110 times. Cells were cloned and subcloned as illustrated. All cells are SV40 large T antigen positive (upper right box). The size marker units to the left of the top box are in base pairs. The lower left box evaluates the expression of CD81 DNA by PCR in Balb/c macrophages after 10 and 110 passages.
Figure 3.
Genotyping of macrophage cell lines for CD81. ASD1, ASD2, 2ASD1.10, and 2BSD1.10 macrophage cell lines were assessed for the presence of DNA for CD81, 14S ribosomal protein gene and the neomycin resistance gene by PCR. The cell line being tested is indicated at the top of the figure and the gene detected is to the right. Size markers in base pairs are shown on the left.
Determining the Lineage of the Isolated Cell Lines
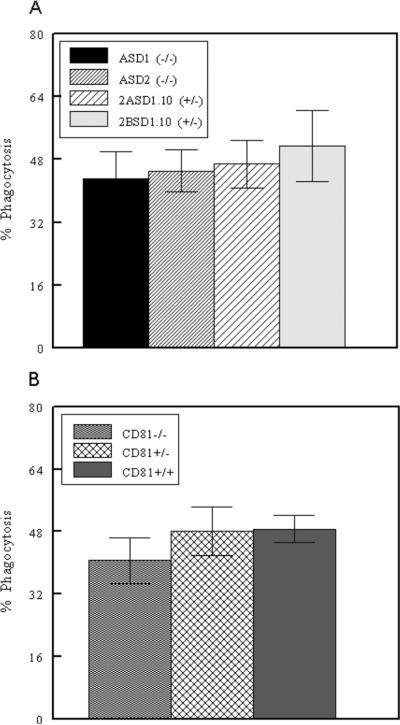
The bone marrow cells used to create the four cell lines were originally cultured with macrophage colony stimulating factor. This would be expected to induce these cells into the macrophage lineage (Das et al., 1981). Therefore, we tested the hypothesis that ASD1, ASD2, 2ASD1.10, and 2BSD1.10 cell lines were macrophages. Macrophages function in the innate immune system by eliminating bacteria through phagocytosis (Esashi et al., 2003). Macrophages are also distinguished from other cells by the presence or absence of certain cellular surface proteins. To determine the lineage of our cell lines, we tested the cells for their cell surface phenotype and determined whether the cell lines were phagocytic. We found that all four cell lines were phagocytic (Figure 4A). Although there was experiment-to-experiment variation, peak phagocytosis approached the phagocytosis levels of primary peritoneal macrophages (Figure 4B).
Figure 4.
Phagocytosis by macrophage cell lines. A) ASD1, ASD2, 2ASD1.10, and 2BSD1.10 macrophage cell lines were assessed for phagocytosis of fluorescent beads using flow cytometry. B) Thioglycollate-elicited peritoneal macrophages from CD81−/−, CD81+/− and CD81+/+ mice were assessed for phagocytosis as above. Numbers represent mean ± SEM of four independent experiments.
When we phenotyped the cells by flow cytometry, we assessed a wide variety of markers for cells in different stages of macrophage differentiation along with a few proteins that would be expressed by cells other than macrophages. 2ASD1.10, and 2BSD1.10 expressed CD81while ASD1 and ASD2 did not (Table 3). ASD1, ASD2, 2ASD1.10, and 2BSD1.10 expressed low levels of B220 and CD11c, which are expressed by B-cells and dendritic cells, respectively (Table 3). There were some cell line-to-cell line differences in expression of some markers. For example, Ly6C was lower on the CD81−/− clones (ASD1 and ASD2) compared to the CD81+/− clones (2ASD1.10 and 2BSD1.10) (Table 3). However, the CD81-negative clones expressed higher levels of Gr-1 (Ly6G) than the other cell lines. 2BSD1.10 expressed higher levels of CCR2 (MCP-1 receptor) than any of the other cell lines. ASD1 expressed lower levels of PU.1 compared to 2ASD1.10. However, all the cell lines expressed c-fms, indicating that they are in the macrophage lineage (Chan et al., 1998). All the cell lines expressed very low levels of the macrophage differentiation antigens F4/80, ER-MP58, CD11b, and CD31, but high levels of Mac-2. Therefore, based on a composite expression profile of mature macrophage marker Mac-2 and macrophage lineage markers c-fms and Ly-6C, we placed the cell lines in an early-to-mid macrophage differentiation stage. The CD81+/− cell lines may be more differentiated than the CD81−/− cell lines based on higher Ly-6C and lower Ly-6G expression.
Table 3.
Phenotype of macrophage cell lines.
| Molecule/Antibody | % Expression by Cell Linea | |||
|---|---|---|---|---|
| ASD1 (−/−) | ASD2 (−/−) | 2ASD1.10 (+/−) | 2BSD1.10 (+/−) | |
| Mac-2 | 34±8 | 47±7 | 48±10 | 39±6 |
| Ly-6C | 13±6b | 6±1b | 37±7 | 39±6 |
| Ly-6G (Gr-1) | 29±3b | 53±11b | 18±6 | 3±0 |
| CCR2 | 9±6 | 5±2 | 7±4 | 27±5c |
| PU.1 | 17±4d | 22±3 | 34±10 | 25±5 |
| cfms | 17±4 | 31±9 | 30±10 | 24±5 |
| CD31 | 19±7 | 4±2 | 6±3 | 2±1 |
| ER-MP-58 | 1±1 | 1±0 | 4±2 | 0±0 |
| F4/80 | 4±2 | 6±5 | 4±3 | 2±0 |
| CD11b | 3±2 | 6±4 | 15±13 | 1±0 |
| CD11c | 3±2 | 1±1 | 4±1 | 1±0 |
| CD81 | 0±0 | 0±0 | 98±2 | 93±4 |
| B220Re | 0±0 | 7±5 | 1±1 | 6±3 |
Numbers represent mean ± SEM of 4–5 independent experiments. CD81 genotypes are indicated as homozygous negative (−/−) and heterozygous (+/−).
Significantly different from CD81(+/−) cell lines, P<0.05.
Significantly different from all the other cell lines, P<0.05.
Significantly different from 2ASD1.10 CD81(+/−) cell line, P<0.05.
Spleen cells >45% positive for B220 in comparisons with these cell lines.
Determination of Cell Division Times
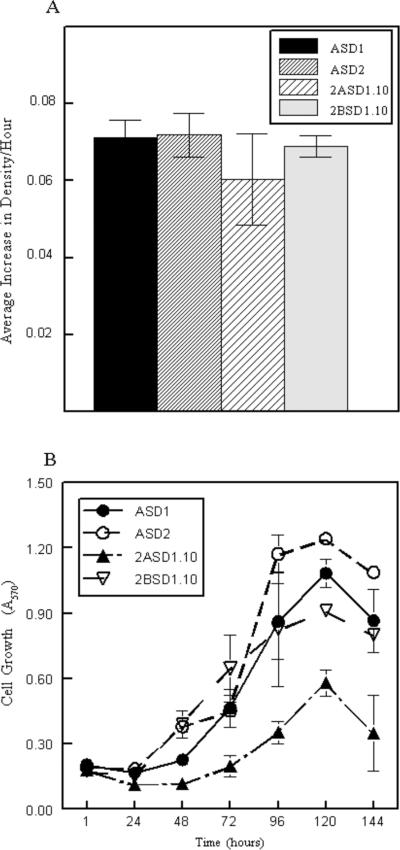
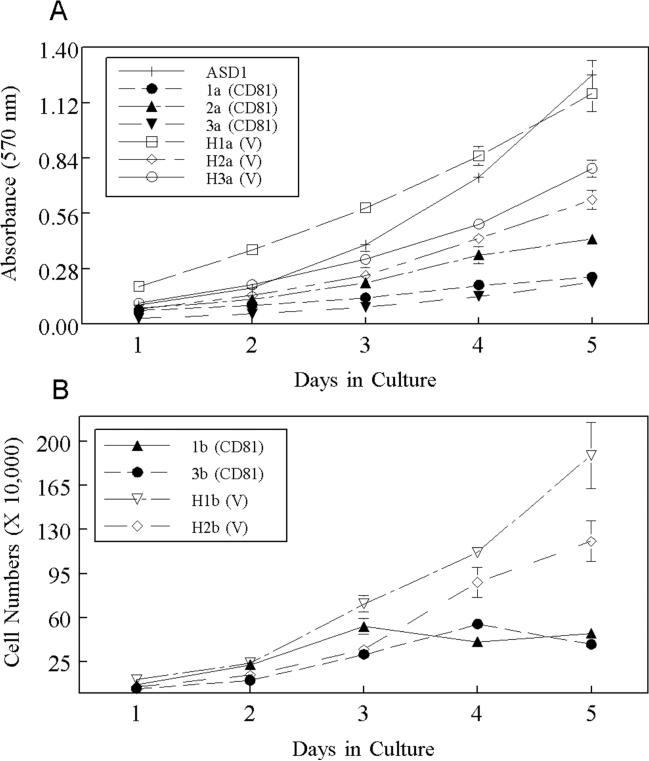
The CD81−/− cell lines appeared to outgrow the CD81+/− cell lines over time (Figure 1). The observation that the CD81+/− cell lines 2ASD1.10 and 2BSD1.10 might be more differentiated, and might grow more slowly, would be consistent with that hypothesis (DeKoter et al., 1998; Metcalf, 1989). To test the hypothesis that the homozygous CD81-negative cell lines grew faster then the CD81-heterozygous cell lines, we compared their growth rates during log phase growth (24–120 hrs) using MTT to assess cell number. At times, 2ASD1.10 grew slower than the other three cell lines (Figure 5B) but its growth was irregular and often there was no statistical difference in the growth of the four cell lines (Figure 5A). When we compared the overall density of cells when cultures reached plateau phase/confluency at around 120 hrs, we found that ASD1 and ASD2 cells reached higher densities than 2ASD1.10 and 2BSD1.10 macrophage cells (Figure 5B). It was possible that some of the growth differences among the 4 macrophage cell lines were due to independent cellular transformations by SV40 T antigen and not due to CD81. Therefore, to directly compare the impact of CD81 on cell growth, we re-expressed mouse CD81 in transfected ASD1 cells. We found that ASD1 cells transfected with vector alone (open symbols; V) reached densities greater than 1 × 10⁶ cells per 60-mm plate at confluency (Figure 6). In contrast, ASD1 cells transfected with CD81 (closed symbols; CD81) did not reached densities greater than 5 × 10⁵ cells per/60-mm plate (Figure 6). We observed that the CD81-expressing cells tended to be larger (even compared to 2ASD1.10 and 2BSD1.10) and reached confluency at a lower density than vector-transfected cells explaining the relatively flat growth curve. The over-expressing clones also formed a more contiguous, smooth monolayer compared to 2ASD1.10 and 2BSD1.10. The non-CD81-expressing cells preferred to pile on the adherent cells rather than form smooth monolayers. These growth characteristics have been observed in several different clones transformed with CD81 from at least two independent transfection experiments (Figure 6). Therefore, the expression of recombinant CD81 in CD81-negative cells reproducibly affects cell densities.
Figure 5.
Determination of cell growth rates of CD81−/− and CD81+/− macrophage cell lines. A) Equal numbers of cells were plated in a 96-well plate. Each day, three wells were exposed to MTT and the absorbance was read at 570 nm. Absorbance was divided by the hours since plating allowing determination of the density increase per hour from day 1 through day 5 in culture. B) Differences in cell density at plateau phase of cell growth amongst the 4 macrophage cell lines, ASD1, ASD2, 2ASD1.10, and 2BSD1.10. Numbers represent mean ± SEM of quadruplicate replicates from one experiment. One of four representative experiments is shown for both panels. Panel A shows an independent experiment from Panel B.
Figure 6.
Effect of re-expression of mouse CD81 in ASD1 macrophage cells. Cells were transfected with pcDNA3.1/Hygro with (CD81) or without (V) CD81. A) Cells were assessed for growth by MTT. B) Cells were enumerated using a hemacytometer. Each cell line represents an independent clone selected in one of two independent transfection experiments.
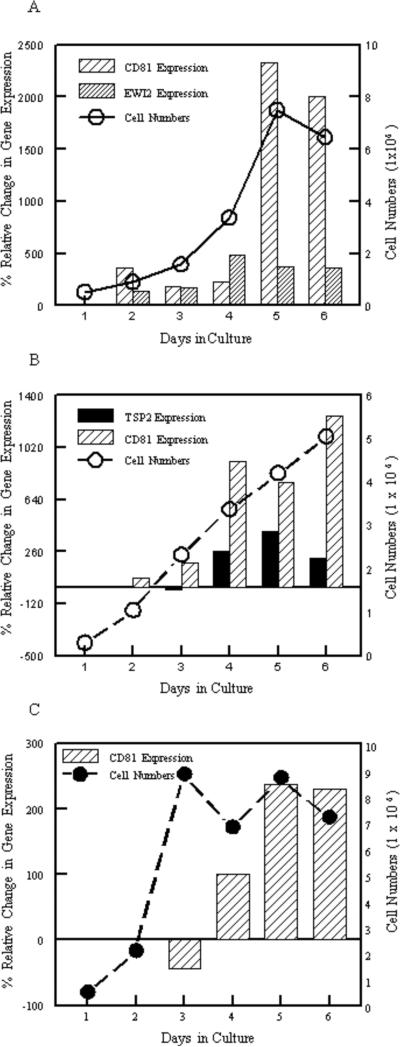
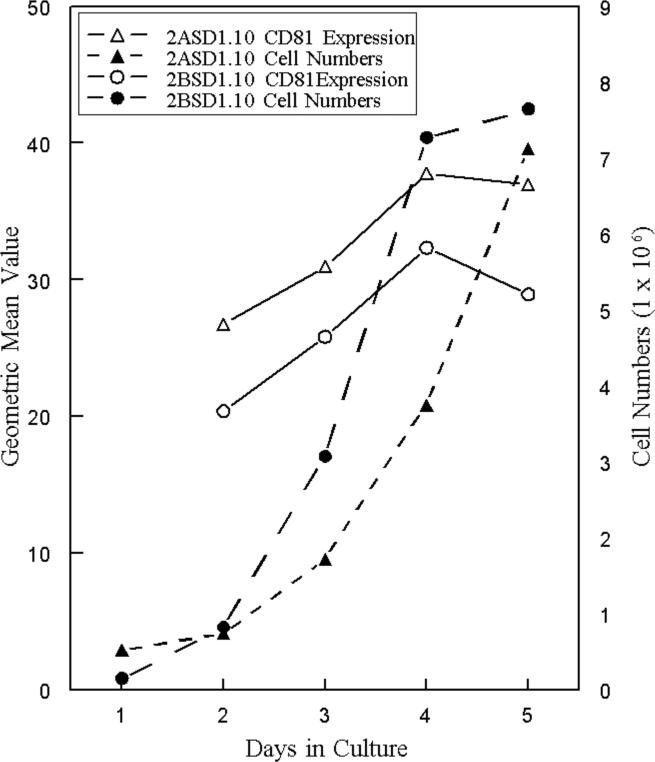
During the course of our experiments we noted inconsistent CD81 transcript levels that appeared to vary with cell density. Concurrent assessment of CD81 transcript levels, measured by quantitative RT-PCR and cell growth indicated that CD81 transcript levels increased dramatically in 2ASD1.10 cells as cultures reached confluency when compared to the 14S ribosomal protein gene (Figure 7A and B). Interestingly, as 2ASD1.10 cells reached confluency and as CD81 transcript increased, the transcript level of EWI-2, another tetraspanin-associated protein (Charrin et al., 2003; Clark et al., 2001) was unchanged (Figure 7A). Similarly, the transcript level of a tetraspanin closely related to CD81, TSP2 (Huang et al., 2005), did not consistently increase in the same cells (Figure 7B). Therefore, the increase in CD81 transcript levels was specific to CD81. We also examined the CD81 transcript levels in 2BSD1.10 cells when these cells reached confluency and there also was an increase in transcript levels when these cells entered stationary phase (Figure 7C). Although 2BSD1.10 cells generally reached stationary phase before 2ASD1.10 cells (Figures 7C and 8), changes in CD81 transcript levels were accompanied by increased surface expression of CD81 in both cell types as they reached confluency (Figure 8). Therefore, these macrophage cells appeared to upregulate CD81 as cell numbers increased.
Figure 7.
Expression of CD81 in macrophage cell lines during cell culture. Transcript levels were assessed by quantitative real-time PCR and normalized to the 14S ribosomal protein housekeeping gene (bars). Number of cells in a 6-well plate at the time of RNA isolation are also illustrated (line). A) CD81 and EWI-2 in 2ASD1.10 Cells. B) CD81 and TSP2 in 2ASD1.10 Cells. C) CD81 in 2BSD1.10 cells. Numbers are the mean of duplicate samples. A negative value indicates that the level of CD81 expression decreased relative to the starting levels.
Figure 8.
Surface expression of CD81 on macrophage cell lines 2ASD1.10 and 2BSD1.10 during culture. CD81 was measured by flow cytometry and geometric mean values (fluorescence intensity per cell) (open symbols) were compared to cell growth (closed symbols). One representative experiment of two experiments with similar outcomes is shown.
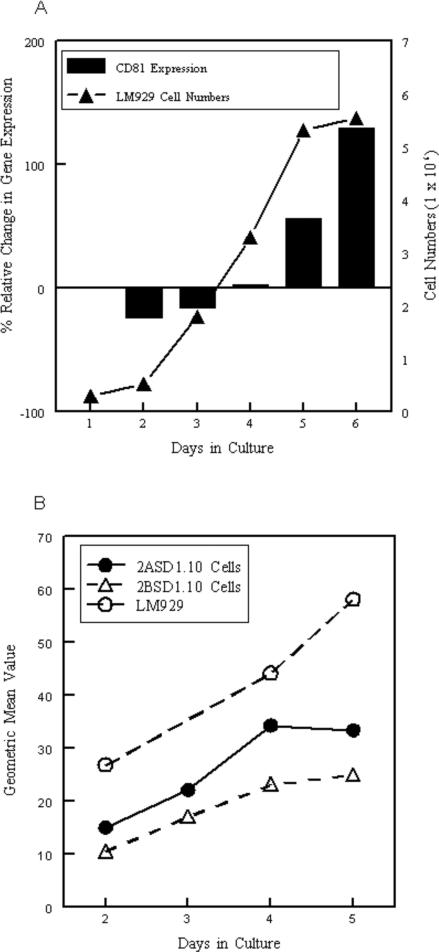
We examined if a non-macrophage cell line, LM929 (Kuchler and Merchant, 1956), also exhibited increased CD81 expression as cell density increased. Indeed, CD81 transcript levels increased as LM929 cell density reached the plateau phase of cell growth (Figure 9A). Furthermore, the increased transcript levels were accompanied by an increase in surface expression of CD81 at levels higher than CD81 is expressed on 2ASD1.10 or 2BSD1.10 (Figure 9B). It should be noted that LM929 cells are homozygous for CD81, while the macrophage cell lines are heterozygous. These data suggest that macrophages and other cells upregulate CD81 expression as they reach confluency.
Figure 9.
Expression of CD81 in LM929 cells during cell culture. A) LM929 cells were assessed by quantitative real time RT-PCR for the transcript levels of CD81 in relationship to the 14S ribosomal protein housekeeping gene (bars). Number of cells in a 6-well plate at the time of RNA isolation are also illustrated (line). B) Cell surface expression of CD81 on LM929 cells, 2ASD1.10 and 2BSD1.10 cells. CD81 was detected by flow cytometry. One representative experiment of two independent experiments with similar outcomes is shown. A negative value indicates that the level of CD81 expression decreased relative to the starting levels.
DISCUSSION
We created four cell lines that have macrophage properties. ASD1 and ASD2 are homozygous negative for CD81 while 2ASD1.10 and 2BSD1.10 are heterozygous for CD81. It is possible that heterozygosity causes lower surface expression of CD81 on 2ASD1.10 and 2BSD1.10 compared to LM929 cells that are homozygous for CD81 (Figure 9). In addition, other factors such as cell type or transformation may also influence CD81 expression. Regardless, the macrophage cells 2ASD1.10 and 2BSD1.10 express significant amounts of CD81 on their surface and its expression varies during cell growth.
CD81 is ubiquitously expressed on most nucleated cells including high levels on monocytes/macrophages (Maecker et al., 2000). This makes experiments that involve the expression of mutated, exogenous CD81 difficult to execute. ASD1 and ASD2 cells are novel mouse cell lines that overcome this problem because they do not express endogenous CD81. They were transfected to re-express wild-type CD81 without background expression of endogenous CD81 protein. Therefore, they can be useful tools in future studies to examine the function of CD81 or other proteins. ASD1 and ASD2 are not the first mammalian granulocytic lineage cell lines described that lack CD81. U937 is a human promyelocytic cell line that lacks expression of CD81 (Sundstrom and Nilsson, 1976). However, there are several sublines of U937 and expression of CD81 on some of them has been controversial (Cocquerel et al., 2003). Since ASD1 and ASD2 originate from CD81-knockout mice, there is no question whether these cells lack expression of CD81 and they are unique among mouse cells.
All four of the new cell lines described here are in the macrophage lineage based on the expression of Mac-2 antigen, the c-fms antigen (M-CSF receptor) and Ly6C, and the low expression of B220, a B-cell molecule, and CD11c, a dendritic cell marker (Leenen et al., 1994). The high level of CD81 expression on 2ASD1.10 and 2BSD1.10 is consistent with the high level of expression on macrophages (Maecker et al., 2000) and is consistent with the level of expression on the C2D macrophage cell line which has also been identified as an early differentiated macrophage (Potts et al., 2008). It is interesting that although the cells express high levels of Mac-2, the level of expression does not correlate with the low level of expression of F4/80 and CD11b, two other markers found on macrophages. F4/80 is found on most macrophage subpopulations (Chan et al., 1998; Melnicoff et al., 1989). Therefore, it is surprising that the level of expression is so low. It is possible that the expression of SV40 large T antigen has affected the expression of F4/80. If this is true, all the cell lines have been affected similarly and the effect is independent of where T antigen is integrated. It is unlikely that T antigen integration would have occurred identically in all these new macrophage cell lines in independent transformations because SV40 T antigen integration is usually a unique event every time a cell line is “transformed” (Chapes et al., 1987).
Our use of the oncogene SV40 large T-antigen to immortalize these cells is a common method used to induce DNA replication (Das et al., 1981; Esashi et al., 2003). However, there are some drawbacks to this approach. For example, the cells are probably tumorigenic (Ludlow, 1993). When our group created the C2D macrophage cell line, in comparisons with its SV40 large T antigen-transformed “sister” cell line C2Dt, only the T antigen-expressing C2Dt formed tumors when injected in vivo (Beharka et al., 1998). This will probably limit the use of ASD1 and ASD2 to in vitro assays. T antigen affects some cellular properties and may affect some of the functions of these new macrophage cells (Kool et al., 2001). In some cases, T antigen may affect the function of CD81 (Toledo et al., 2004). Therefore, ASD1 and ASD2 cells will be important tools among many, to learn about CD81 function.
It is possible that 2ASD1.10 and 2BSD1.10 cells are more differentiated than ASD1 and ASD2 based on the expression of Ly6C (Leenen et al., 1990). The high level of expression of CCR2 on 2BSD1.10 along with a low level of Ly-6G would be consistent with a more differentiated phenotype (Ferret-Bernard et al., 2004) and supports this hypothesis. However, since all the cell lines were equally phagocytic it is clear that the difference does not affect all functions.
We found that the CD81−/− macrophage cells out-competed CD81+/− macrophages in two independent long-term growth experiments. Both cell types have similar doubling times during log-phase growth so the outgrowth of the CD81−/− macrophage cells appears to result from the higher density at which the cells enter plateau phase. Indeed, the re-expression of CD81 in the CD81-negative cell, ASD1, reduced the density at which the cells entered the plateau phase of cell growth. The higher expression of CD81 in 2ASD1.10 compared to 2ASD1.10 (Figures 8 and 9) correlates with the relative densities these two CD81-expressing sister cells achieve (Figure 5B) also supports the hypothesis that CD81 influences cell density. The finding that CD81 affects the density of these macrophage cells is consistent with a role for CD81 and other tetraspanins in tumorigenesis and growth (Claas et al., 1998; Testa et al., 1999; Yanez-Mo et al., 1998). CD81 was originally defined as “target of anti-proliferative antibody, TAPA-1” (Oren et al., 1990). When CD81 was bound by the 5A6 antibody, there was a decrease in B cell proliferation. The co-silencing of CD9 and CD81 increased the growth of WI38 and VA13 cells in vitro (Toledo et al., 2005) and also exemplifies a role in growth. Astrocytes lacking CD81 are not controlled by surrounding neurons and blocking CD81 with the anti-CD81 antibody, Eat-1, prevented the ability of neurons to inhibit astrocyte proliferation (Kelic et al., 2001). Another anti-CD81 antibody, AMP1, inhibits astrocyte growth (Geisert et al., 1996) and microglial cell proliferation (Dijkstra et al., 2001) and also indicates a role for CD81 in growth regulation. Microglia are brain macrophages and are responsive to many of the same types of cytokines as other tissue macrophages (Hanisch, 2002; Hanisch et al., 2004). Therefore, the growth regulatory role of CD81 on macrophages may be a universal property within the lineage. Additional experiments will be necessary to determine this.
The upregulation of CD81 transcript levels and expression in our macrophage cells as they reach confluency suggests that the macrophage cells modify CD81 expression in response to their environment. This up-regulation appears to be specific to CD81 since EWI-2 and TSP2 transcript levels were not affected as cell density increased. The observations that there is a fine regulation of CD81 in mouse brain during early development (Sullivan and Geisert, 1998) and the onset of astrocytic hyperplasia in CD81−/− Balb/c mice (Kelic et al., 2001) support this hypothesis. The finding that LM929 cells also increase CD81 expression as they grow in culture suggests that this potential regulatory mechanism may also be present in cells other than macrophages. The recent work showing the inverse relationship between histone deacetylase and CD81 expression affecting glioma cell growth (Gensert et al., 2007) supports this hypothesis. Additional studies will be required to establish if this putative mechanism is ubiquitous. These new macrophage cell lines ASD1, ASD2, 2ASD1.10 and 2BSD1.10 will be useful in examining the mechanism of how CD81 alters cell density and perhaps the identification of a physiological ligand for CD81.
ACKNOWLEDGEMENTS
We would like to thank Jenna Kennedy, Ryan Gallagher and David Amrine for their assistance in the maintenance and genotyping of the mice used and Betsey Potts for her help and information on macrophage phenotyping. We also thank Elizabeth Miller, Regina Fleming, Alison Fedrow and Taryn Penabaz for laboratory assistance and Caroline Delandre for participating in our group discussions about tetrasapanins. We thank Drs. Carol Mckown (U.S. Meat Animal Research Center, Hastings, NE) and Sherry Fleming (Kansas State University) for reviewing the manuscript. This project has been supported by NIH grants AI55052, AI052206, RR16475, and RR17686; NASA grants NAG2-1274 and NCC8-242; the Kansas Agriculture Experiment Station and the Terry C. Johnson Center for Basic Cancer Research. This is Kansas Agriculture Experiment Station publication 08-128-J.
LITERATURE CITED
- Armstrong JW, Kirby-Dobbels K, Chapes SK. The effects of rM-CSF and rIL-6 therapy on immunosuppressed antiorthostatically suspended mice. J Appl Physiol. 1995;78:968–975. doi: 10.1152/jappl.1995.78.3.968. [DOI] [PubMed] [Google Scholar]
- Armstrong JW, Nelson KA, Simske SJ, Luttges MW, Iandolo JJ, Chapes SK. Skeletal unloading causes organ-specific changes in immune cell responses. J Appl Physiol. 1993;75:2734–2739. doi: 10.1152/jappl.1993.75.6.2734. [DOI] [PubMed] [Google Scholar]
- Beharka AA, Armstrong JW, Chapes SK. Macrophage cell lines derived from major histocompatibility complex II-negative mice. In Vitro Cell Dev Biol Anim. 1998;34:499–507. doi: 10.1007/s11626-998-0085-y. [DOI] [PubMed] [Google Scholar]
- Chan J, Leenen PJ, Bertoncello I, Nishikawa SI, Hamilton JA. Macrophage lineage cells in inflammation: characterization by colony-stimulating factor-1 (CSF-1) receptor (c-Fms), ER-MP58, and ER-MP20 (Ly-6C) expression. Blood. 1998;92:1423–1431. [PubMed] [Google Scholar]
- Chapes SK, Didier ES, Tompkins WA. Macrophage cell line B6MP102 resembles peritoneal macrophages in tumor cell recognition and killing. J Leukoc Biol. 1988;43:28–35. doi: 10.1002/jlb.43.1.28. [DOI] [PubMed] [Google Scholar]
- Chapes SK, O'Neill AE, Flaherty L, Gooding LR. Macrophage-resistant murine simian virus 40 tumors express a retroviral type-specific gp70. J Virol. 1987;61:928–932. doi: 10.1128/jvi.61.3.928-932.1987. [DOI] [PMC free article] [PubMed] [Google Scholar]
- Charrin S, Le Naour F, Labas V, Billard M, Le Caer JP, Emile JF, Petit MA, Boucheix C, Rubinstein E. EWI-2 is a new component of the tetraspanin web in hepatocytes and lymphoid cells. The Biochemical Journal. 2003;373:409–421. doi: 10.1042/BJ20030343. [DOI] [PMC free article] [PubMed] [Google Scholar]
- Claas C, Seiter S, Claas A, Savelyeva L, Schwab M, Zoller M. Association between the rat homologue of CO-029, a metastasis-associated tetraspanin molecule and consumption coagulopathy. J Cell Biol. 1998;141:267–280. doi: 10.1083/jcb.141.1.267. [DOI] [PMC free article] [PubMed] [Google Scholar]
- Clark KL, Zeng Z, Langford AL, Bowen SM, Todd SC. PGRL is a major CD81-associated protein on lymphocytes and distinguishes a new family of cell surface proteins. J Immunol. 2001;167:5115–5121. doi: 10.4049/jimmunol.167.9.5115. [DOI] [PubMed] [Google Scholar]
- Cocquerel L, Kuo CC, Dubuisson J, Levy S. CD81-dependent binding of hepatitis C virus E1E2 heterodimers. J Virol. 2003;77:10677–10683. doi: 10.1128/JVI.77.19.10677-10683.2003. [DOI] [PMC free article] [PubMed] [Google Scholar]
- Das SK, Stanley ER, Guilbert LJ, Forman LW. Human colony-stimulating factor (CSF-1) radioimmunoassay: resolution of three subclasses of human colony-stimulating factors. Blood. 1981;58:630–641. [PubMed] [Google Scholar]
- DeKoter RP, Walsh JC, Singh H. PU.1 regulates both cytokine-dependent proliferation and differentiation of granulocyte/macrophage progenitors. EMBO J. 1998;17:4456–4468. doi: 10.1093/emboj/17.15.4456. [DOI] [PMC free article] [PubMed] [Google Scholar]
- Dijkstra S, Geisert EE, Jr., Dijkstra CD, Bar PR, Joosten EA. CD81 and microglial activation in vitro: proliferation, phagocytosis and nitric oxide production. J Neuroimmunol. 2001;114:151–159. doi: 10.1016/s0165-5728(01)00240-5. [DOI] [PubMed] [Google Scholar]
- Esashi E, Sekiguchi T, Ito H, Koyasu S, Miyajima A. Cutting Edge: A possible role for CD4+ thymic macrophages as professional scavengers of apoptotic thymocytes. J Immunol. 2003;171:2773–2777. doi: 10.4049/jimmunol.171.6.2773. [DOI] [PubMed] [Google Scholar]
- Fearon DT, Carter RH. The CD19/CR2/TAPA-1 complex of B lymphocytes: linking natural to acquired immunity. Annu Rev Immunol. 1995;13:127–149. doi: 10.1146/annurev.iy.13.040195.001015. [DOI] [PubMed] [Google Scholar]
- Fernandez-Sesma A, Peluso RW, Bai X, Schulman JL, Levy DE, Moran TM. Superantigen-activated T cells redirected by a bispecific antibody inhibit vesicular stomatitis virus replication in vitro and in vivo. J Immunol. 1998;160:1841–1849. [PubMed] [Google Scholar]
- Ferret-Bernard S, Sai P, Bach JM. In vitro induction of inhibitory macrophage differentiation by granulocyte-macrophage colony-stimulating factor, stem cell factor and interferon-gamma from lineage phenotypes-negative c-kit-positive murine hematopoietic progenitor cells. Immunol Lett. 2004;91:221–227. doi: 10.1016/j.imlet.2003.12.008. [DOI] [PubMed] [Google Scholar]
- Geisert EE, Jr., Yang L, Irwin MH. Astrocyte growth, reactivity, and the target of the antiproliferative antibody, TAPA. J Neurosci. 1996;16:5478–5487. doi: 10.1523/JNEUROSCI.16-17-05478.1996. [DOI] [PMC free article] [PubMed] [Google Scholar]
- Gensert JM, Baranova OV, Weinstein DE, Ratan RR. CD81, a cell cycle regulator, is a novel target for histone deacetylase inhibition in glioma cells. Neurobiology of Disease. 2007;26:671–680. doi: 10.1016/j.nbd.2007.03.008. [DOI] [PubMed] [Google Scholar]
- Hanisch UK. Microglia as a source and target of cytokines. Glia. 2002;40:140–155. doi: 10.1002/glia.10161. [DOI] [PubMed] [Google Scholar]
- Hanisch UK, van Rossum D, Xie Y, Gast K, Misselwitz R, Auriola S, Goldsteins G, Koistinaho J, Kettenmann H, Moller T. The microglia-activating potential of thrombin: the protease is not involved in the induction of proinflammatory cytokines and chemokines. The Journal of Biological Chemistry. 2004;279:51880–51887. doi: 10.1074/jbc.M408318200. [DOI] [PubMed] [Google Scholar]
- Huang S, Yuan S, Dong M, Su J, Yu C, Shen Y, Xie X, Yu Y, Yu X, Chen S, Zhang S, Pontarotti P, Xu A. The phylogenetic analysis of tetraspanins projects the evolution of cell-cell interactions from unicellular to multicellular organisms. Genomics. 2005;86:674–684. doi: 10.1016/j.ygeno.2005.08.004. [DOI] [PubMed] [Google Scholar]
- Janabi N, Peudenier S, Heron B, Ng KH, Tardieu M. Establishment of human microglial cell lines after transfection of primary cultures of embryonic microglial cells with the SV40 large T antigen. Neurosci Lett. 1995;195:105–108. doi: 10.1016/0304-3940(94)11792-h. [DOI] [PubMed] [Google Scholar]
- Kelic S, Levy S, Suarez C, Weinstein DE. CD81 regulates neuron-induced astrocyte cell-cycle exit. Mol Cell Neurosci. 2001;17:551–560. doi: 10.1006/mcne.2000.0955. [DOI] [PubMed] [Google Scholar]
- Kool J, van Zaane W, van der Eb AJ, Terleth C. Down-regulation of T-STAR, a growth inhibitory protein, after SV40-mediated immortalization. Cell Growth Differ. 2001;12:535–541. [PubMed] [Google Scholar]
- Kuchler RJ, Merchant DJ. Propagation of strain L (earle) cells in agitated fluid suspension cultures. Proceedings of the Society for Experimental Biology and Medicine. 1956;92:803–806. doi: 10.3181/00379727-92-22620. [DOI] [PubMed] [Google Scholar]
- Leenen PJ, de Bruijn MF, Voerman JS, Campbell PA, van Ewijk W. Markers of mouse macrophage development detected by monoclonal antibodies. J Immunol Methods. 1994;174:5–19. doi: 10.1016/0022-1759(94)90005-1. [DOI] [PubMed] [Google Scholar]
- Leenen PJ, Melis M, Slieker WA, Van Ewijk W. Murine macrophage precursor characterization. II. Monoclonal antibodies against macrophage precursor antigens. Eur J Immunol. 1990;20:27–34. doi: 10.1002/eji.1830200105. [DOI] [PubMed] [Google Scholar]
- Levy S, Todd SC, Maecker HT. CD81 (TAPA-1): a molecule involved in signal transduction and cell adhesion in the immune system. Annu Rev Immunol. 1998;16:89–109. doi: 10.1146/annurev.immunol.16.1.89. [DOI] [PubMed] [Google Scholar]
- Ludlow J. Interactions between SV40 large-tumor antigen and the growth suppressor proteins pRB and p53. FASEB J. 1993;7:866–871. doi: 10.1096/fasebj.7.10.8344486. [DOI] [PubMed] [Google Scholar]
- Maecker HT, Levy S. Normal lymphocyte development but delayed humoral immune response in CD81-null mice. J Exp Med. 1997;185:1505–1510. doi: 10.1084/jem.185.8.1505. [DOI] [PMC free article] [PubMed] [Google Scholar]
- Maecker HT, Todd SC, Kim EC, Levy S. Differential expression of murine CD81 highlighted by new anti-mouse CD81 monoclonal antibodies. Hybridoma. 2000;19:15–22. doi: 10.1089/027245700315752. [DOI] [PubMed] [Google Scholar]
- Melnicoff MJ, Horan PK, Morahan PS. Kinetics of changes in peritoneal cell populations following acute inflammation. Cell Immunol. 1989;118:178–191. doi: 10.1016/0008-8749(89)90367-5. [DOI] [PubMed] [Google Scholar]
- Metcalf D. The molecular contol of cell division, differentiation commitmant and maturation in haemopoietic cells. Nature. 1989;339:27–30. doi: 10.1038/339027a0. [DOI] [PubMed] [Google Scholar]
- Mittelbrunn M, Yanez-Mo M, Sancho D, Ursa A, Sanchez-Madrid F. Cutting edge: dynamic redistribution of tetraspanin CD81 at the central zone of the immune synapse in both T lymphocytes and APC. J Immunol. 2002;169:6691–6695. doi: 10.4049/jimmunol.169.12.6691. [DOI] [PubMed] [Google Scholar]
- Oren R, Takahashi S, Doss C, Levy R, Levy S. TAPA-1, the target of an antiproliferative antibody, defines a new family of transmembrane proteins. Mol Cell Biol. 1990;10:4007–4015. doi: 10.1128/mcb.10.8.4007. [DOI] [PMC free article] [PubMed] [Google Scholar]
- Pfaffl MW. A new mathematical model for relative quantification in real-time RT-PCR. Nucleic Acids Res. 2001;29:e45. doi: 10.1093/nar/29.9.e45. [DOI] [PMC free article] [PubMed] [Google Scholar]
- Potts BE, Hart ML, Snyder LL, Boyle D, Mosier DA, Chapes SK. Differentiation of C2D macrophage cells after adoptive transfer. Clin Vaccine Immunol. 2008;15:243–252. doi: 10.1128/CVI.00328-07. [DOI] [PMC free article] [PubMed] [Google Scholar]
- Rhoads D, Roufa D. Emetine resistance of Chinese hamster cells: Structures of wild-type and mutant ribosomal protein S14 mRNAs. Mol. Cell. Biol. 1985;5:1655–1659. doi: 10.1128/mcb.5.7.1655. [DOI] [PMC free article] [PubMed] [Google Scholar]
- Rubinstein E, Ziyyat A, Prenant M, Wrobel E, Wolf JP, Levy S, Le Naour F, Boucheix C. Reduced fertility of female mice lacking CD81. Dev Biol. 2006;290:351–358. doi: 10.1016/j.ydbio.2005.11.031. [DOI] [PubMed] [Google Scholar]
- Shoham T, Rajapaksa R, Boucheix C, Rubinstein E, Poe JC, Tedder TF, Levy S. The tetraspanin CD81 regulates the expression of CD19 during B cell development in a postendoplasmic reticulum compartment. J Immunol. 2003;171:4062–4072. doi: 10.4049/jimmunol.171.8.4062. [DOI] [PubMed] [Google Scholar]
- Sullivan CD, Geisert EE., Jr. Expression of rat target of the antiproliferative antibody (TAPA) in the developing brain. J Comp Neurol. 1998;396:366–380. [PubMed] [Google Scholar]
- Sundstrom C, Nilsson K. Establishment and characterization of a human histiocytic lymphoma cell line (U-937) Int J Cancer. 1976;17:565–577. doi: 10.1002/ijc.2910170504. [DOI] [PubMed] [Google Scholar]
- Takeda Y, Tachibana I, Miyado K, Kobayashi M, Miyazaki T, Funakoshi T, Kimura H, Yamane H, Saito Y, Goto H, Yoneda T, Yoshida M, Kumagai T, Osaki T, Hayashi S, Kawase I, Mekada E. Tetraspanins CD9 and CD81 function to prevent the fusion of mononuclear phagocytes. J Cell Biol. 2003;161:945–956. doi: 10.1083/jcb.200212031. [DOI] [PMC free article] [PubMed] [Google Scholar]
- Testa JE, Brooks PC, Lin JM, Quigley JP. Eukaryotic expression cloning with an antimetastatic monoclonal antibody identifies a tetraspanin (PETA-3/CD151) as an effector of human tumor cell migration and metastasis. Cancer Res. 1999;59:3812–3820. [PubMed] [Google Scholar]
- Todd SC, Lipps SG, Crisa L, Salomon DR, Tsoukas CD. CD81 expressed on human thymocytes mediates integrin activation and interleukin 2-dependent proliferation. J Exp Med. 1996;184:2055–2060. doi: 10.1084/jem.184.5.2055. [DOI] [PMC free article] [PubMed] [Google Scholar]
- Toledo MS, Suzuki E, Handa K, Hakomori S. Cell growth regulation through GM3-enriched microdomain (glycosynapse) in human lung embryonal fibroblast WI38 and its oncogenic transformant VA13. The Journal of Biological Chemistry. 2004;279:34655–34664. doi: 10.1074/jbc.M403857200. [DOI] [PubMed] [Google Scholar]
- Toledo MS, Suzuki E, Handa K, Hakomori S. Effect of ganglioside and tetraspanins in microdomains on interaction of integrins with fibroblast growth factor receptor. The Journal of Biological Chemistry. 2005;280:16227–16234. doi: 10.1074/jbc.M413713200. [DOI] [PubMed] [Google Scholar]
- Yanez-Mo M, Alfranca A, Cabanas C, Marazuela M, Tejedor R, Ursa MA, Ashman LK, de Landazuri MO, Sanchez-Madrid F. Regulation of endothelial cell motility by complexes of tetraspan molecules CD81/TAPA-1 and CD151/PETA-3 with alpha3 beta1 integrin localized at endothelial lateral junctions. J Cell Biol. 1998;141:791–804. doi: 10.1083/jcb.141.3.791. [DOI] [PMC free article] [PubMed] [Google Scholar]


