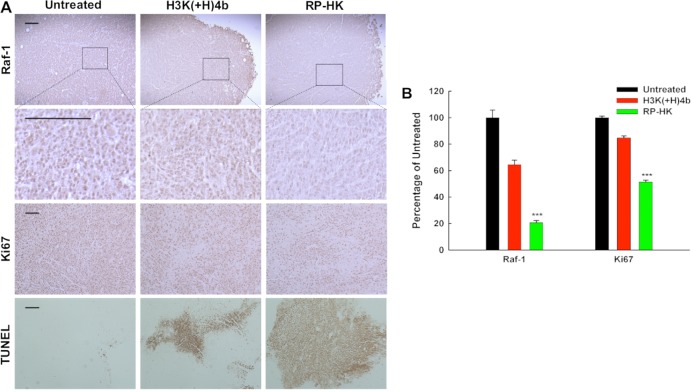
Figure 8.
Histochemical analysis of Raf-1, Ki67, and apoptosis. (A) Scale bars equal 10 μm. (B) Quantification of cells staining positive for Raf-1 and Ki67 with different treatments is shown, expressed as the percentage of untreated control. The data represent the mean ± SD of percentage of four images for each treatment. ***, P < 0.001.

