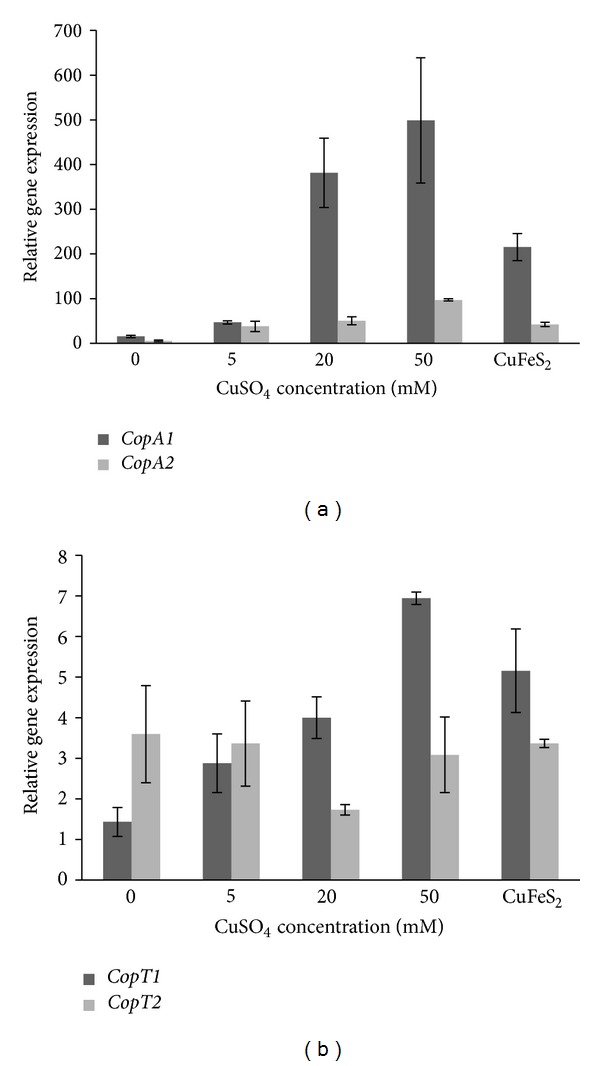
Figure 8.

Relative expression levels of S. metallicus genes copA1 and copA2 (a) copT1 and copT2 (b). Expression of S. metallicus cop genes wasassessed by qRT-PCR and normalized against 16S rRNA gene expression in individual cultures. Mean values and standard deviations are from analyses of three independent cultures grown in the presence of 0, 5, 20, 50 mM Cu or in 1% of a chalcopyrite ore (CuFeS2) concentrate.
