Abstract
Selective two-electron plus two-proton (2e−/2H+) reduction of O2 to hydrogen peroxide by ferrocene (Fc) or 1,1′-dimethylferrocene (Me2Fc) in the presence of perchloric acid is catalyzed efficiently by a mononuclear copper(II) complex, [CuII(tepa)]2+ {tepa = tris[2-(2-pyridyl)ethyl]amine} (1) in acetone. The E1/2 value for [CuII(tepa)]2+ as measured by cyclic voltammetry is 0.07 V vs Fc/Fc+ in acetone, being significantly positive, which makes it possible to use relatively weak one-electron reductants such as Fc and Me2Fc for the overall two-electron reduction of O2. Fast electron transfer from Fc or Me2Fc to 1 affords the corresponding CuI complex, [CuI(tepa)]+ (2), which reacts at low temperature (193 K) with O2, however only in presence of HClO4 to afford the hydroperoxo complex, [CuII(tepa)(OOH)]2+ (3). The detailed kinetic study on the homogeneous catalytic system reveals the rate-determining step to be the O2-binding process in the presence of HClO4 at lower temperature as well as at room temperature. The O2-binding kinetics in the presence of HClO4 were studied, demonstrating that the rate of formation of the hydroperoxo complex (3) as well as the overall catalytic reaction remained virtually the same with changing temperature. The apparent lack of an activation energy for the catalytic two-electron reduction of O2 is shown to result from the existence of a pre-equilibrium between 2 and O2 prior to the formation of the hydroperoxo complex 3. No further reduction of [CuII(tepa)(OOH)]2+ (3) by Fc or Me2Fc occurred, and instead 3 is protonated by HClO4 to yield H2O2 accompanied by regeneration of 1, thus completing the catalytic cycle for the two-electron reduction of O2 by Fc or Me2Fc.
Introduction
Among copper proteins containing one or more copper ions as active site prosthetic groups, many are involved in dioxygen (O2) processing and they can be classified into several types depending on their function and their specific copper ion coordination environments.1,2 Suitable ligation of the reduced form CuI complexes includes N-, S- or O-atom donor elements which at some point in the protein catalytic cycle allows for reaction with O2 to generate copper-O2 complexes, CuIIn(O2) (n = typically 1-3), which are utilized for O2-transport (2CuI + O2 ↔ Cu2(O2)) and substrate oxygenation.1-4 Galactose oxidases5 and amine oxidases,6 which are one class of copper oxidases, catalyze two-electron substrate oxidations, while reducing O2 to hydrogen peroxide (H2O2).7 Multicopper oxidases such as laccase also activate oxygen at a site containing a three-plus-one arrangement of four Cu atoms, exhibiting remarkable electroactivity for the four-electron reduction of oxygen at potentials approaching the thermodynamic value of 1.2 V (vs RHE).8 Cytochrome c oxidases (CcOs), with a bimetallic active site consisting of a heme a and Cu (Fea3/CuB) are also capable of catalyzing the four-electron reduction of dioxygen to water while coupling this process to membrane proton translocation and evenually to ATP biosynthesis.9,10
The catalytic four-electron reduction of dioxygen (O2) to water has merited increasing attention because not only to aid the elucidation of fundamental principles relevant to biological processes (as above), but also due to the technological significance such as in fuel cell applications.11-18 In the fuel cell, the four-electron reduction of O2 is catalyzed at the cathode by platinum impregnated in carbon.19,20 The high loadings of this precious metal that are required to achieve appreciable activity have prompted considerable activity in the development of catalysts based on non-precious metals such as Co, Cu and Fe.21-27
The catalytic two-electron reduction of O2 to H2O2 has also attracted considerable interest, because H2O2 has been regarded as a promising candidate as a sustainable and clean energy carrier.28-30 The free enthalpy change of the decomposition of hydrogen peroxide producing H2O and O2 is as large as −211 kJ mol−1.31 H2O2 has also been used as a highly efficient and environmentally benign oxidant in terms of delignification efficiency and the reduction of negative ecological impacts.32,33
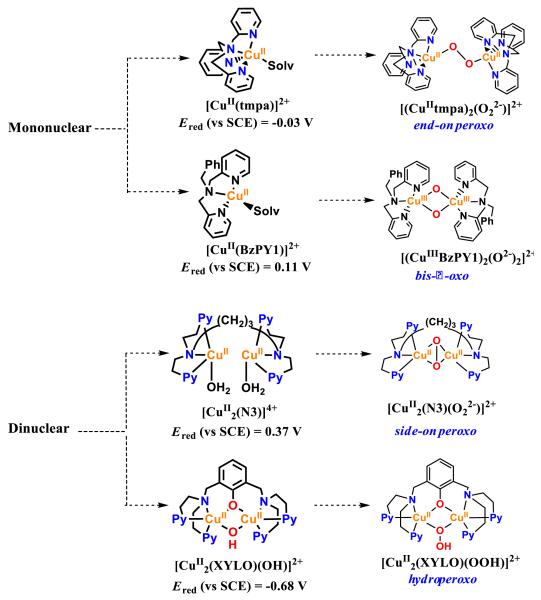
With regard to copper complex catalysts for O2 reduction,17 two mononuclear copper complexes having tmpa or bzpy1 ligands (tmpa = tris(2-pyridylmethyl)amine),24a BzPY1 = N,N-bis[2-(2-pyridyl)ethyl]benzylamine]24b and one dinuclear copper complex with N3 ligand (N3 = -(CH2)3-linked bis[(2-(2-pyridyl)ethyl)amine])24b (Scheme 1) have so far been found to efficiently catalyze four-electron reduction of O2 via the formation of [{(TMPA)CuII}2(μ-1,2-O22−)]2+, [CuIII2(BzPY1)(μ-(O2−)2)2+ and [CuII2(N3)(μ-η2:η2-O22−)]2+ intermediates, respectively. These Cu-O2 complexes were prone to reductive O-O bond cleavage with protons to give water, in preference to the protonation leading to H2O2.24 By contrast, a binuclear Cu(II) complex [CuII2(XYLO)(OH)]2+ (Scheme 1) {where XYLO is a m-xylene-linked bis[(2-(2-pyridyl)ethyl)amine dinucleating ligand with copper-bridging phenolate moiety} has been reported to catalyze the two-electron reduction of O2 in the presence of trifluoroacetic acid via a hydroperoxo intermediate.26 In all of these cases, however, a strong one-electron reductant such as decamethylferrocene (Fc*) was required to reduce O2 with these Cu complex catalysts. In order to use weaker reductants, the one-electron reduction potentials of CuII complexes should be more positive those found for [CuII2(XYLO)(OH)]2+ (−0.67 V vs SCE).26 However, CuI complexes with rather positive one-electron oxidation potentials cannot react with O2, as reported previously.34 Thus, there has so far been no report on the selective two- or four-electron reduction of O2 by weaker one-electron reductants than Fc* with Cu complexes.
Scheme 1.
We report herein the selective two-electron reduction of O2 by ferrocene (Fc) and 1,1′-dimethylferrocene (Me2Fc), which are much weaker one-electron reductants than Fc*, using a mononuclear copper (II) complex, [CuII(tepa)]2+ {tepa = tris[2-(2-pyridyl)ethyl]amine} (1) in the presence of HClO4 in acetone. This behavior is in sharp contrast to that observed for the analogous complex [CuII(tmpa)]2+ {tmpa = tris[2-(2-pyridyl)methyl]amine}, which catalyzes the four-electron reduction of O2 to water rather than the two-electron reduction of O2 to H2O2 in presence of HClO4 in acetone; there, a strong one-electron reductant was required.24a Thus, a difference of an additional one -CH2-(methylene group) in the pyridylalkyl moiety of the ligand for CuII, N(CH2CH2-py)2 vs. N(CH2-py)2 (py = 2-pyridyl), results in (i) a remarkable difference in terms of number of electrons by which moleclular oxygen is reduced (two electrons vs four-electrons) and (ii) the reducing ability of one-electron reductants that can be employed to reduce O2. More surprisingly, the rate of catalytic two-electon reduction of O2 by Me2Fc with 1 exhibits no temperature dependence. However, our study and analysis of the seemingly bizarre results suggesting there is no apparent activation energy for the catalytic reduction of O2 can in fact be well understood. We have done this by clarifying the catalytic mechanism based on kinetic analyses as well as detection of the reactive intermediates involved in the catalytic cycle.
Experimental Section
Materials
Reagent grade quality solvents and chemicals were obtained commercially and used without further purification un-less otherwise noted. 1,1/-dimethylferrocene (Me2Fc), ferrocene (Fc), hydrogen peroxide (30%) and HClO4 (70%) were pur-chased from Aldrich Co., U.S., and NaI (99.5%) was from Junsei Chemical Co., Japan. Acetone was purchased from JT Baker, U.S., and used either without further purification for non-air-sensitive experiments. For air-sensitive experiments, acetone was dried and distilled under argon and then deoxygenated by bubbling with argon for 30–45 min and kept over activated molecular sieves (4 Å) in a glove box.35 Preparation and handling of air-sensitive compounds were performed under an Ar atmosphere (<1 ppm O2, <1 ppm H2O) in a glovebox (Korea Kiyon Co., Ltd.). The copper complex [CuII(tepa)](ClO4)2 (1) (tepa = tris(2-(2-pyridyl)ethylamine)34 was prepared according to the literature procedure.36
Instrumentation
UV – vis spectra were recorded on a Hewlett-Packard 8453 diode array spectrophotometer equipped with a UNISOKU Scientific Instruments Cryostat USP-203A for low-temperature experiments or an UNISOKU RSP-601 stopped-flow spectrometer equipped with a MOS-type highly sensitive photodiode array. Cyclic voltammetry (CV) and differential pulse voltammetry (DPV) measurements were performed on an ALS 630B electrochemical analyzer, and voltammograms were measured in deaerated acetone containing 0.10 M tetra-n-butylammonium hexafluorophosphate (TBAPF6) as a supporting electrolyte at room temperature. A conventional three-electrode cell was used with a glassy carbon working electrode (surface area of 0.3 mm2), and a platinum wire was the counter electrode. The glassy carbon working electrode was routinely polished with a BAS polishing alumina suspension and rinsed with acetone before use. The potentials were measured with respect to the Ag/AgNO3 (10 mM) reference electrode and were converted to values vs ferrocene/ferrocenium ion (Fc/Fc+). All electrochemical measurements were carried out under an atmospheric nitrogen pressure. X-band EPR spectra were recorded at 77 K using a JEOL JES-RE1XE spectrometer. The magnitude of modulation was chosen to optimize the resolution and signal-to-noise (S/N) ratio of the observed spectra under non-saturating microwave power conditions. The g values and hyperfine coupling constants were calibrated using an Mn2+ marker. The experimental parameters for EPR spectra were as follows: microwave frequency = 9.2 GHz, microwave power = 1.0 mW and modulation frequency = 100 kHz. The EPR parameters were determined by anisotropic simulation using an AniSimu/FA version 2.0.0 program coded by JEOL Ltd.
Kinetic Measurements
Spectral change in the UV–visible range were recorded on a Hewlett-Packard 8453 diode array spectrophotometer equipped with Unisoku thermostatted cell holder for low temperature experiments. Rate constants for oxidation reactions of ferrocene derivatives by O2 in the presence of catalytic amounts of [CuII(tepa)]2+ and an excess amount of perchloric acid (HClO4) in acetone at 298 K were determined by monitoring the appearance of the absorption band due to the corresponding ferrocenium ions (Fc+: λmax = 620 nm, εmax = 430 ± 20 M−1 cm−1. Me2Fc+: λmax = 650 nm, εmax = 360 ± 20 M−1 cm−1). The limiting concentration of O2 in an acetone solution was prepared by a mixed gas flow of O2 and Ar. The mixed gas controlled by using a gas mixer (SMTEK, Korea), which can mix O2 and Ar gases at specific pressures and flow rates. The O2 concentration in an O2-saturated acetone solution (11 mM) was previously determined by spectroscopic titration in the photooxidation of 10-methyl-9,10-dihydroacridine by O2.37
Spectroscopic Measurements
The amount of H2O2 produced in reactions was determined by titration with iodide ion.38 The diluted acetone solution of the reduced product of O2 was treated with an excess of NaI. The amount of I3− formed was then quantified using its visible spectrum [λmax = 365 nm, ε = (2.5 ± 0.1) × 104 M−1 cm−1].
Low-Temperature Measurements
Under an open atmosphere, [CuI(tepa)](ClO4)2 (1) (0.16 × 10⁻³ M) was dissolved in 3 mL of O2-free acetone. The cuvette was cooled to –80 °C in a Hewlett-Packard 8453 diode array spectrophotometer equipped with an Unisoku thermostatted cell holder. HClO4 (3.0 × 10⁻³ M) was added into the reaction solution, the formation of the hydroperoxo species was followed by the change in the absorbance at 345 nm (ε = 7000 ± 100 M−1 cm−1) determined for [CuII(tepa)(OOH)]+.
Results and Discussion
Electrocatalytic Reduction of O2 with [CuII(tepa)](ClO4)2 (1) in the Presence of HClO4
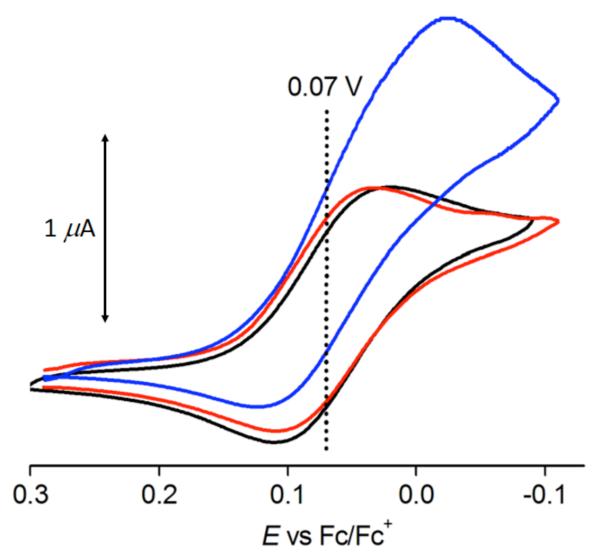
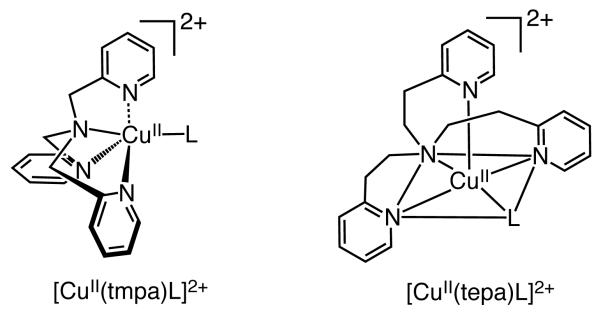
A cyclic voltammogram (CV) of 1 in deaerated acetone containing TBAPF6 (0.10 M) at 298 K is shown in Figure 1. A quasi-reversible couple between the CuII and CuI forms of complex is observed. From the E1/2 values, the one-electron reduction potentials (Ered) of 1 was determined to be 0.07 ± 0.01 V (vs Fc/Fc+) (Figure 1, black line). The longer-armed tepa ligand, as compared to that observed in the tmpa ligand (Chart 1), leads to a complex 1 with coordination of a solvent (L), that is nearly perfectly square-based pyramidal in structure, results in nearly 0.5 V more positive shift of Ered as compared with that of [CuII(tmpa)]2+ (A) (Ered vs Fc/Fc+ = −0.40 V).24a The tepa ligand forms six-membered chelates ring in 1, whereas the tmpa ligand forms only five-membered chelate rings in [CuII(tmpa)]2+ (Chart 1). Such a change from the five to the six membered ring is generally known to result in a large positive shift in the CuII/I redox potential.39 This effect has its origin in the difference in ligand binding constants to Cu(II), which are much larger for five- vs six-membered chelate rings in multidentate ligands, as elucidated and summarized by Rorabacher and coworkers.39c,39d
Figure 1.
Cyclic voltammograms of 1 (1.0 mM) in deaerated (black line) and O2-saturated (red line) acetone in the absence of HClO4 and in the presence of HClO4 (0.10 M) in O2-saturated acetone (blue line) at 298 K. Working and counter electrodes were a glassy carbon electrode and a Pt wire, respectively. TBAPF6 (0.10 M) was used as an electrolyte. Sweep rate was 1.0 mV s−1.
Chart 1.
The redox wave of the CuII/I couple of 1 without HClO4 in the presence of O2 (red line in Figure 1) remains the same as that in the absence of O2 (back line in Figure 1). In the presence of both O2 and HClO4, however, a catalytic cathodic current is observed (blue line in Figure 1), indicating that O2 can be reduced catalytically by 1 in the presence of HClO4 in acetone. A slow sweep rate (1.0 mV s−1) is required to observed the catalytic cathodic current, indicating that the catalysis is a relatively slow process (vide infra).
Catalytic Two-Electron Reduction of O2 by Me2Fc and Fc with 1 in the Presence of HClO4
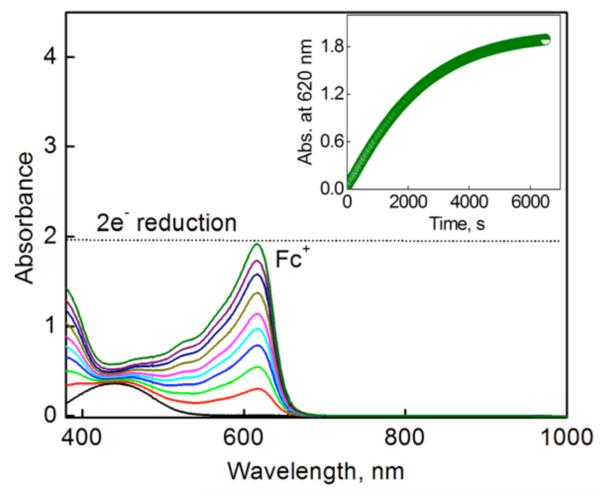
The addition of a catalytic amount of 1 to an acetone solution of Fc/Me2Fc containing O2 ([O2] = 2.2 mM) and perchloric acid (HClO4) results in the efficient dioxygen reduction to afford the corresponding ferrocenium/dimethylferrocinium cation (Fc+/Me2Fc+) as shown in Figure 2 [see also Figure S1 in Supporting Information (SI)], where 2 equiv of Fc+ (λmax = 620 nm) or Me2Fc+ (λmax = 650 nm), relative to the number of mole equiv of O2, were formed in the presence of excess HClO4. Thus, the stoichiometry of the catalytic oxidation of Fc and Me2Fc by O2 is given by eq 1. The formation of H2O2 was confirmed by iodometric titration (Figure S2a in SI). The amount of I3− produced (λmax = 365 nm) was the same as that produced by the reaction of the stoichiometric amount of H2O2 with I− (Figure S2b in SI).
| (1) |
Figure 2.
UV-vis spectral changes observed in the two-electron reduction of O2 (2.2 mM) by Fc (10 mM) with HClO4 (40 mM) catalyzed by 1 (0.040 mM) in acetone at 298 K. The inset shows the time profile of the absorbance at 620 nm due to Fc+.
The rate of formation of Fc+ and Me2Fc+ obeyed pseudo-first order kinetics under the conditions that [1] << [O2] << [Me2Fc] << [HClO4] (Figure 2 inset; Figure S1 inset in SI). Because two equiv of Fc+ is formed in the reduction of O2 (eq 1), the pseudo-first-order kinetics of formation of Fc+ are given by eq 2, where the initial concentration of O2 ([O2]0) is equal to two times of the final concentration of Fc+ (2[Fc+]f); [Fc+] = 2{[O2]0 - [O2]}. The time profiles of the absorbance at 620 nm
| (2) |
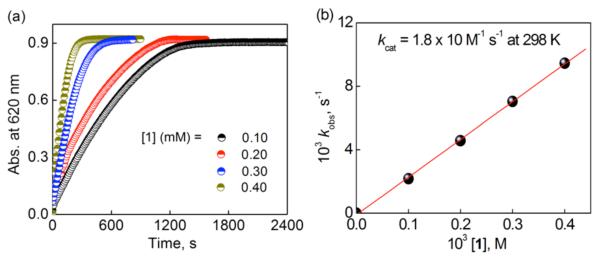
due to Fc+ and at 650 nm due to Me2Fc+ and the first-order plots by varying catalyst (Figure 3a; see also Figures S4a, S5a and S5b in SI), HClO4 (Figures S3a, S4b, S5c and S5d in SI), O2 (Figures S3c, S4c, S6a and S6b in SI) and electron donors, Fc (Figures S3b and S4d in SI) and Me2Fc (Figures S6c and S6d in SI), are shown as indicated. The pseudo-first order rate constant (kobs) increased linearly with increasing concentration of 1 (Figure 3b; Figure S7a in SI), HClO4 (Figure 4a; Figure S7b in SI) whereas the kobs value remains the same with increasing concentration of O2 (Figures S3d and S7c in SI; note that the reaction rate is already first order with respect to [O2], cf eq 2), Fc (Figure 4b) and Me2Fc (Figures S7d in SI). Thus, the overall rate expression is given by eq 3, where kcat is the apparent third-order rate constant for the catalytic two-electron reduction of O2 by Fc and Me2Fc. The kinetic formulation in eq 3 obtained in this study is quite unique because the rate
| (3) |
is proportional to concentrations of not only the catalyst 1 but also O2 and HClO4. In such a case, the rate-determining step in the catalytic cycle should involve the reactions of 1 with O2 and H+. In order to elucidate the catalytic mechanism that could explain such a unique kinetic formulation, we decided to examine each step in the catalytic cycle, step by step.
Figure 3.
(a) Time profiles of the absorbance at 620 nm due to Fc+ in the two-electron reduction of O2 ([O2] = 1.0 mM) catalyzed by 1 (0.10 mM (black), 0.20 mM (red), 0.30 mM (blue), and 0.40 mM (dark yellow)) with Fc (10 mM) in the presence of HClO4 (60 mM) in acetone solution at 298 K. (b) Plot of kobs versus [1] for the two-electron reduction of O2 ([O2] = 1.0 mM) catalyzed by 1 with Fc (10 mM) in the presence of HClO4 (60 mM) in acetone at 298 K.
Figure 4.
(a) Plot of kobs versus [HClO4] for the two-electron reduction of O2 by Fc (10 mM) catalyzed by 1 (0.10 mM) in an acetone solution containing O2 (1.0 mM) at 298 K. (b) Plot of kobs versus [Fc] for the two-electron reduction of O2 catalyzed by 1 (0.10 mM) with Fc in the presence of HClO4 (30 mM) in an acetone solution containing O2 ([O2] = 1.0 mM) at 298 K.
We also examined the overall catalytic reaction at different temperatures. Remarkably, variable temperature studies revealed that the catalytic rate was not affected by changes in temperature (Figure 5).
Figure 5.
(a) Time profiles of the absorbance at 620 nm due to Fc+ in the two-electron reduction of O2 (1.0 mM) catalyzed by 1 (0.10 mM) with Fc (10 mM) in the presence of HClO4 (60 mM) in an acetone solution at variable temperatures (283 K (red), 298 K (black) and 313 K (blue)). (b) Plot of kobs versus temperature (T) for the two-electron reduction of O2 catalyzed by 1 (0.10 mM) with Fc (10 mM) in the presence of HClO4 (60 mM) in an acetone solution with O2 ([O2] = 1.0 mM) at different temperatures.
Electron Transfer from Ferrocene Derivatives to 1
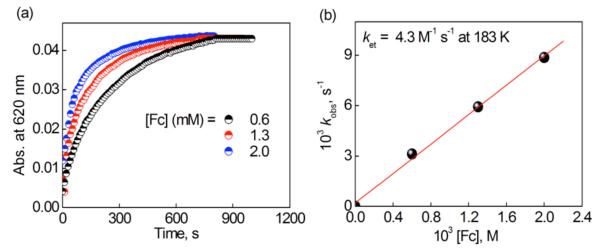
Electron transfer from Fc and Me2Fc (Eox = 0.0 V and −0.11 V vs Fc/Fc+)40,41 to 1 (Ered = 0.07 V vs Fc/Fc+, vide supra) occurs efficiently because the reactions are exergonic (ΔGet < 0). The rates of electron transfer from Fc or Me2Fc to 1 were too fast to be determined at 298 K. Thus, these kinetics were determined at lower temperatures. The rate of formation of Fc+ and Me2Fc+ obeyed pseudo-first-order kinetics in acetone at lower temperatures (see the time profiles in Figures 6a, S8a, S8c, S9a, S11a, S11c, S12a and S12c; first-order plots in Figures S8b, S8d, S9b, S10a, S11b, S11d, S12b and S12d in SI). The observed pseudo-first-order rate constant (kobs) increased linearly with increasing concentration of Fc and Me2Fc (Figure 6b; see also Figures S10 and S13 in SI). The second-order rate constant (ket) for electron transfer from Fc to 1 was determined from the slope of a linear plot of kobs versus [Fc]. The temperature dependence of ket was examined (Figure S14 in SI) and the second-order rate constant of electron transfer from Fc and Me2Fc to 1 at 298 K was determined to be (6.0 ± 0.3) × 104 M−1 s−1 and (6.1 ± 0.3) × 104 M−1 s−1, respectively, from extrapolations of the Eyring plots (Figure S14 in SI). The ket values for electron transfer from Fc or Me2Fc to 1 are significantly larger than the corresponding kobs/[1] (see eq 2) values (18 ± 1 M−1 s−1 in Figure 3b for Fc and 17 ± 1 M−1 s−1 in Figure S7a for Me2Fc), respectively. Thus, it has been confirmed that the electron-transfer step is not the rate-determining step in the catalytic cycle, being consistent with the kinetic equation (eq 2), where the kobs values were independent of the concentrations of [Fc] and [Me2Fc]. (Figures 4b and S7d).
Figure 6.
(a) Time profiles of the absorbance at 620 nm due to Fc+ in the electron transfer reaction from Fc (0.60 mM (black), 1.3 mM (red) and 2.0 mM (blue)) to 1 (0.10 mM) in acetone at 183 K and (b) Plot of kobs versus [Fc] in the electron transfer from Fc to [CuII(tepa)]2+ (1) (0.10 mM) in an acetone solution at 183 K.
The Eyring plot (Figure S14) affords the activation enthalpy (ΔH≠ = 9.5 ± 0.2 kcal mol−1 and 9.2 ± 0.2 kcal mol−1) and activation entropy (ΔS≠ = −3 ± 2 cal K−1 mol−1 and −2 ± 2 cal K−1 mol−1) for Fc and Me2Fc reaction, respectively. An activation entropy close to zero was previously reported for electron transfer from ferrocene derivatives to Cu(II) complexes.26,42 The electron transfer from Fc and Me2Fc to 1 results in formation of the Cu(I) complex, [CuI(tepa)]+ (2), which can reduce O2 in presence of HClO4. Next we examined the reaction of [CuI(tepa)]+ with O2 in presence of HClO4 at low temperatures to detect intermediates.
Detection of Intermediates in the Catalytic Two-Electron Reduction of O2 by Fc with [CuII(tepa)]2+ (1)
When 1 was treated with O2 and HClO4, a bright green colored hydroperoxo complex 3 (vida infra) was produced, possessing an intense absorption band at 345 nm (ε = 7000 ± 100 M−1 cm−1) corresponding to a LMCT band (HOO− → Cu), and a d-d transition envelope at 660 nm (ε = 160 ± 5 M−1 cm−1) (Figure 7).
Figure 7.
Formation of the hydroperoxo complex, [CuII(tepa)(OOH)]+ (3) (λmax = 345 nm) in the reaction of [CuI(tepa)]+ (0.16 mM) {[CuI(tepa)]+ was generated from room temperature mixing of [CuII(tepa)]2+ (0.16 mM) with Fc (0.32 mM)} with O2 (2.2 mM) in acetone at 193 K in the presence of HClO4 (3.0 mM). The inset shows the time profile of the absorbance at 345 nm due to the generation of [CuII(tepa)(OOH)]+ (3).
The stoichiometry of O2 binding step in presence of HClO4 was determined by a control reaction. When Fc was used exactly at the level of one equiv relative to [CuII(tepa)]2+ (Figure S15), the amount of 3 produced is about one-half judging from a comparison of the results in Figure 7 with those in Figure S15. Thus, the stoichiometry of formation of 3 from the copper(I) complex is: [CuI(tepa)]+ + Fc + O2 → [CuII(tepa)(OOH)]+ (3).
The formation of hydroperoxo complex was again checked by an alternative “authentic” method. Figure S16 shows the spectral change for the reaction of complex [CuII(tepa)]2+ (1) and H2O2 (10 equiv) in acetone at 193 K in the presence of 2 equiv of Me4NOH. The result is that the same absorption band at 345 nm (ε = 7000 ± 100 M−1 cm−1) appears together with a d-d band at 660 nm (ε =160 ± 5 M−1 cm−1) (see Figure S16).
It should be noted here that Masuda, Kodera and Itoh and their coworkers have reported on similar Cu(II)-hydroperoxo complexes with tridentate N3 or tetradentate N4 pyridylalkylamine ligands, such as the ligand bpba (bpba = bis(2-pyridylmethyl-tert-butylamine) which has a strong absorption band at 350 nm (ε = 3400 ± 100 M−1 cm−1) and d-d bands at 564 nm (ε = 150 ± 5 M−1 cm−1) and 790 (sh).43 There were several other Cu(II)-hydroperoxo complexes reported hitherto having LMCT bands which lie in the highest energy region (380 nm for five-coordinate trigonal bipyramidal [Cu(bppa)(OOH)]+ where bppa = bis(6-pivalamido-2-pyridylmethyl)(2-pyridylmethyl)amine,44 357 nm for five-coordinate square-pyramidal [Cu(N3S-type)(OOH)]+ where N3S = 2-bis(6-methyl-2-pyridylmethyl)amino-1-(phenylthio)-ethane,45 395 nm for five-coordinate [CuII2(XYL-O)-(OOH)]2+ where XYL-O = 2,6-bis[bis[2-(2-pyridyl)ethyl]-amino]phenolate,46 and 379 nm for five-coordinate [CuII(tmpa)(OOH)]+ where tmpa = tris(2-pyridylmethyl)amine.43,47
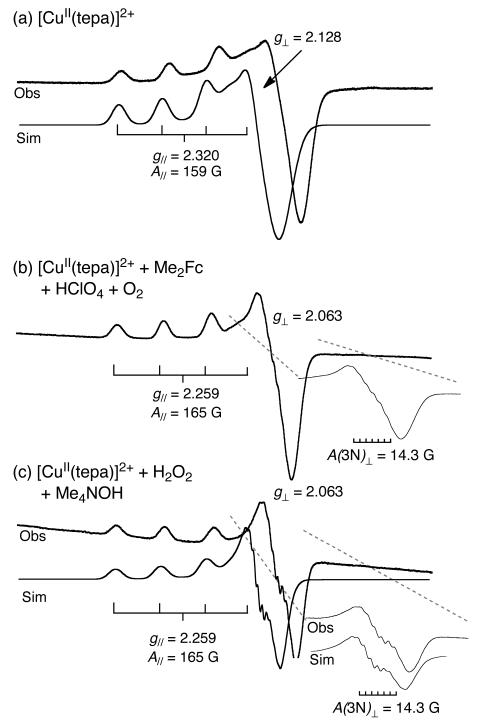
An EPR spectrum of [CuII(tepa)]2+ in frozen acetone solution at 77 K exhibits the parameters, g∥ = 2.320 ± 0.002, g⊥ = 2.128 ± 0.001 and |A∥| = 159 ± 3 G, indicating the typical tetragonal spectrum for four-lines in the downfield region due to Cu nuclear spin (I = 3/2) (Figure 8a). The reaction of [CuI(tepa)]+ (2), which was produced by the electron-transfer reduction of [CuII(tepa)]2+ (1) by Me2Fc, with O2 in the presence of HClO4 in acetone afforded an EPR spectrum at 77 K with EPR parameters of g∥ = 2.259 ± 0.002, g⊥ = 2.063 ± 0.001 and |A∥| = 165 ± 3 G due to Cu with superhyperfine splitting due to three equivalent nitrogens (|A(3N)⊥| = 14.3 ± 0.5 G) as shown in Figure 8b. This spectrum is clearly different from that of [CuII(tepa)]2+ (see Figure 8a) whereas the same EPR spectrum was observed at 77 K for [CuII(tepa)OOH]+, which was produced by the reaction of [CuII(tepa)]2+ with H2O2 in the presence of Me4NOH in acetone. The computer simulated spectra of [CuII(tepa)]2+ and [CuII(tepa)OOH]+ with the EPR parameters described above agree perfectly with the observed spectra as shown in Figure 8.48
Figure 8.
X-band EPR spectra of (a) [CuII(tepa)]2+ (5.0 × 10⁻⁵ M) in deaerated acetone at 77 K, (b) the reaction solution of 1 (5.0 × 10⁻⁵ M) with Me2Fc (3.0 × 10⁻⁴ M) in the presence of HClO4 (3.0 × 10⁻³ M) in O2-saturated acetone at 77 K and (c) [CuII(tepa)(OOH)]+ (3) generated by reaction of [CuII(tepa)]2+ (5.0 × 10⁻⁵ M) with H2O2 (1.0 × 10⁻³ M) in presence of Me4NOH (1.0 × 10⁻³ M) recorded in deaerated acetone at 77 K. The experimental parameters: microwave frequency = 9.2 GHz, microwave power = 1.0 mW and modulation frequency = 100 kHz. The simulated spectra were obtained with the EPR parameters of g∥ = 2.320, g⊥ = 2.128, A∥ = 159 G, A⊥ = 25 G, linewidth σ∥ (σzz) = 48 G, σ⊥ = σxx = σyy = 100 G for [CuII(tepa)]2+ and g∥ = 2.259, g⊥ = 2.063, A∥ = 165 G, A⊥ = 22 G, linewidth σ∥ (σzz) = 25 G, σxx = 10 and σyy =70 G for Cu and 14.3 G for 3N of [CuII(tepa)(OOH)]+.
A similar EPR spectrum was reported for [Cu(bpba)(OOH)]+ with EPR parameters of g∥ = 2.26, g⊥ = 2.06 and |A∥| = 175 G in acetone at 77 K, although no superhyperfine due to nitrogens was observed in that case.43 Thus, the EPR spectrum observed in Figure 8b together with the LMCT band seen in the higher energy region in Figure 7 strongly suggests the formation of [CuII(tepa)OOH]+ in the reaction of [CuI(tepa)]+ with O2 in the presence of HClO4 in acetone.
[CuI(tepa)]+ (2) was known to be unreactive towards O2 in the absence of HClO4.34 This lack of reactivity likely results from a combination of steric hindrance, electronic effects and also from the complex’s high positive redox potential. The crystal structures of [CuII(tepa)]2+ (1) and [CuI(tepa)]+ were reported earlier.49,50 The structural parameters clearly indicate that both the complexes are strongly constrained. Because the arm size of the tepa ligand is larger than tmpa ligand, any steric effects may be more prominent with tepa’s six membered chelate rings; the pyridyl rings of the donor ligands may extend out more into the region around the CuII ion where a fifth ligand, such as hydroperoxide anion, would approach and bind the metal ion.
In another homologous set of structures, [CuII(tepa)Cl]+ and [CuII(tmpa)Cl]+, the CuII-Cl bond is also found to be lengthened in the tepa case, by 0.056 Å.39a In fact, in all tepa vs. tmpa CuII pentacoordinate structures, [CuII(tepa)X]2+/+, the anionic or neutral X ligand is in an equatorial position of an overall square-based pyramidal structure, while the X-ligand in [CuII(tmpa)X]2+/+ structures is in an axial position of a nearly perfect trigonal bipyramidal coordination environment.34,39a For [CuII(tepa)-OOH]+, due to (i) the hydroperoxo-ligand position in the coordination environment or (ii) because of a likely elongated Cu-O bond, (iii) or both, cleavage by acid to produce H2O2 is preferred. This is in contrast to the O-O reductive cleavage which is observed for the intermediate [CuII(tmpa)OOH]+ species likely formed during the four-electron four proton reduction of O2 to water using [CuII(tmpa)]2+ as catalyst (vide infra).24a
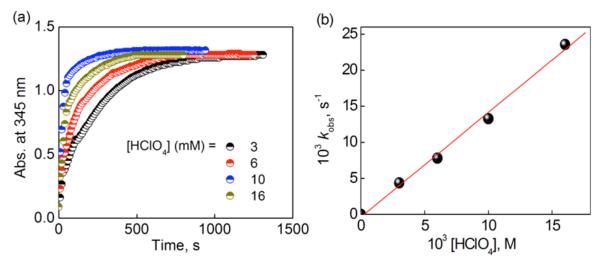
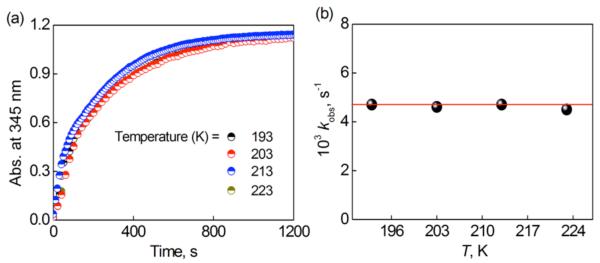
The rate of formation of [CuII(tepa)OOH]+ at 193 K obeyed first-order kinetics (Figures 9a and S17) and the psuedo-first-order rate constant increased in proportion to the concentration of HClO4 (Figure 9b). The observed rate constant exhibits no temperature dependence in the range between 193 and 223 K (Figures 10 and S18 in SI). The apparent zero activation energy or even negative activation energy has precedence and has been observed for reactions when an intermediate first forms and when the absolute value of the heat of formation of the indermediate is equal to or larger than the activation enthalpy of the subsequent conversion of imtermediate to the products, i.e., −ΔH ≥ ΔH≠.51-55
Figure 9.
(a) Time profiles of the absorbance at 345 nm due to [CuII(tepa)(OOH)]+ (3) in the O2 (2.2 mM) binding step to [CuI(tepa)]+ (0.18 mM) ([CuI(tepa)]+ was produced from room temperature mixing of [CuII(tepa)]2+ (0.18 mM) with Fc (0.36 mM)) in the presence of various concentrations of HClO4 (3 mM (black), 6 mM (red), 10 mM (blue) and 16 mM (dark yellow)) in an acetone solution at 193 K. (b) Plot of kobs versus [HClO4] for the O2 (2.2 mM) binding step to [CuI(tepa)]+ (0.18 mM) in the presence of various concentrations of HClO4.
Figure 10.
(a) Time profiles of the absorbance at 345 nm due to [CuII(tepa)(OOH)]+ in the O2 ([O2] = 2.2 mM) binding step in the presence of HClO4 (3.0 mM) with [CuI(tepa)]+ (0.16 mM) ([CuI(tepa)]+ was produced from room temperature mixing of [CuII(tepa)]2+ (0.16 mM) with Fc (0.32 mM)) at different temperatures (193 K (black), 203 K (red), 213 K (blue) and 223 K (dark yellow)). (b) Plot of kobs versus T (K) in the O2 (2.2 mM) binding process to [CuI(tepa)]+ (2) (0.16 mM) with HClO4 (3.0 mM) in an acetone solution at variable temperatures.
In the case of [CuI(tmpa)]+, the reaction of [CuI(tmpa)]+ with O2 is known to produce the superoxo complex [CuII(tmpa)(O2·−)]+. The ΔH and ΔS values were reported to be −11 kcal mol−1 and −23 cal K−1 mol−1, respectively, when the ΔG value at 193 K is −6.7 kcal mol−1.56 This indicates the formation of the superoxo complex is highly exergonic. The formation of [CuII(tmpa)(O2·−)]+ is followed by the reduction with another molecule of [CuI(tmpa)]+ to produce the dinuclear copper(II)-peroxo (end-on) complex.56
In the case of [CuI(tepa)]+, neither a superoxo nor peroxo complex has been observed by the reaction with O2 at 193 K. Thus, the ΔG value of formation of the superoxo complex, [CuII(tepa)(O2·−)]+ must be positive. The activation barrier to access the superoxo complex in the absence of protons is too high. However, this does not necessarily mean that the ΔH value is also positive. If the ΔS value of formation of [CuII(tepa)(O2·−)]+ is the same as that of [CuII(tmpa)(O2·−)]+, i.e., large and negative, the ΔG value becomes positive (endergonic, therefore no formation) when the ΔH value is more positive than −5.0 kcal mol−1.
Thus, the ΔH value of formation of [CuII(tepa)(O2·−)]+ could be negative enough to compensate for the ΔH≠ value required for the subsequent PCET reduction to produce the peroxo complex, [CuII(tepa)OOH]+, formation of which was observed at 193 K as shown in Figure 7. The energetics of formation of [CuII(tepa)OOH]+ via the PCET reduction of [CuII(tepa)(O2·−)]+ are shown in Scheme 2. If the −ΔH value of formation of [CuII(tepa)(O2·−)] happens to be equal or very close to the ΔH≠ value of PCET reduction of [CuII(tepa)(O2·−)] (Scheme 2), the formation rate of [CuII(tepa)OOH]+ would be independent of temperature as observed in this chemical system, see Figures 10 and S18 in SI.
Scheme 2.
No electron transfer from Fc or Me2Fc to the hydroperoxo complex [CuII(tepa)(OOH)]+ (3) occurs, as shown by the data in Figure 11a, where the absorption spectrum due to 3 remained constant by the addition of Fc or Me2Fc. This is the reason why the selective two-electron reduction of O2 by Fc and Me2Fc occurs; that is, the hydroperoxo-copper(II) complex 3 is not susceptible to reduction, and thus with catalyst and HClO4, protonation occurs instead and H2O2 is produced.
Figure 11.
(a) UV-visible spectra of the hydroperoxo species [CuII(tepa)(OOH)+ (3) (0.23 mM) (black line) and 3 (0.23 mM) plus excess Me2Fc (1.5 mM) (red line) to in acetone at 193 K. (b) UV-visible spectral changes of 3 (0.23 mM) in the presence of HClO4 (40 mM) in acetone at 193 K. Inset shows the time profile of the absorbance at 345 nm due to 3.
When excess HClO4 was further added to an acetone solution of [CuII(tepa)(OOH)]+ (3) and Me2Fc, the absorption band due to 3 disappeared without formation of Me2Fc+ (Figure 11b), indicating that the protonation of 3 occurs to yield [CuII(tepa)]2+ (1) and hydrogen peroxide; no reductive cleavage of peroxide occurs, even with the slightly stronger 1,1′-dimethylferrocene reductant.
We have also examined the temperature effect on this protonation step. Variable temperature studies revealed that the rate of protonation of [CuII(tepa)(OOH)]+ (3) became faster with increasing temperature (Figure S19 in SI). The second-order rate constant (k2) was estimated from Eyring plot to be (9.0 ± 0.5) × 102 M−1 s−1 at 298 K, which is much larger than the kobs/[1] values (vide supra). Thus, the protonation of hydroperoxo species is not the rate-determining step under the catalytic conditions.
The Eyring plot also afforded activation enthalpy (ΔH≠ = 8.4 ± 0.2 kcal mol−1)57 and activation entropy (ΔS≠ = −16 ± 0.5 cal K−1 mol−1) parameters for the copper-hydroperoxide protonation step.
Catalytic Mechanism
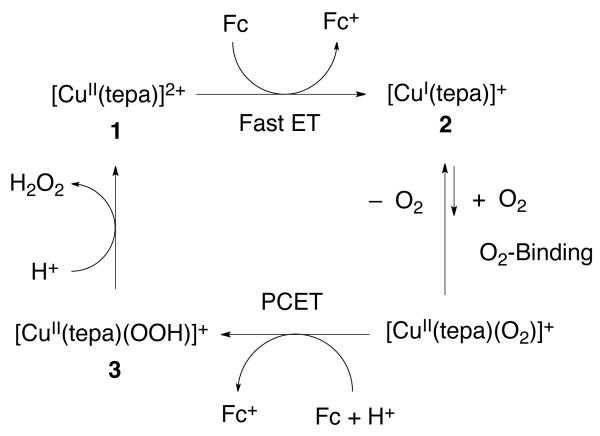
The catalytic mechanism of the two-electron reduction of O2 by Me2Fc and Fc with [CuII(tepa)]2+ (1) in the presence of HClO4 is summarized in Scheme 3. The initial electron transfer from Me2Fc and Fc to 1 is fast, followed by the reaction of the copper(I) complex formed, [CuI(tepa)]+ (2), with O2 in the presence of HClO4 to afford the hydroperoxo complex, [CuII(tepa)(OOH)]+ (3) via the formation of [CuII(tepa)(O2·−)]+, followed by PCET reduction. The fast direct protonation of 3 with HClO4 rather than electron-transfer reduction of 3 by Me2Fc and Fc yields H2O2, accompanied by regenation of 1, leading to the overall catalytic two-electron reduction of O2 by Me2Fc and Fc with HClO4. The O2 binding step to [CuI(tepa)]+ combined with the PCET reduction of [CuII(tepa)(O2·−)] with HClO4 is the rate limiting step in the overall catalytic reaction. The −ΔH value of formation of [CuII(tepa)(O2·−)] is very close to being the same as the ΔH≠ value of the PCET reduction of [CuII(tepa)(O2·−)]+, resulting in unique temperature independent catalytic two-electron reduction of O2 by weak one-electron reductants such as Me2Fc and Fc in the presence of HClO4 in acetone.
Scheme 3.
Conclusion
In summary, we have demonstrated that a subtle difference in ligand architecture, the addition if one -CH2-(methylene group) in the pyridylalkyl moiety of the ligand for CuII in [CuII(tepa)]2+, as compared with chemistry carried out with [CuII(tmpa)]2+, results in the drastic change of the number of electrons reacting in the catalytic reduction of O2, a change from four for [CuII(tmpa)]2+ to two for [CuII(tepa)]2+. The more positive one-electron reduction potential of [CuII(tepa)]2+, in contrast to [CuII(tmpa)]2+, has allowed us to employ relatively weak one-electron reductants, such as Fc and Me2Fc, differing from the case of [CuII(tmpa)]2 which required the use of a strong one-electron reductant such as Fc*. As a consequence, the rate-determining step changed from the electron-transfer reduction of [CuII(tmpa)]2+ to its copper(I) form, to PCET reduction of [CuII(tepa)(O2·−)]+ to form [CuII(tepa)(OOH)]+, This latter process exhibit no temperature dependence due to the cancelation of the heat of formation for the formation of [CuII(tepa)(O2·−)]+ (a negative value) by the subsequent activation enthalpy for the PCET reduction (a positive value). It is also notable, that by use of perchloric acid to help drive the reaction toward Cu(II)-hydroperoxo formation, we have turned a copper(I) complex which is completely unreactive toward O2, to undergo oxygenation and facilitation of catalytic O2-reduction chemistry. This study has provided deeper insight into the control of two-electron vs four-electron reduction of O2, paving a promising way to the future development of efficient catalytic systems for production of H2O2, a promising candidate as a renewable energy source.58,59
Supplementary Material
ACKNOWLEDGMENT
This work was supported by Grants-in-Aid (Scientific Research on Innovative Areas Nos. 20108010 to S.F. and 23750014 to K.O) by NRF/MEST of Korea through CRI (to W.N.), GRL (2010-00353) (to W.N.) and WCU (R31-2008-000-10010-0) (to W.N., S.F. and K.D.K.). K.D.K. also acknowledges support from the USA National Institutes of Health grant, GM28962.
Footnotes
ASSOCIATED CONTENT
Supporting Information. Kinetic analyses (Figures S1 – S20) and full author list for ref 40. This material is available free of charge via the Internet at http://pubs.acs.org.
REFERENCES
- (1).(a) Holm RH, Kennepohl P, Solomon EI. Chem. Rev. 1996;96:2239–2314. doi: 10.1021/cr9500390. [DOI] [PubMed] [Google Scholar]; (b) Klinman JP. Chem. Rev. 1996;96:2541–2561. doi: 10.1021/cr950047g. [DOI] [PubMed] [Google Scholar]; (c) Mirica LM, Ottenwaelder X, Stack TDT. Chem. Rev. 2004;104:1013–1046. doi: 10.1021/cr020632z. [DOI] [PubMed] [Google Scholar]; (d) Lewis EA, Tolman WB. Chem. Rev. 2004;104:1047–1076. doi: 10.1021/cr020633r. [DOI] [PubMed] [Google Scholar]
- (2).(a) Solomon EI, Ginsbach JW, Heppner DE, Kieber-Emmons MT, Kjaergaard CH, Smeets PJ, Tian L, Woertink JS. Faraday Discuss. 2011;148:11–39. doi: 10.1039/c005500j. [DOI] [PMC free article] [PubMed] [Google Scholar]; (b) Solomon EI, Sundaram UM, Machonkin TE. Chem. Rev. 1996;96:2563–2605. doi: 10.1021/cr950046o. [DOI] [PubMed] [Google Scholar]; (c) Solomon EI, Chen P, Metz M, Lee S-K, Palmer AE. Angew. Chem., Int. Ed. 2001;40:4570–4590. doi: 10.1002/1521-3773(20011217)40:24<4570::aid-anie4570>3.0.co;2-4. [DOI] [PubMed] [Google Scholar]; (d) Karlin KD, Tyeklár Z, editors. Bioinorganic Chemistry of Copper. Chapman & Hall; New York: 1993. [Google Scholar]; (e) Karlin KD, Zuberbühler AD. Formation, Structure and Reactivity of Copper Dioxygen Complexes. In: Reedijk J, Bouwman E, editors. Bioinorganic Catalysis. 2nd ed. Marcel Dekker, Inc.; New York: 1999. pp. 469–534. [Google Scholar]; (f) Quant Hatcher L, Karlin KD. J. Biol. Inorg. Chem. 2004;9:669–683. doi: 10.1007/s00775-004-0578-4. [DOI] [PubMed] [Google Scholar]; (g) Lee Y, Karlin KD. Highlights of Copper Protein Active-Site Structure/Reactivity and Synthetic Model Studies. In: Metzler-Nolte N, Kraatz H-B, editors. Concepts and Models in Bioinorganic Chemistry. Wiley-VCH; New York: 2006. pp. 363–395. [Google Scholar]
- (3).(a) Karlin KD. Science. 1993;261:701–708. doi: 10.1126/science.7688141. [DOI] [PubMed] [Google Scholar]; (b) Metzler-Nolte N, Kraatz H-B. Concepts and Models in Bioinorganic Chemistry. Wiley-VCH; New York: 2006. [Google Scholar]
- (4).(a) Klinman JP. J. Biol. Chem. 2006;281:3013–3016. doi: 10.1074/jbc.R500011200. [DOI] [PubMed] [Google Scholar]; (b) Prigge ST, Eipper B, Mains R, Amzel LM. Science. 2004;304:864–867. doi: 10.1126/science.1094583. [DOI] [PubMed] [Google Scholar]; (c) Chen P, Solomon EI. Proc. Natl. Acad. Sci. U.S.A. 2004;101:13105–13110. doi: 10.1073/pnas.0402114101. [DOI] [PMC free article] [PubMed] [Google Scholar]; (d) Balasubramanian R, Smith SM, Rawat S, Yatsunyk LA, Stemmler TL, Rosenzweig AC. Nature. 2010;465:115–119. doi: 10.1038/nature08992. [DOI] [PMC free article] [PubMed] [Google Scholar]; (e) Chan SI, Yu SS-F. Acc. Chem. Res. 2008;41:969–979. doi: 10.1021/ar700277n. [DOI] [PubMed] [Google Scholar]
- (5).Humphreys KJ, Mirica LM, Wang Y, Klinman JP. J. Am. Chem. Soc. 2009;131:4657–4663. doi: 10.1021/ja807963e. [DOI] [PMC free article] [PubMed] [Google Scholar]
- (6).Mukherjee A, Smirnov VV, Lanci MP, Brown DE, Shepard EM, Dooley DM, Roth JP. J. Am. Chem. Soc. 2008;130:9459–9473. doi: 10.1021/ja801378f. [DOI] [PMC free article] [PubMed] [Google Scholar]
- (7).McGuirl MA, Dooley DM. Copper Proteins with Type 2 Sites. In: King RB, editor. Encyclopedia of Inorganic Chemistry. 2nd ed. II. John Wiley & Sons Ltd.; Chichester: 2005. pp. 1201–1225. [Google Scholar]
- (8).(a) Blanford CF, Heath RS, Armstrong FA. Chem. Commun. 2007:1710. doi: 10.1039/b703114a. [DOI] [PubMed] [Google Scholar]; (b) Mano N, Soukharev V, Heller A. J. Phys. Chem. B. 2006;110:11180–11187. doi: 10.1021/jp055654e. [DOI] [PubMed] [Google Scholar]
- (9).(a) Ferguson-Miller S, Babcock GT. Chem. Rev. 1996;96:2889–2908. doi: 10.1021/cr950051s. [DOI] [PubMed] [Google Scholar]; (b) Pereira MM, Santana M, Teixeira M. Biochim. Biophys. Acta. 2001;1505:185–208. doi: 10.1016/s0005-2728(01)00169-4. [DOI] [PubMed] [Google Scholar]
- (10).(a) Tsukihara T, Aoyama H, Yamashita E, Tomizaki T, Yamaguchi H, Shinzawa-Itoh K, Nakashima R, Yaono R, Yoshikawa S. Science. 1995;269:1069–1074. doi: 10.1126/science.7652554. [DOI] [PubMed] [Google Scholar]; (b) Yoshikawa S, Shinzawa-Itoh K, Nakashima R, Yaono R, Yamashita E, Inoue N, Yao M, Fei MJ, Libeu CP, Mizushima T, Yamaguchi H, Tomizaki T, Tsukihara T. Science. 1998;280:1723–1729. doi: 10.1126/science.280.5370.1723. [DOI] [PubMed] [Google Scholar]
- (11).(a) Collman JP, Devaraj NK, Decreau RA, Yang Y, Yan Y-L, Ebina W, Eberspacher TA, Chidsey CED. Science. 2007;315:1565–1568. doi: 10.1126/science.1135844. [DOI] [PMC free article] [PubMed] [Google Scholar]; (b) Collman JP, Decréau RA, Lin H, Hosseini A, Yang Y, Dey A, Eberspacher TA. Proc. Natl. Acad. Sci. U.S.A. 2009;106:7320–7323. doi: 10.1073/pnas.0902285106. [DOI] [PMC free article] [PubMed] [Google Scholar]; (c) Collman JP, Ghosh S, Dey A, Decreáu RA, Yang Y. J. Am. Chem. Soc. 2009;131:5034–5035. doi: 10.1021/ja9001579. [DOI] [PMC free article] [PubMed] [Google Scholar]
- (12).Kadish KM, Frémond L, Shen J, Chen P, Ohkubo K, Fukuzumi S, El Ojaimi M, Gros CP, Barbe J-M, Guilard R. Inorg. Chem. 2009;48:2571–2582. doi: 10.1021/ic802092n. [DOI] [PubMed] [Google Scholar]
- (13).(a) Hatay I, Su B, Li F, Méndez MA, Khoury T, Gros CP, Barbe J-M, Ersoz M, Samec Z, Girault HH. J. Am. Chem. Soc. 2009;131:13453–13459. doi: 10.1021/ja904569p. [DOI] [PubMed] [Google Scholar]; (b) Partovi-Nia R, Su B, Li F, Gros CP, Barbe J-M, Samec Z, Girault HH. Chem.-Eur. J. 2009;15:2335–2340. doi: 10.1002/chem.200801807. [DOI] [PubMed] [Google Scholar]; (c) Hatay I, Su B, Me Méndez MA, Corminboeuf C, Khoury T, Gros CP, Bourdillon M, Meyer M, Barbe J-M, Ersoz M, Zális S, Samec Z, Girault HH. J. Am. Chem. Soc. 2010;132:13733–13741. doi: 10.1021/ja103460p. [DOI] [PubMed] [Google Scholar]
- (14).(a) Partovi-Nia R, Su B, Méndez MA, Habermeyer B, Gros CP, Barbe J-M, Samec Z, Girault HH. ChemPhysChem. 2010;11:2979–2984. doi: 10.1002/cphc.201000200. [DOI] [PubMed] [Google Scholar]; (b) Su B, Hatay I, Trojánek A, Samec Z, Khoury T, Gros CP, Barbe J-M, Daina A, Carrupt P-A, Girault HH. J. Am. Chem. Soc. 2010;132:2655–2662. doi: 10.1021/ja908488s. [DOI] [PubMed] [Google Scholar]
- (15).Zagal JH, Griveau S, Silva JF, Nyokong T, Bedioui F. Coord. Chem. Rev. 2010;254:2755–2791. [Google Scholar]
- (16).Cracknell JA, Vincent KA, Armstrong FA. Chem. Rev. 2008;108:2439–2461. doi: 10.1021/cr0680639. [DOI] [PubMed] [Google Scholar]
- (17).(a) Thorum MS, Yadav J, Gewirth AA. Angew. Chem., Int. Ed. 2009;48:165–167. doi: 10.1002/anie.200803554. [DOI] [PubMed] [Google Scholar]; (b) Thorseth MA, Letko CS, Rauchfuss TB, Gewirth AA. Inorg. Chem. 2011;50:6158–6162. doi: 10.1021/ic200386d. [DOI] [PubMed] [Google Scholar]; (c) McCrory CCL, Devadoss A, Ottenwaelder X, Lowe RD, Stack TDP, Chidsey CED. J. Am. Chem. Soc. 2011;133:3696–3699. doi: 10.1021/ja106338h. [DOI] [PMC free article] [PubMed] [Google Scholar]; (d) Thorseth MA, Tornow CE, Tse ECM, Gewirth AA. Coord. Chem. Rev. 2013;257:130–139. [Google Scholar]
- (18).(a) Stambouli AB, Traversa E. Renew. Sust. Energy Rev. 2002;6:295–304. [Google Scholar]; (b) Marković NM, Schmidt TJ, Stamenković V, Ross PN. Fuel Cells. 2001;1:105–116. [Google Scholar]; (c) Steele BCH, Heinzel A. Nature. 2001;414:345–352. doi: 10.1038/35104620. [DOI] [PubMed] [Google Scholar]
- (19).Borup R, Meyers J, Pivovar B, Kim YS, Mukundan R, Garland N, Myers D, Wilson M, Garzon F, Wood D, Zelenay P, More K, Stroh K, Zawodzinski T, Boncella J, McGrath JE, Inaba M, Miyatake K, Hori M, Ota K, Ogumi Z, Miyata S, Nishikata A, Siroma Z, Uchimoto Y, Yasuda K, Kimijima K.-i., Iwashita N. Chem. Rev. 2007;107:3904–3951. doi: 10.1021/cr050182l. [DOI] [PubMed] [Google Scholar]
- (20).(a) Lee K, Zhang L, Zhang J. PEM Fuel Cell Electrocatalysts and Catalyst Layers. Springer; London: 2008. p. 715. [Google Scholar]; (b) Anson FC, Shi C, Steiger B. Acc. Chem. Res. 1997;30:437–444. [Google Scholar]; (c) Wang B. J. Power Sources. 2005:152. [Google Scholar]; (d) Peljo P, Rauhala T, Murtomäki L, Kallio T, Kontturi K. Int. J. Hydrogen Energy. 2011;36:10033–10043. [Google Scholar]
- (21).(a) Collman JP, Devaraj NK, Decréau RA;, Yang Y, Yan Y-L, Ebina W, Eberspacher TA;, Chidsey CED. Science. 2007;315:1565–1568. doi: 10.1126/science.1135844. [DOI] [PMC free article] [PubMed] [Google Scholar]; (b) Collman JP, Decréau RA, Lin H, Hosseini A, Yang Y, Dey A, Eberspacher TA. Proc. Natl. Acad. Sci. U.S.A. 2009;106:7320–7323. doi: 10.1073/pnas.0902285106. [DOI] [PMC free article] [PubMed] [Google Scholar]; (c) Collman JP, Ghosh S, Dey A, Decréau RA, Yang Y. J. Am. Chem. Soc. 2009;131:5034–5035. doi: 10.1021/ja9001579. [DOI] [PMC free article] [PubMed] [Google Scholar]
- (22).(a) Kadish KM, Shen J, Frémond L, Chen P, Ojaimi ME, Chkounda M, Gros CP, Barbe J-M, Ohkubo K, Fukuzumi S, Guilard R. Inorg. Chem. 2008;47:6726–6737. doi: 10.1021/ic800458s. [DOI] [PubMed] [Google Scholar]; (b) Chen W, Akhigbe J, Brückner C, Li CM, Lei Y. J. Phys. Chem. C. 2010;114:8633–8645. [Google Scholar]
- (23).(a) Rosenthal J, Nocera DG. Acc. Chem. Res. 2007;40:543–553. doi: 10.1021/ar7000638. [DOI] [PubMed] [Google Scholar]; (b) Chang CJ, Loh Z-H, Shi C, Anson FC, Nocera DG. J. Am. Chem. Soc. 2004;126:10013–10020. doi: 10.1021/ja049115j. [DOI] [PubMed] [Google Scholar]; (c) Dogutan DK, Stoian SA;, McGuire R, Schwalbe M, Teets TS, Nocera DG. J. Am. Chem. Soc. 2011;133:131–140. doi: 10.1021/ja108904s. [DOI] [PubMed] [Google Scholar]; (d) Teets TS, Cook TR, McCarthy BD, Nocera DG. J. Am.Chem. Soc. 2011;133:8114–8117. doi: 10.1021/ja201972v. [DOI] [PubMed] [Google Scholar]
- (24).(a) Fukuzumi S, Kotani H, Lucas HR, Doi K, Suenobu T, Peterson RL, Karlin KD. J. Am. Chem. Soc. 2010;132:6874–6875. doi: 10.1021/ja100538x. [DOI] [PMC free article] [PubMed] [Google Scholar]; (b) Tahsini L, Kotani H, Lee Y-M, Cho J, Nam W, Karlin KD, Fukuzumi S. Chem.-Eur. J. 2012;18:1084–1093. doi: 10.1002/chem.201103215. [DOI] [PMC free article] [PubMed] [Google Scholar]
- (25).Halime Z, Kotani H, Li Y, Fukuzumi S, Karlin KD. Proc. Natl. Acad. Sci. U.S.A. 2011;108:13990–13994. doi: 10.1073/pnas.1104698108. [DOI] [PMC free article] [PubMed] [Google Scholar]
- (26).Fukuzumi S, Tahsini L, Lee Y-M, Ohkubo K, Nam W, Karlin KD. J. Am. Chem. Soc. 2012;134:7025–7035. doi: 10.1021/ja211656g. [DOI] [PMC free article] [PubMed] [Google Scholar]
- (27).(a) Yamada Y, Fukunishi Y, Yamazaki S.-i., Fukuzumi S. Chem. Commun. 2010;46:7334–7336. doi: 10.1039/c0cc01797c. [DOI] [PubMed] [Google Scholar]; (b) Jing X, Cao DX, Liu Y, Wang GL, Yin JL, Wen Q, Gao YYJ. Electroanal. Chem. 2011;658:46–51. [Google Scholar]
- (28).(a) Lei T, Tian YM, Wang GL, Yin JL, Gao YY, Wen Q, Cao DX. Fuel Cells. 2011;11:431–435. [Google Scholar]; (b) Hasvold O, Storkersen NJ, Forseth S, Lian TJ. Power Sources. 2006;162:935–942. [Google Scholar]; (c) Patrissi CJ, Bessette RR, Kim YK, Schumacher CR. J. Electrochem. Soc. 2008;155:B558–B562. [Google Scholar]
- (29).(a) Disselkamp RS. Energy Fuels. 2008;22:2771–2774. [Google Scholar]; (b) Disselkamp RS. Int. J. Hydrogen Energy. 2010;35:1049–1053. [Google Scholar]
- (30).Galbács ZM, Csányi LJ. J. Chem. Soc., Dalton Trans. 1983:2353–2357. [Google Scholar]
- (31).Latimer WM. The Oxidation States of the Elements and their Potentials in Aqueous Solutions. Prentice-Hall; New York: 1952. p. 39. [Google Scholar]
- (32).(a) Abrantes S, Amaral E, Costa AP, Shatalov AA, Duarte AP. Ind. Crop. Prod. 2007;25:288–293. [Google Scholar]; (b) Zeronian SH, Inglesby MK. Cellulose. 1995;2:265–272. [Google Scholar]
- (33).Li L, Lee S, Lee HL, Youn HJ. BioResources. 2011;6:721–736. [Google Scholar]
- (34).(a) Schatz M, Becker M, Thaler F, Hampel F, Schindler S, Jacobson RR, Tyeklár Z, Murthy NN, Ghosh P, Chen Q, Zubieta J, Karlin KD. Inorg. Chem. 2001;40:2312–2322. doi: 10.1021/ic000924n. [DOI] [PubMed] [Google Scholar]; (b) Wei N, Murthy NN, Karlin KD. Inorg. Chem. 1994;33:6093–6100. [Google Scholar]
- (35).Armarego WLF, Chai CLL. Purification of Laboratory Chemicals. 5th ed. Butterworth-Heinemann; Amsterdam: 2003. [Google Scholar]
- (36).Baek HK, Karlin KD, Holwerda RA. Inorg. Chem. 1986;25:2347–2349. [Google Scholar]
- (37).Fukuzumi S, Ishikawa M, Tanaka T. J. Chem. Soc., Perkin Trans. 1989;2:1037–1045. [Google Scholar]
- (38).(a) Mair RD, Graupner A. J. Anal. Chem. 1964;36:194–203. [Google Scholar]; (b) Fukuzumi S, Kuroda S, Tanaka T. J. Am. Chem. Soc. 1985;107:3020–3027. [Google Scholar]
- (39).(a) Karlin KD, Hayes JC, Juen S, Hutchinson JP, Zubieta J. Inorg. Chem. 1982;21:4106–4108. [Google Scholar]; (b) Karlin KD, Sherman SE. Inorg. Chim. Acta. 1982;65:L39–L40. [Google Scholar]; (c) Ambundo EA, Deydier M-V, Grall AJ, Aguera-Vega N, Dressel LT, Cooper TH, Heeg MJ, Ochrymowycz LA, Rorabacher DB. Inorg. Chem. 1999;38:4233–4242. [Google Scholar]; (d) Rorabacher DB. Chem. Rev. 2004;104:651–697. doi: 10.1021/cr020630e. [DOI] [PubMed] [Google Scholar]
- (40).(a) Lee Y-M, Kotani H, Suenobu T, Nam W, Fukuzumi S. J. Am. Chem. Soc. 2008;130:434–435. doi: 10.1021/ja077994e. [DOI] [PubMed] [Google Scholar]; (b) Fukuzumi S, Kotani H, Prokop KA, Goldberg DP. J. Am. Chem. Soc. 2011;133:1859–1869. doi: 10.1021/ja108395g. [DOI] [PubMed] [Google Scholar]; (c) Fukuzumi S, Kotani H, Suenobu T, Hong S, Lee Y-M, Nam W. Chem.-Eur. J. 2010;16:354–361. doi: 10.1002/chem.200901163. [DOI] [PubMed] [Google Scholar]; (d) Comba P, Fukuzumi S, Kotani H, Wunderlich S. Angew. Chem., Int. Ed. 2010;49:2622–2625. doi: 10.1002/anie.200904427. [DOI] [PubMed] [Google Scholar]
- (41).The Eox values of ferrocene derivatives in acetone are virtually the same as those in MeCN; see: Noviandri I, Brown KN, Fleming DS, Gulyas PT, Lay PA, Masters AF, Phillips L. J. Phys. Chem. B. 1999;103:6713–6722.
- (42).The activation entropy for electron transfer becomes negative when the electron transfer occurs via an intermediate, see: Fukuzumi S, Endo Y, Imahori H. J. Am. Chem. Soc. 2002;124:10974–10975. doi: 10.1021/ja026089l.
- (43).Fujii T, Naito A, Yamaguchi S, Wada A, Funahashi Y, Jitsukawa K, Nagatomo S, Kitagawa T, Masuda H. Chem. Commun. 2003:2700–2701. doi: 10.1039/b308073k. [DOI] [PubMed] [Google Scholar]
- (44).Wada A, Harata M, Hasegawa K, Jitsukawa K, Masuda H, Mukai M, Kitagawa T, Einaga H. Angew. Chem. Int. Ed. 1998;37:798–800. doi: 10.1002/(SICI)1521-3773(19980403)37:6<798::AID-ANIE798>3.0.CO;2-3. [DOI] [PubMed] [Google Scholar]
- (45).Kodera M, Kita T, Miura I, Nakayama N, Kawata T, Kano K, Hirota S. J. Am. Chem. Soc. 2001;123:7715–7716. doi: 10.1021/ja010689n. [DOI] [PubMed] [Google Scholar]
- (46).(a) Karlin KD, Cruse RW, Gultneh Y. J. Chem. Soc., Chem. Commun. 1987:599–600. [Google Scholar]; (b) Karlin KD, Ghosh P, Cruse RW, Farooq A, Gultneh Y, Jacobson RR, Blackburn NJ, Strange RW, Zubieta J. J. Am. Chem. Soc. 1988;110:6769–6780. [Google Scholar]; (c) Root DE, Mahroof-Tahir M, Karlin KD, Solomon EI. Inorg. Chem. 1998;37:4838–4848. doi: 10.1021/ic980606c. [DOI] [PubMed] [Google Scholar]
- (47).Kunishita A, Kubo M, Ishimaru H, Ogura T, Sugimoto H, Itoh S. Inorg. Chem. 2008;47:12032–12039. doi: 10.1021/ic801568g. [DOI] [PubMed] [Google Scholar]
- (48).In the case of [Cu(tepa)]2+, gxx = gyy with the same broad linewidth (σxx = σyy = 100 G). In such a case no superhyperfine due to nitrogens was detected. In the case of [CuII(tepa)OOH]+, however, the linewidth of σxx (10 G) is much smaller than σyy (70 G) although gxx = gyy. This is the reason why the superhyperfine due to nitrogens was detected for [CuII(tepa)OOH]+ in Figures 8b and 8c.
- (49).Alilou EH, Hallaoui AE, Ghadraoui EHE, Giorgi M, Pierrot M, Réglier M. Acta Cryst. Section C. 1997;C53:559–562. [Google Scholar]
- (50).Karlin KD, Hayes JC, Hutchinson JP, Hyde JR, Zubieta J. Inorg. Chim. Acta. 1982;64:L219–L220. [Google Scholar]
- (51).Karlin KD, Wei N, Jung B, Kaderli S, Niklaus P, Zuberbühler AD. J. Am. Chem. Soc. 1993;115:9506–9514. [Google Scholar]
- (52).Karlin KD, Kaderli S, Zuberbühler AD. Acc. Chem. Res. 1997;30:139–147. [Google Scholar]
- (53).(a) Fukuzumi S, Endo Y, Imahori H. J. Am. Chem. Soc. 2002;124:10974–10975. doi: 10.1021/ja026089l. [DOI] [PubMed] [Google Scholar]; (b) Yoder JC, Roth JP, Gussenhoven EM, Larsen AS, Mayer JM. J. Am. Chem. Soc. 2003;125:2629–2640. doi: 10.1021/ja0273905. [DOI] [PubMed] [Google Scholar]
- (54).(a) Zaman KM, Yamamoto S, Nishimura N, Maruta J, Fukuzumi S. J. Am. Chem. Soc. 1994;116:12099–12100. [Google Scholar]; (b) Fukuzumi S, Ohkubo K, Tokuda Y, Suenobu T. J. Am. Chem. Soc. 2000;122:4286–4294. [Google Scholar]; (c) Zhu X-Q, Zhang J-Y, Cheng J-P. J. Org. Chem. 2006;71:7007–7015. doi: 10.1021/jo061145c. [DOI] [PubMed] [Google Scholar]
- (55).Ohkubo K, Fukuzumi S. J. Phys. Chem. A. 2005;109:1105–1113. doi: 10.1021/jp0453008. [DOI] [PubMed] [Google Scholar]
- (56).Zhang CX, Kaderli S, Costas M, Kim E.-i., Neuhold Y-M, Karlin KD, Zuberbuhler AD. Inorg. Chem. 2003;42:1807–1824. doi: 10.1021/ic0205684. [DOI] [PubMed] [Google Scholar]
- (57).Because the overall catalytic reaction has no temperature dependence, the ΔH≠ value may be smaller than the −ΔH value of formation of the hydroperoxo complex in Scheme 2.
- (58).Fukuzumi S, Yamada Y, Karlin KD. Electrochim. Acta. 2012;82:493–511. doi: 10.1016/j.electacta.2012.03.132. [DOI] [PMC free article] [PubMed] [Google Scholar]
- (59).(a) Yamada Y, Yoshida S, Honda T, Fukuzumi S. Energy Environ. Sci. 2011;4:2822–2825. [Google Scholar]; (b) Shaegh SAM, Nguyen N-T, Ehteshami SMM, Chan SH. Energy Environ. Sci. 2012;5:8225–8228. [Google Scholar]
Associated Data
This section collects any data citations, data availability statements, or supplementary materials included in this article.


