Abstract
Automatic placement of anatomically corresponding volumes of interest and comparison of parameters against a standard of reference are essential components in studies of trabecular bone. Only recently, in vivo MR images of the proximal femur, an important fracture site, could be acquired with high-spatial resolution. The purpose of this MRI trabecular bone study was two-fold: (1) to generate an atlas of the proximal femur to automatically place anatomically corresponding volumes of interest in a population study and (2) to demonstrate how mean models of geodesic topological analysis parameters can be generated to be used as potential standard of reference. Ten females were used to generate the atlas and geodesic topological analysis models, and 10 females were used to demonstrate the atlas-based trabecular bone analysis. All alignments were based on three-dimensional (3D) multiresolution affine transformations followed by 3D multiresolution free-form deformations. Mean distances less than 1 mm between aligned femora, and sharp edges in the atlas and in fused gray-level images of registered femora indicated that the anatomical variability was well accommodated and explained by the free-form deformations.
Keywords: trabecular bone, atlas, geodesic topological analysis (GTA), proximal femur
Osteoporosis has been defined by the National Institutes of Health as a skeletal disorder characterized by compromised bone strength predisposing to an increased risk of fracture (1). The proximal femur is the anatomical site where most of the fractures leading to morbidity and mortality occur; however, its deep-seated location in the human body makes it most difficult to study in vivo with MRI. Areal bone mineral density (BMD) by dual X-ray absorptiometry is the most widely used clinical surrogate for bone strength (2). According to the World Health Organization criteria, the diagnosis of osteoporosis in postmenopausal Caucasian women is based on comparisons of BMD values of the proximal femur or spine with those of a healthy, young population (T-score). BMD can predict femoral bone strength and fracture risk to some extent; however, studies have shown that BMD values of patients with and without femoral fractures overlap (3,4). This is because it has been found that BMD only explains about 70–75% of the variance in strength, while the remaining variance has been attributed to the cumulative and synergistic effect of other factors such as bone architecture, tissue composition, and microdamage (5). Currently, due to recent advances in hardware, pulse sequence development and coil design, MRI is the only imaging modality with the capability of providing in vivo high-spatial resolution images to quantify trabecular bone microarchitecture of the proximal femur, and consequently the only imaging modality capable of contributing to the in vivo trabecular bone assessment of the proximal femur. It is for the reasons mentioned above that the analysis of trabecular bone of the proximal femur based on high-spatial resolution images is in its early stages and has been reduced to parameters analogous to those of histomorphometry (6,7).
In this study, we have sought to develop a technique to bring the analysis of trabecular bone microarchitecture of the proximal femur one step forward. To this end, we acquired in vivo high-spatial resolution images of the proximal femur and in addition water-only images using a Dixon type approach (8,9) for optimized image registration. The work is based on the idea of comparing patient measures with those of a healthy population. This idea has been seen in many recent studies and has gone beyond global values to localized comparisons at corresponding anatomic locations due to recent advances in medical image analysis algorithms and computational power. The measures used in this study are based on geodesic topological analysis (GTA), which is a recent trabecular bone analysis technique that quantifies the trabecular bone network in terms of its junctions and that has shown its potential in a fracture discrimination study (10).
The purpose of this study was then two-fold: (1) to generate an atlas of the proximal femur to automatically place volumes of interest (VOI) in a population study to analyze trabecular bone microarchitecture from high-spatial resolution MR images in anatomically corresponding regions; (2) to demonstrate how mean models of GTA parameters can be generated for its potential use in atlas-based trabecular bone assessment as potential standards of reference.
MATERIALS AND METHODS
Subjects
Informed consent was obtained from all subjects as approved by the Institutional Review Board at the University of California, San Francisco. Twenty female subjects were included in this study. All subjects were healthy based on medical history, physical examination, clinical laboratories, and had no contraindications for the use of MRI at the time of enrollment. No previous fracture of the proximal femur was additional inclusion criteria. Ten subjects with a mean age of 47 [standard deviation (SD) = 15.43; range = 26–65] years and with no previous fracture of any kind were randomly chosen to build the femoral atlas and GTA models. The remaining 10 subjects were used to demonstrate the atlas-based trabecular bone analysis and had a mean age of 59.80 (SD = 10.58) years.
MRI
Coronal high-spatial resolution MR images of the proximal femur of all subjects were acquired on a 3 Tesla MR750 scanner (GE Medical Systems, Milwaukee, WI) using a three-dimensional (3D) fully balanced steady-state free-precession (bSSFP) pulse sequence with two phase-cycled acquisitions. Acquisition parameters included a repetition time of 8.6 ms, flip angle of 60°, echo time of 3.09 ms, field of view of 120 × 120 × 50 mm3, and matrix size of 512 × 384 × 100 (frequency × phase × slices) for a final spatial resolution of 0.234 mm along the frequency encoding direction, slice thickness of 500 μm, and a voxel width of 0.234 mm along the phase enconding direction after reconstruction, yielding an acquisition time of 13 min and 19 s.
A 3D fast gradient echo pulse sequence with three echo shifts was used to produce coronal fat-suppressed images with half the spatial resolution of the bSSFP sequence (0.468 × 0.468 × 1 mm3). The chemical shift-based water fat separation calculation was performed online using the iterative decomposition of water and fat with echo asymmetry and least-squares estimation (IDEAL) algorithm (11,12). The IDEAL reconstruction produced water-only (W), fat-only, in-phase (water and fat), and out-of-phase (water minus fat) images. The IDEAL-fast gradient echo acquisition parameters included a repetition time of 6.6 ms, flip angle of 12°, echo time for the three echoes of 2.2, 3.0, and 3.8 ms, three averages, field of view of 120 × 120 × 52 mm3, and a matrix size of 128 × 128 × 52 (frequency × phase × slices), yielding an acquisition time of 6 min and 38 s.
All images were acquired with an eight channel phased-array coil (GE Medical Systems) with four arrays anteriorly and four arrays posteriorly encased in a flexible housing, and subjects were restrained to prevent patient motion between scans.
Image Postprocessing
All images, bSSFP and W-IDEAL, were coil corrected using nonparametric nonuniform intensity normalization (N3) (13) as previously reported in Ref. 14.
Atlas of the Proximal Femur
Intersubject anatomical variability cannot be sufficiently explained by an affine transformation as it only accounts for global differences due to position, orientation, and size of anatomy. To capture the anatomical variability due to local differences nonrigid registration is required. In this study, we have chosen free-form deformations (FFDs) as the nonrigid registration algorithm due to its success in previous publications and relatively simple implementation (15–17).
The idea behind FFDs is to deform an object based on the manipulation of an underlying mesh of control points φ in the domain of the image volume Ω = {(x,y,z), 0 ≤ x < X, 0 ≤ y < Y, 0 ≤ z < Z}. The free-form deformation at any position x = (x,y,z) can be written as the 3D tensor product of 1D cubic B-splines:
| [1] |
In Eq. 1, φi,j,k represents the control points in φ, which are uniformly spaced in x, y, and z by δx, δy, and δz, respectively. Indexes i, j, and k represent the indexes of the control point cell containing x = (x,y,z), and they are computed as i=[x/δx] − 1, j = [y/δy] − 1, and k = [z/δz] − 1, while u, v, and w are the relative positions of x, y, and z inside that cell, respectively, and they are computed as u = x/δx − [x/δx], v = y/δy − [y/δy], and w = z/δz − [z/δz]. The lth basis function of cubic B-splines is represented by Bl (18):
| [2] |
As can be inferred from Eq. 1, control points are independently adjusted based on the surrounding 4 × 4 × 4 neighborhood of control points thus providing a nonrigid deformation of the space between them and consequently a local alignment.
The atlas of the proximal femur was constructed based on the alignments of W-IDEAL images. These images were selected over other reconstructed images such as out-of-phase IDEAL images with sharper edges for three reasons. First, they provide high contrast between bone structures (dark) and surrounding soft tissues (bright) due to the complete fat signal suppression in the yellow marrow bone region and the insensitivity of Dixon approach to B1 and B0 inhomogeneities. Second, they were part of the in-house established protocol as they are used for other trabecular bone analysis studies. Third, because similar contrast can be obtained with other pulse sequences that can null the fat signal and are widely available such as spoiled gradient recalled acquisition at steady state with fat suppression or water excitation, thus increasing the potential adoption of the presented technique in other studies of the musculoskeletal field such as knee and hip cartilage analysis where images with similar contrast are used.
One of the 10 subjects used to build the atlas was randomly selected as the reference subject. The femoral contour of this subject was manually outlined from the W-IDEAL image and dilated to create an optimization mask for registration purposes. The main purpose of this mask was to focus the optimization of the registrations to the femoral region and thus reduce the influence of soft tissues. The remaining nine subjects were then registered to the reference subject with multiresolution (three scales: a fourth of the original size, a half of the original size, and the original size) affine transformations (translation, rotation, and scaling) followed by multiresolution (three scales) FFDs (10-pixel control-point spacing) based on cubic B-splines:
| [3] |
where Tglobal is the 12-parameter affine transformation and Tlocal is the deformation based on B-splines, which was regularized based on the smoothness (ES) of the deformations (17):
| [4] |
The use of an optimization mask also had the advantage of increasing the speed of FFDs as it substantially reduced the number of active control points. The optimization mask was slightly eroded at the highest registration level (original spatial resolution) to further improve the registration speed.
Affine registrations and FFDs were optimized based on the mean of squared differences as all images had the same type of contrast:
| [5] |
where IA and IB represent the images to be compared, and x, y, and z, the voxel coordinates. The metric was only computed in regions where the reference and floating volume images overlapped. The domain of this overlapping volume is defined by X′, Y′, and Z′, and N is the standardization factor representing the number of overlapping voxels.
An average W-IDEAL image of the proximal femur was then obtained based on the nine computed alignments. However, this average image resided in the coordinate system of the reference subject. To create an atlas that was less dependent on the selection of the reference subject, the average W-IDEAL image was put on its natural coordinate system. According to Rueckert et al. (16) the natural coordinate system is the coordinate system that requires the least residual deformation to explain the anatomical variability across all individuals (19). The position xN in the natural coordinate system is computed as:
| [6] |
where xR is the position in the reference subject and d̂R is the average deformation at xR.
As all W-IDEAL transformations were calculated in units of millimeters and the high-spatial resolution bSSFP scans were acquired in the same scanning session and with the same volume center of the W-IDEAL images, affine transformations and FFDs were applied to the high-spatial resolution bSSFP scans to also create a high-spatial resolution bSSFP atlas in its natural coordinate system.
All codes were developed in-house and written in MATLAB (The MathWorks, Natick, MA) with multithreading capabilities, backward mapping, and linear interpolation. Computations were done on a Linux 64 machine with an AMD quad-core processor (Advanced Micro Devices, Harrison, NY) 3 GHz and with 8 GB of RAM. The affine transformations took ~137 s and the nonrigid phases ~2 h and 45 min.
Mean GTA Models
Femoral contours including only trabecular bone and marrow were manually delineated in the high-spatial resolution images of the 10 subjects used to build the atlas. The defined femoral regions were segmented using Bone-Enhancement Fuzzy C-Means clustering to compute a fuzzy bone volume fraction map as previously reported by Folkesson et al. (20). The technique uses partial membership segmentation and in addition to voxel intensities incorporates local second-order features for bone enhancement at multiple scales. This approach is meant to allow for a soft segmentation that accounts for partial volume effects while suppressing the influence of noise.
After thresholding the fuzzy bone volume fraction map at 0.5 to create a binary image of trabecular bone microarchitecture, trabecular bone junctions were identified to compute GTA parameters. GTA assumes that the relationship of a particular bone element is stronger to its closest connected junction than to any other junction in the network. GTA then assigns each bone voxel to its closest connected junction using the concept of geodesic distance, which is the shortest path between two points. GTA breaks down the trabecular bone microarchitecture into groups of voxels belonging to different junctions and quantifies individual junctions, junctions with their group of assigned voxels, and the interrelationship between junctions. GTA yields two apparent trabecular bone parameters that quantify the volume, two the spacing, and three the orientation. Table 1 lists the GTA parameters included in this study, where two of the orientation parameters were excluded due to their nonlocal nature. The apparent trabecular bone volume of junction (VJ) was computed taking into account partial bone memberships. GTA parametric maps were created by removing nonjunction pixels and by assigning to each trabecular bone junction the corresponding GTA value.
Table 1.
Geodesic Topological Analysis (GTA) Parameters
| GTA parameter | Abbreviation | Units | Description |
|---|---|---|---|
| Volume of junction | VJ | mm3 | Amount of bone that a single junction is supporting |
| Convex hull of junction | CHJ | mm3 | Encompassed space of a junction and its set of bone voxels |
| Junction spacing | JSp | mm | Minimum of the geodesic distances between a junction and its immediate connected junctions |
| Distance to junction | DJ | mm | Maximum geodesic distance between a junction and its set of assigned voxels |
| Junction eccentricity | JE | Unitless | Eccentricity of groups of bone voxels belonging to the same junction |
The affine transformations and FFDs computed in the previous section, together with the 10 GTA parametric maps were used to create mean GTA models. Mean GTA parametric maps were created with backward mapping and in their natural coordinate system, but nearest-neighbor interpolation was used as studies have shown its advantages over linear interpolation for trabecular bone analysis (7).
It is important to note that the femoral segmentations mentioned in this section were only used to calculate GTA parameters and were not used for registration purposes at all.
Automatic Placement of VOI and Atlas-Based GTA Trabecular Bone Assessment
Three different VOI were prescribed in the high-spatial resolution atlas and transferred to the 10 subjects who were not used to build the atlas. The first volume of interest was intended for the analysis of the femoral head, while the second and third VOI were intended for the analysis of the neck and the trochanteric region, respectively.
As previous studies have shown that a sphere is a good approximation to the shape of the femoral head (21), Bezier splines were semiautomatically placed around the femoral head of the high-spatial resolution atlas, and a sphere was fitted to the contours using a gaussian Newton least-squares approach. The sphere was scaled down to 75% of its original size to account for differences in cortical bone thickness and shape irregularities such as the fovea capitis (22). The sphere was also cropped on the anterior and posterior ends to end up with a central volume of interest of 30 slices (15 mm). Neck and trochanteric VOI were manually placed in the high-spatial resolution atlas on a slice-by-slice basis using rectangles and irregular contours, respectively. The neck volume of interest consisted of a total of 22 slices (11 mm), while the trochanteric region consisted of a total of 30 slices (15 mm).
The necessary transformations to transfer the VOI from the high-spatial resolution atlas to the high-spatial resolution images of individual subjects were computed based on the W-IDEAL atlas and the corresponding W-IDEAL images of the individual subjects. Individual subjects were used as reference, and the W-IDEAL atlas was aligned to them enabling backward mapping. A rectangular parallelepiped based on a manually-defined box in the middle slice of each individual subject scan was used to restrict the multiresolution affine transformations (three scales) and FFDs (three scales; 10-pixel control-point spacing). Bone segmentations were not necessary. Affine transformations were optimized using mean of squared difference, while FFDs were optimized using normalized cross-correlation (NCC):
Normalized cross-correlation
| (7) |
Prescribed VOI were then transferred to the individual high-spatial resolution images by applying the corresponding computed transformations.
Mean and SD values of GTA parameters were obtained from the GTA models.
Error Assessment
Affine and nonrigid registrations for both atlas generation and mapping of VOI were qualitatively validated with fused gray-level images using color-encoded and chess-board images.
Error assessment of affine and nonrigid registrations for both atlas generation and mapping of VOI was calculated based on minimum Euclidean distances between registered shapes. Euclidean distances between each point in one shape and all points in the other shape were calculated. Then each point in the first shape was matched to a point in the second shape by selecting the closest point in the second shape. For this purpose, the proximal femur was manually outlined from all W-IDEAL images and from the W-IDEAL atlas. The shape of all 21 femoral segmentations was interpolated to obtain 3D representations with isotropic voxel size (0.469 mm). The corresponding affine transformations and FFDs were applied to the femoral shapes of the nine subjects used to build the atlas and to the shape of the femoral W-IDEAL atlas. For each point in the proximal femur of the reference subject, the Euclidean distance of the closest point on the other proximal femora was recorded. The same procedure was done for each point in the femur of the W-IDEAL atlas with the 10 test subjects. Mean and SD of the minimum Euclidean distances were calculated before registration, after affine registration, and after affine registration and FFDs. Repeated-measures analysis of variance followed by Bonferroni corrections was used to compare mean values. Results were considered significant if P values were less than 0.05.
RESULTS
Atlas of the Proximal Femur
Figure 1 shows an intersubject registration example that was used to build the atlas. The chess-board images of this figure have been constructed with alternating blocks of the reference and floating images, thus regions showing smooth transitions of femoral contours from block to block indicate good local alignment. In the color-coded images of Fig. 1, the reference subject has been encoded in green, while the floating subject has been encoded in magenta, thus regions displaying any of these two colors indicate regions that do not match. Green and magenta regions, as well as contour discontinuities in chess-board images in Fig. 1 can be appreciated in soft tissues, which are not of interest in this particular application. A similar set of images as in Fig. 1 are shown in Fig. 2 to show an example of an intersubject registration used to build the high-spatial resolution bSSFP atlas. All alignments were successfully completed.
FIG. 1.
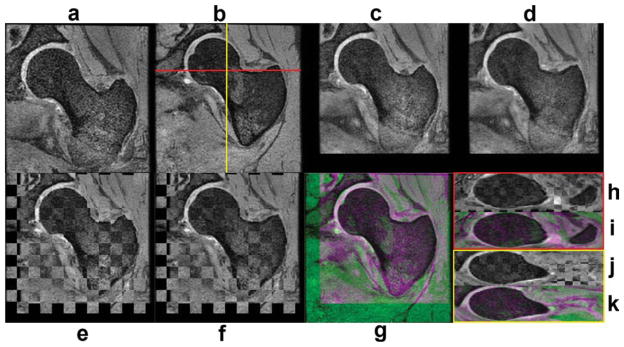
Intersubject registration example used to create the W-IDEAL atlas. a: Coronal floating subject. b: Coronal reference subject. c: Floating subject after affine registration. d: Floating subject after affine and nonrigid registration. e: Chess-board image after affine registration. f: Chess-board image after affine and nonrigid registration. g: Color-encoded image after affine and nonrigid registration. h: Axial chess-board image after affine and nonrigid registration. i: Axial color-encoded image after affine and nonrigid registration. j: Sagittal chess-board image after affine and nonrigid registration. k: Sagittal color-encoded image after affine and nonrigid registration. [Color figure can be viewed in the online issue, which is available at wileyonlinelibrary.com.]
FIG. 2.
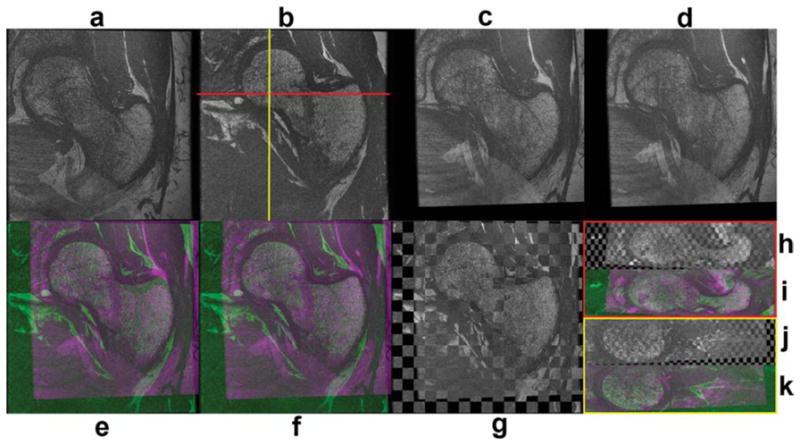
Intersubject registration example used to create the high-spatial resolution bSSFP atlas. a: Coronal floating subject. b: Coronal reference subject. c: Floating subject after affine registration. d: Floating subject after affine and nonrigid registration. e: Color-coded image after affine registration. f: Color-coded image after affine and nonrigid registration. g: Chess-board image after affine and nonrigid registration. h: Axial chess-board image after affine and nonrigid registration. i: Axial color-coded image after affine and nonrigid registration. j: Sagittal chess-board image after affine and nonrigid registration. k: Sagittal color-coded image after affine and nonrigid registration. [Color figure can be viewed in the online issue, which is available at wileyonlinelibrary.com.]
Figures 3 and 4 show the gray-level femoral W-IDEAL and high-spatial resolution bSSFP atlases, respectively. Atlases are shown in three orthogonal planes and in their natural coordinate system showing the capability of the presented technique. The mean femoral distance between the reference shape and the nine shapes used to build the atlas was 6.569 mm (SD = 4.115 mm) before any registration, and it was reduced to 1.084 mm (SD = 1.053 mm) after affine registration and to 0.723 mm (SD = 0.791 mm) after affine registration and FFDs. Both improvements were significant (P < 0.001). A visual representation of the spatial distribution of mean distances in the reference femoral shape is shown in Fig. 5.
FIG. 3.
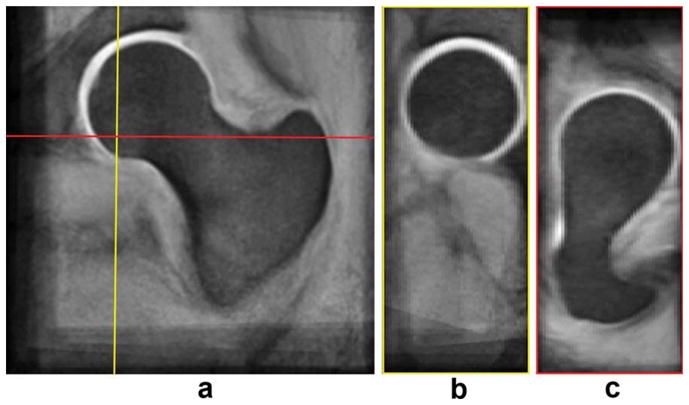
W-IDEAL atlas. a: Coronal view. b: Sagittal view. c: Axial view. [Color figure can be viewed in the online issue, which is available at wileyonlinelibrary.com.]
FIG. 4.
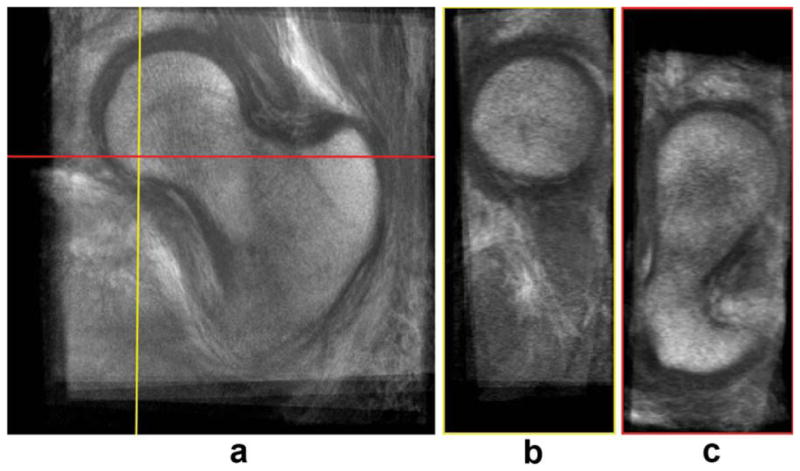
High-spatial resolution bSSFP atlas. a: Coronal view. b: Sagittal view. c: Axial view. [Color figure can be viewed in the online issue, which is available at wileyonlinelibrary.com.]
FIG. 5.
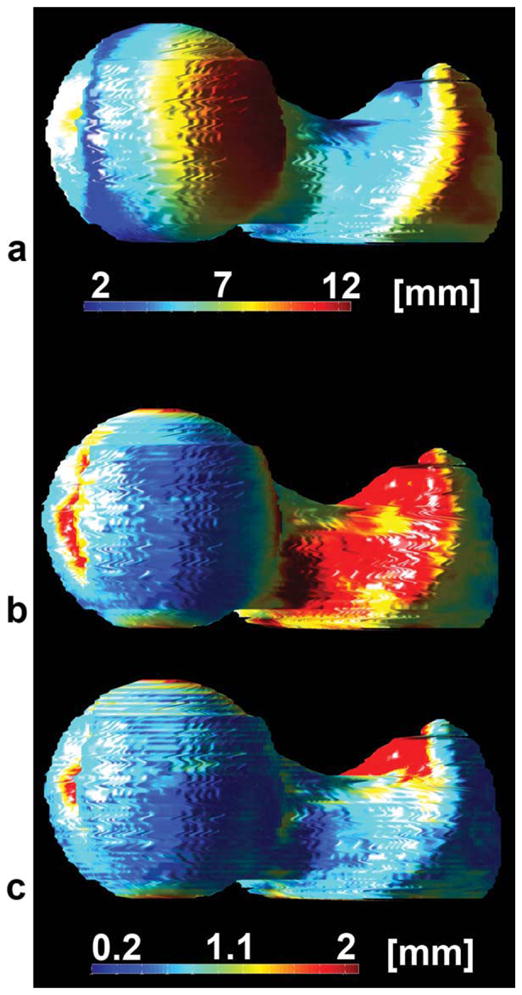
Spatial distribution of mean femoral distances for each point in the reference subject used to build the W-IDEAL atlas. a: Before registration. b: After affine registration. c: After affine and nonrigid registration.
Mean GTA Models
Mean GTA parametric maps were successfully obtained for each GTA parameter based on visual assessment and expected GTA values. The mean GTA values for each of the five GTA parameters at the three VOI investigated in this study are listed in Table 2.
Table 2.
Mean Geodesic Topological Analysis Parameters
| GTA parameter | Head | Neck | Trochanter |
|---|---|---|---|
| Volume of junction (mm3) | 0.174 ± 0.105 | 0.179 ± 0.106 | 0.184 ± 0.104 |
| Convex hull of junction (mm3) | 0.435 ± 0.360 | 0.469 ± 0.389 | 0.497 ± 0.394 |
| Junction spacing (mm) | 0.729 ± 0.522 | 0.784 ± 0.575 | 0.821 ± 0.581 |
| Distance to junction (mm) | 1.005 ± 0.677 | 1.066 ± 0.703 | 1.107 ± 0.716 |
| Junction eccentricity | 0.832 ± 0.125 | 0.835 ± 0.127 | 0.833 ± 0.127 |
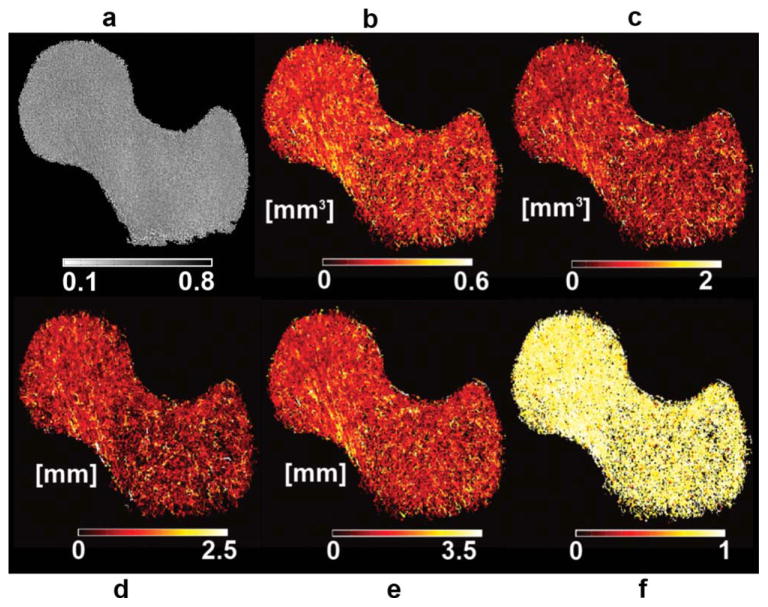
Due to the poor visualization offered by GTA parametric maps as shown in Fig. 6a for a VJ map, a different way of visualization was used. The new GTA maps were created by assigning to each trabecular bone voxel the GTA value of its closest connected junction. It is important to note that the original maps which we call pure GTA maps were used for quantification, while the new maps which we simply call GTA maps were used only for visualization purposes. The advantage of visualizing these maps is that they enhance weaker junctions (high GTA values) as can be appreciated in the individual VJ map in Fig. 6b, and in the mean GTA maps shown in Fig. 7 where femoral regions that are more fragile in terms of GTA parameters start to become apparent. However, as the number of subjects used to create mean GTA maps is increased, pure GTA maps should be used.
FIG. 6.
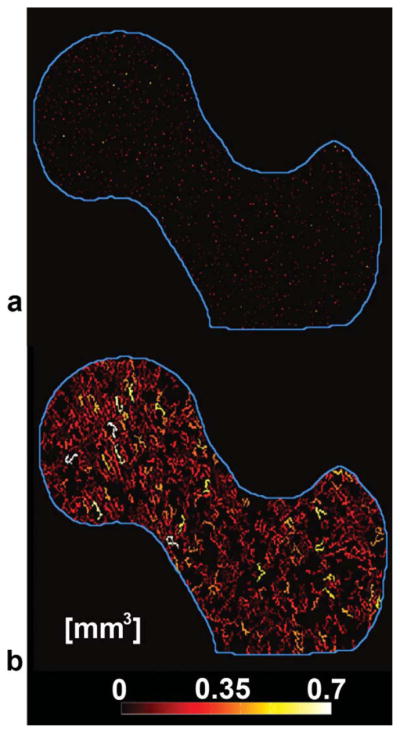
Volume of junction (VJ) maps derived from geodesic topological analysis. a: Pure VJ map where nonjunction pixels were deleted, leaving only trabecular bone junctions. b: VJ map used for better visualization of (a). Nonjunction pixels that were deleted in (a) were included and assigned the same VJ value of their closest connected junction.
FIG. 7.
Mean trabecular bone models. a: Fuzzy bone volume fraction map. b: VJ. c: Convex hull of junction. d: Junction spacing. e: Distance to junction. f: Junction eccentricity. Regions that are more fragile in terms of geodesic topological analysis (GTA) parameters show higher GTA values and are thus clearly enhanced in this figure. [Color figure can be viewed in the online issue, which is available at wileyonlinelibrary.com.]
Automatic Placement of VOI and Atlas-Based GTA Trabecular Bone Assessment
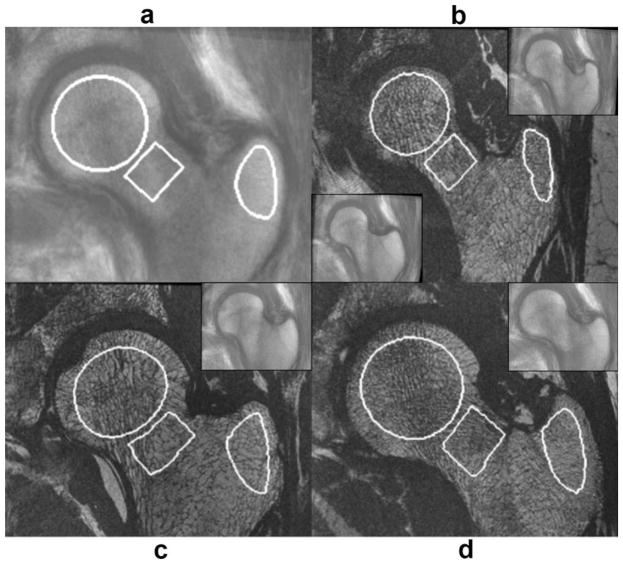
Figure 8 shows an example of the alignment of the W-IDEAL atlas to another subject using color-coded and chess-board images, while Fig. 9 shows examples of automatically placed VOI for the femoral head, neck, and trochanteric region.
FIG. 8.
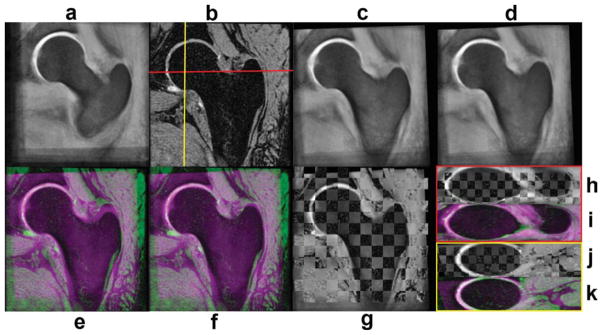
Example of the registration of the W-IDEAL atlas to an individual subject. a: Coronal W-IDEAL atlas. b: Coronal reference subject. c: W-IDEAL atlas after affine registration. d: W-IDEAL atlas after affine and nonrigid registration. e: Color-coded image after affine registration. f: Color-coded image after affine and nonrigid registration. g: Chess-board image after affine and nonrigid registration. h: Axial chess-board image after affine and nonrigid registration. i: Axial color-coded image after affine and nonrigid registration. j: Sagittal chess-board image after affine and nonrigid registration. k: Sagittal color-coded image after affine and nonrigid registration. [Color figure can be viewed in the online issue, which is available at wileyonlinelibrary.com.]
FIG. 9.
Automatic placement of anatomically corresponding volumes of interest (VOI). a: High-spatial resolution bSSFP atlas with defined VOI for the head, neck, and trochanteric region. b–d: High-spatial resolution images of the subjects to which VOI were transferred with the automatically placed VOI. Insets demonstrate the deformation of the high-spatial resolution atlas to match the reference subject. The trochanteric region in (b) was not correctly registered at the beginning (lower inset), however, after increasing the spatial resolution of the free-form deformations the registration was successful (upper inset). The trochanteric VOI in (b) shows the relatively lower performance of the technique in this region. [Color figure can be viewed in the online issue, which is available at wileyonlinelibrary.com.]
All atlas alignments were successfully completed with the exception of one subject in the trochanteric region (Fig. 9b). This reference subject had a quite narrower trochanter compared to that of the atlas making the spatial resolution of the FFDs insufficient for the alignment (Fig. 9b—lower inset). To obtain a successful alignment in this particular case, a smaller box was prescribed in the reference subject enclosing only the trochanter, and FFDs with control-point spacing of five pixels was applied (Fig. 9b—upper inset).
The mean distance between the femoral shape of the atlas and the 10 subjects used to validate the automatic placement of VOI was 5.964 mm (SD = 4.216 mm) before any alignment, which was reduced to 1.109 mm (SD = 1.119 mm) after affine registration, and further improved to 0.928 mm (SD = 0.954 mm) after affine registration and FFDs. All improvements were significant (P < 0.001). The exclusion of the subject with the narrow trochanter significantly improved the distances (P < 0.001; unpaired t tests) to 5.915 mm (SD = 4.009 mm), 1.045 mm (SD = 1.056 mm), and 0.867 mm (SD = 0.877 mm) before alignment, after affine registration, and after affine registration and FFDs, respectively. A visual representation of the spatial distribution of mean distances in the femoral shape of the W-IDEAL atlas is shown in Fig. 10.
FIG. 10.
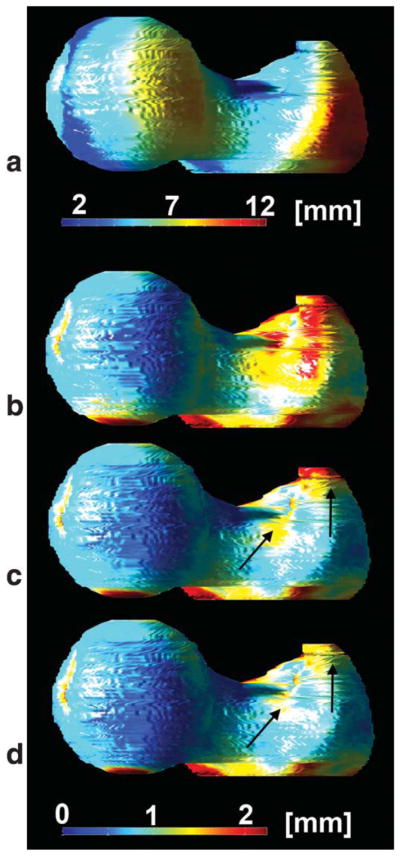
Spatial distribution of mean femoral distances for each point in the W-IDEAL atlas before and after its alignment to 10 subjects. a: Before registration. b: After affine registration. c: After affine and nonrigid registration with one subject showing a registration problem in the trochanteric region due to a quite narrow trochanter. d: After affine and nonrigid registration after correcting the registration problem in (c). Arrows indicate the region of the registration problem in the trochanter. [Color figure can be viewed in the online issue, which is available at wileyonlinelibrary.com.]
The trochanteric region of the subject with the narrow trochanter yielded mean minimum Euclidean distances of 4.819 mm (SD = 3.537 mm) before registration, 1.699 mm (SD = 1.084 mm) after affine registration, and 1.500 mm (SD = 1.295 mm) and 0.912 mm (SD = 0.966 mm) after affine registration and FFDs before and after improving the spatial resolution of the FFDs, respectively.
DISCUSSION
In this work, a technique to prescribe anatomically corresponding VOI in MRI cross-sectional studies of trabecular bone microarchitecture of the proximal femur has been presented. The application of the technique to generate mean maps of GTA parameters was also demonstrated for its potential use in atlas-based trabecular bone assessment. The technique is based on the generation of an atlas and its alignment to other subjects; all based on affine and nonrigid registrations. The technique was validated qualitatively using fused gray-level images and quantitatively using minimum Euclidean distances between femoral shapes.
Only very recently, in vivo MR images of the proximal femur with very high-spatial resolution were acquired (5). This achievement renders the proximal femur, a very important fracture site, accessible to trabecular bone imaging and analysis which was previously only done in the tibia, radius or calcaneous because of SNR limitations (23). Due to the nature of the femoral shape, accurate placement of VOI for reproducible trabecular bone analysis is much more challenging compared to the other body sites mentioned above. Furthermore, there are three distinguished regions of importance within the proximal femur for fracture risk assessment and evaluation of osteoporosis: the femoral head, the neck, and the trochanteric region.
A critical step in the analysis of trabecular bone microarchitecture based on high-spatial resolution images is the placement of VOI as studies have demonstrated dependence of trabecular bone parameters on regions belonging to the same anatomical site (7,24,25). While publications have addressed the issue of analyzing identical VOI for the same subject in MRI longitudinal studies in the distal tibia (26,27), the in vivo automatic placement of anatomically corresponding VOI has not been addressed yet for different subjects in MRI cross-sectional studies. Furthermore, the proximal femur features a much more complex shape than the proximal tibia or radius. Thus, a more sophisticated approach is required for the correct and reproducible placement of anatomical VOI for the analysis of trabecular bone in both cross-sectional and longitudinal studies. In this work, an atlas-based approach has been taken to address this particular problem. The atlas has been constructed based on what could be seen as a gray-level bone matching, thus enabling voxel-based comparisons of trabecular bone properties if it was needed. Although ex vivo computed tomography approaches to automate volumetric BMD and trabecular bone analysis have been reported in the literature (22,28), these algorithms require image segmentation of the proximal femur, which is not an easy task in MRI.
Smooth transitions in chess-board images (Figs. 1, 2, and 8) and lack of magenta and green colors in femoral bones in color-encoded images of registered femora (Figs. 1, 2, and 8) indicate good anatomic matching after affine and nonrigid registration. Furthermore, the sharp edges in the W-IDEAL and high-spatial resolution bSSFP atlases (Figs. 3 and 4) in the three orthogonal planes indicate that the anatomical variability was well accommodated and explained by the FFDs. These qualitative results were confirmed by quantitative data, as mean distances between femoral shapes after affine and nonrigid registrations were less than 1 mm, which were well in the range of previous values reported in the literature (16,29,30). Based on the spatial distribution of mean femoral distances in Figs. 5 and 10, and the examples of placement of VOI in Fig. 9, better alignments in the femoral head and neck can be appreciated compared to the trochanteric region, a situation that could be improved by reducing the spacing between the control points in the FFDs, which could be needed for voxel-based comparisons. The relatively higher registration errors observed in the alignments of the atlas to individual subjects compared to the intersubject registrations used to build the atlas might be due to the larger optimization masks as the reference bones were not segmented. However, as can be appreciated in Fig. 9, VOI prescribed in the high-spatial resolution bSSFP atlas were successfully placed at the expected regions in other subjects.
As trabecular bone microarchitecture plays an important role in trabecular bone strength, numerous techniques have been developed for its quantification based on high-spatial resolution MR images (10,31–33). The rationale behind GTA is that trabecular bone is an interconnected structure and therefore connectivity is an important component of bone strength. As junctions play a central role in connectivity, analyzing junctions beyond their density could provide measures that can contribute on the characterization of trabecular bone on healthy and disease stages. Some of the advantages of GTA are that it provides composite measures of scale, topology, and anisotropy, and that most of these measures are local, which suits well for atlas construction purposes. Mean GTA parametric maps were successfully obtained for each GTA parameter based on visual assessment and expected GTA values making them potential candidates to be used as standard of reference.
An important aspect in MRI studies involving multiple acquisitions per subject and subsequent simultaneous analysis of the different scans is that of involuntary subject motion between scans. When motion occurs between scans, intrasubject image registration is necessary prior to any image quantification to correct for this motion. However, due to the relatively comfortable position for the proximal femur scans, as well as proper subject restraining during MRI acquisitions, intrasubject registration was not necessary in this study (Fig. 11).
FIG. 11.
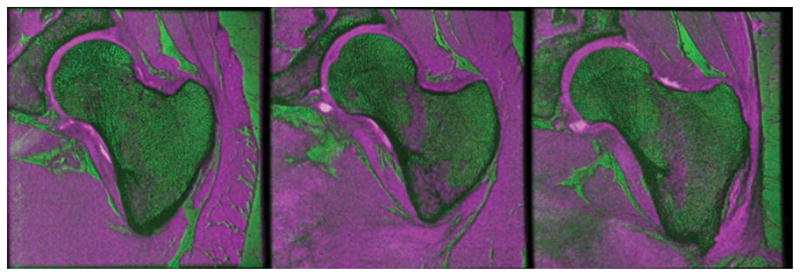
Color-coded images of W-IDEAL and high-spatial resolution bSSFP scans of three subjects showing good alignment between image acquisitions. W-IDEAL images were coded in magenta, while bSSFP images were coded in green. The magenta regions inside the proximal femur correspond to red marrow sections. Chess-board images are not shown since they are difficult to visualize due to the quite different image characteristics. [Color figure can be viewed in the online issue, which is available at wileyonlinelibrary.com.]
This study has certain limitations. The first limitation is that GTA analysis was performed in 2D, and this was due to the relatively thick slice thickness (500 μm). We are currently developing interpolation approaches to preserve trabecular bone connectivity from one slice to another so GTA can be performed in 3D. The second limitation is the lack of subjects with vertebral fracture; however, studies involving larger populations of healthy subjects and including patients with vertebral fracture are in progress to quantify the discriminatory capabilities of GTA in the proximal femur, as well as to identify a femoral region that is maximally associated with vertebral fracture risk in terms of GTA parameters.
In conclusion, a set of image processing algorithms have been presented which we believe will bring the analysis of trabecular bone of the proximal femur based on high-spatial resolution MR images one step forward. The presented algorithms are applied to perform intersubject registrations to create an atlas and mean GTA models. VOI are prescribed in the atlas and transferred to other subjects to analyze anatomically corresponding regions thus enabling GTA atlas-based trabecular bone assessment. Results indicate good registration accuracy as well as potential of the GTA models to be used as standard of reference. The ultimate goal of this research is to improve fracture risk prediction. The ability to identify identical regions with high fracture risk within the proximal femur across subjects is an important step toward this goal. This method might reduce the time and effort of manual definition of VOI in the proximal femur and might help to identify subjects with increased risk for fracture.
Acknowledgments
Grant sponsor: NIH; Grant numbers: R01AR057336, NIH 1P30AR058899.
References
- 1.Osteoporosis prevention, diagnosis, and therapy, NIH consensus statement. 2000;17:1–36. [PubMed] [Google Scholar]
- 2.Dasher LG, Newton CD, Lenchik L. Dual X-ray absorptiometry in today’s clinical practice. Radiol Clin North Am. 2010;48:541–560. doi: 10.1016/j.rcl.2010.02.019. [DOI] [PubMed] [Google Scholar]
- 3.Lang TF, Keyak JH, Heitz MW, Augat P, Lu Y, Mathur A, Genant HK. Volumetric quantitative computed tomography of the proximal femur: precision and relation to bone strength. Bone. 1997;21:101–108. doi: 10.1016/s8756-3282(97)00072-0. [DOI] [PubMed] [Google Scholar]
- 4.Schuit SCE, van der Klift M, Weel AEAM, de Laet CEDH, Burger H, Seeman E, Hofman A, Uitterlinden AG, van Leeuwen JPTM, Pols HAP. Fracture incidence and association with bone mineral density in elderly men and women: the Rotterdam study. Bone. 2004;34:195–202. doi: 10.1016/j.bone.2003.10.001. [DOI] [PubMed] [Google Scholar]
- 5.Krug R, Burghardt AJ, Majumdar S, Link TM. High-resolution imaging techniques for the assessment of osteoporosis. Radiol Clin North Am. 2010;48:601–621. doi: 10.1016/j.rcl.2010.02.015. [DOI] [PMC free article] [PubMed] [Google Scholar]
- 6.Krug R, Banerjee S, Han ET, Newitt DC, Link TM, Majumdar S. Feasibility of in vivo structural analysis of high-resolution magnetic resonance images of the proximal femur. Osteoporos Int. 2005;16:1307–1314. doi: 10.1007/s00198-005-1907-3. [DOI] [PubMed] [Google Scholar]
- 7.Blumenfeld J, Studholme C, Carballido-Gamio J, Carpenter D, Link TM, Majumdar S. Three-dimensional image registration of MR proximal femur images for the analysis of trabecular bone parameters. Med Phys. 2008;35:4630–4639. doi: 10.1118/1.2977764. [DOI] [PMC free article] [PubMed] [Google Scholar]
- 8.Dixon WT. Simple proton spectroscopic imaging. Radiology. 1984;153:189–194. doi: 10.1148/radiology.153.1.6089263. [DOI] [PubMed] [Google Scholar]
- 9.Glover GH. Multipoint dixon technique for water and fat proton and susceptibility imaging. J Magn Reson Imaging. 1991;1:521–530. doi: 10.1002/jmri.1880010504. [DOI] [PubMed] [Google Scholar]
- 10.Carballido-Gamio J, Krug R, Huber MB, Hyun B, Eckstein F, Majumdar S, Link TM. Geodesic topological analysis of trabecular bone microarchitecture from high-spatial resolution magnetic resonance images. Magn Reson Med. 2009;61:448–456. doi: 10.1002/mrm.21835. [DOI] [PMC free article] [PubMed] [Google Scholar]
- 11.Reeder SB, Wen Z, Yu H, Pineda AR, Gold GE, Markl M, Pelc NJ. Multicoil dixon chemical species separation with an iterative least-squares estimation method. Magn Reson Med. 2004;51:35–45. doi: 10.1002/mrm.10675. [DOI] [PubMed] [Google Scholar]
- 12.Yu H, Reeder SB, Shimakawa A, Brittain JH, Pelc NJ. Field map estimation with a region growing scheme for iterative 3-point water–fat decomposition. Magn Reson Med. 2005;54:1032–1039. doi: 10.1002/mrm.20654. [DOI] [PubMed] [Google Scholar]
- 13.Sled JG, Zijdenbos AP, Evans AC. A nonparametric method for automatic correction of intensity nonuniformity in MRI data. IEEE Trans Med Imaging. 1998;17:87–97. doi: 10.1109/42.668698. [DOI] [PubMed] [Google Scholar]
- 14.Folkesson J, Krug R, Goldenstein J, Issever AS, Fang C, Link TM, Majumdar S. Evaluation of correction methods for coil-induced intensity inhomogeneities and their influence on trabecular bone structure parameters from MR images. Med Phys. 2009;36:1267–1274. doi: 10.1118/1.3097281. [DOI] [PubMed] [Google Scholar]
- 15.Rueckert D, Sonoda LI, Hayes C, Hill DL, Leach MO, Hawkes DJ. Nonrigid registration using free-form deformations: application to breast MR images. IEEE Trans Med Imaging. 1999;18:712–721. doi: 10.1109/42.796284. [DOI] [PubMed] [Google Scholar]
- 16.Rueckert D, Frangi AF, Schnabel JA. Automatic construction of 3-d statistical deformation models of the brain using nonrigid registration. IEEE Trans Med Imaging. 2003;22:1014–1025. doi: 10.1109/TMI.2003.815865. [DOI] [PubMed] [Google Scholar]
- 17.Rohlfing T, Maurer CRJ, Bluemke DA, Jacobs MA. Volume-preserving nonrigid registration of MR breast images using free-form deformation with an incompressibility constraint. IEEE Trans Med Imaging. 2003;22:730–741. doi: 10.1109/TMI.2003.814791. [DOI] [PubMed] [Google Scholar]
- 18.Lee S, Wolberg G, Shin SY. Scattered data interpolation with multilevel b-splines. IEEE Trans Visualization Comput Graph. 1997;3:228–244. [Google Scholar]
- 19.Grenander U, Miller MI. Computational anatomy: an emerging discipline. Quart Appl Math. 1998;56:617–694. [Google Scholar]
- 20.Folkesson J, Carballido-Gamio J, Eckstein F, Link TM, Majumdar S. Local bone enhancement fuzzy clustering for segmentation of MR trabecular bone images. Med Phys. 2010;37:295–302. doi: 10.1118/1.3264615. [DOI] [PMC free article] [PubMed] [Google Scholar]
- 21.Naish JH, Xanthopoulos E, Hutchinson CE, Waterton JC, Taylor CJ. MR measurement of articular cartilage thickness distribution in the hip. Osteoarthritis Cartilage. 2006;14:967–973. doi: 10.1016/j.joca.2006.03.017. [DOI] [PubMed] [Google Scholar]
- 22.Huber MB, Carballido-Gamio J, Bauer JS, Baum T, Eckstein F, Lochmüller EM, Majumdar S, Link TM. Proximal femur specimens: automated 3D trabecular bone mineral density analysis at multidetector CT—correlation with biomechanical strength measurement. Radiology. 2008;247:472–481. doi: 10.1148/radiol.2472070982. [DOI] [PubMed] [Google Scholar]
- 23.Wehrli FW. Structural and functional assessment of trabecular and cortical bone by micro magnetic resonance imaging. J Magn Reson Imaging. 2007;25:390–409. doi: 10.1002/jmri.20807. [DOI] [PubMed] [Google Scholar]
- 24.Newitt DC, van Rietbergen B, Majumdar S. Processing and analysis of in vivo high-resolution MR images of trabecular bone for longitudinal studies: reproducibility of structural measures and micro-finite element analysis derived mechanical properties. Osteoporos Int. 2002;13:278–287. doi: 10.1007/s001980200027. [DOI] [PubMed] [Google Scholar]
- 25.Gomberg BR, Wehrli FW, Vasilic B, Weening RH, Saha PK, Song HK, Wright AC. Reproducibility and error sources of micro-MRI-based trabecular bone structural parameters of the distal radius and tibia. Bone. 2004;35:266–276. doi: 10.1016/j.bone.2004.02.017. [DOI] [PubMed] [Google Scholar]
- 26.Blumenfeld J, Carballido-Gamio J, Krug R, Blezek DJ, Hancu I, Majumdar S. Automatic prospective registration of high-resolution trabecular bone images of the tibia. Ann Biomed Eng. 2007;35:1924–1931. doi: 10.1007/s10439-007-9365-z. [DOI] [PubMed] [Google Scholar]
- 27.Rajapakse CS, Magland JF, Wehrli FW. Fast prospective registration of in vivo MR images of trabecular bone microstructure in longitudinal studies. Magn Reson Med. 2008;59:1120–1126. doi: 10.1002/mrm.21593. [DOI] [PMC free article] [PubMed] [Google Scholar]
- 28.Baum T, Carballido-Gamio J, Huber MB, Müller D, Monetti R, Räth C, Eckstein F, Lochmüller EM, Majumdar S, Rummeny EJ, Link TM, Bauer JS. Automated 3D trabecular bone structure analysis of the proximal femur-prediction of biomechanical strength by CT and DXA. Osteoporos Int. 2010;21:1553–1564. doi: 10.1007/s00198-009-1090-z. [DOI] [PMC free article] [PubMed] [Google Scholar]
- 29.Shen D, Davatzikos C. Hammer: hierarchical attribute matching mechanism for elastic registration. IEEE Trans Med Imaging. 2002;21:1421–1439. doi: 10.1109/TMI.2002.803111. [DOI] [PubMed] [Google Scholar]
- 30.Williams TG, Holmes AP, Waterton JC, Maciewicz RA, Hutchinson CE, Moots RJ, Nash AFP, Taylor CJ. Anatomically corresponded regional analysis of cartilage in asymptomatic and osteoarthritic knees by statistical shape modelling of the bone. IEEE Trans Med Imaging. 2010;29:1541–1559. doi: 10.1109/TMI.2010.2047653. [DOI] [PubMed] [Google Scholar]
- 31.Gomberg BR, Saha PK, Song HK, Hwang SN, Wehrli FW. Topological analysis of trabecular bone MR images. IEEE Trans Med Imaging. 2000;19:166–174. doi: 10.1109/42.845175. [DOI] [PubMed] [Google Scholar]
- 32.Wald MJ, Vasilic B, Saha PK, Wehrli FW. Spatial autocorrelation and mean intercept length analysis of trabecular bone anisotropy applied to in vivo magnetic resonance imaging. Med Phys. 2007;34:1110–1120. doi: 10.1118/1.2437281. [DOI] [PubMed] [Google Scholar]
- 33.Vasilic B, Rajapakse CS, Wehrli FW. Classification of trabeculae into three-dimensional rodlike and platelike structures via local inertial anisotropy. Med Phys. 2009;36:3280–3291. doi: 10.1118/1.3140582. [DOI] [PMC free article] [PubMed] [Google Scholar]


