

Abstract
A field study was conducted with eighth-grade students to determine the impact of morning light on circadian timing, sleep duration and performance. Before and during school hours for a week in February 2009, half the students studied wore orange glasses that minimized short-wavelength light exposure needed for circadian system stimulation. A control group did not wear the orange glasses. The Daysimeter, a circadian light meter, measured light/dark exposures in both groups for seven days. Circadian timing was significantly delayed for those students who wore orange glasses compared to the control group. Sleep durations were slightly, but not significantly, curtailed in the orange-glasses group. Performance scores on a brief, standardized psychomotor vigilance test and self-reports of well-being were not significantly different between the two groups.
Keywords: Alertness, daylight, productivity, circadian rhythms, circadian disruption, performance, light measurement, melatonin, healthy buildings
1.0 Introduction
The impact of daylight on performance, mood and well-being has been investigated for many years, not only in schools, but also in office and healthcare environments. Several researchers have documented that people consider daylight as a highly desirable feature of building design.1, 2, 3, 4, 5 Although people find daylight to be highly desirable, its actual impact on performance and well-being is less clear. Some studies have shown that light can improve performance and well-being in office environments, schools, and hospitals,6, 7, 8, 9 while other studies failed to show positive results.10, 11, 12 Several hypotheses have been put forward in an attempt to explain why daylight might improve performance, mood and well-being, 13, 14 but there are no conclusive studies linking daylight to these outcomes.1
Some hypotheses offered have discussed daylight’s capabilities as a light source to improve vision. Certainly daylight can provide high light levels and good colour rendering, both of which contribute to excellent visual performance and colour discrimination.14 However, electric light sources can also provide high light levels and good colour rendering, providing the same, excellent visual performance and colour discrimination.15 Thus, no credence can be placed on daylight as a special light source for vision. Other suggestions have been made that daylight is a stimulus for psychological well-being, presumably because daylight is considered to be a ‘natural’ rather than an ‘artificial’ (electric) light source.16, 17 This psychological association may in fact contribute to better psychological well-being,18 but the link to improved productivity cannot be shown reliably. In short, searches for possible underlying mechanisms responding to daylight and improving human performance have been frustrated, at least until recently.14, 19
In the last 30 years, and particularly in the last 10 years, a more detailed understanding has emerged of the role that all types of light plays in regulating the circadian (approximately 24-hour) patterns of human behaviour.20, 21
The circadian clock controls the timing of a wide variety of biological functions from cell division in single cells to organized behaviours such as the timing and consolidation of sleep.20 It is well established now that the timing of the endogenous circadian clock is controlled by the exogenous light-dark cycle incident on the retina.21 The spectral and absolute sensitivities of the human circadian system have now been modelled for any type and level of light source, natural or fabricated.22 Because daylight can provide a robust circadian stimulus of the right spectrum, quantity, timing and duration, it is reasonable to suppose that daylight can affect circadian timing and thus sleep onset at night and rise time in the morning. Because the circadian system is differentially sensitive to light throughout the 24-hour cycle, it is important to continuously measure the light stimulus during waking hours. When light capable of stimulating the human circadian system is applied in the morning, the circadian clock will advance, resulting in earlier bedtimes. Application of the same light in the evening will delay the clock, resulting in delayed bedtimes.23
As part of the large and growing body of evidence that the circadian system can impact health and well-being, in 2002 Figueiro and colleagues13 hypothesized that, during winter months with short days, the absence of daylight in interior spaces during work hours might have a negative impact on worker productivity. Explicit in their hypothesis was that people working in interior offices would not have the opportunity to be exposed to sufficiently high light levels at the cornea to consistently stimulate the human circadian system during their working hours. Furthermore, during winter in latitudes characterized by shortened days, a person could conceivably come to and leave from work in darkness. This scenario might limit the opportunity for circadian light exposure outside working hours, further increasing the potential for prolonged “biological darkness” and therefore providing an insufficient stimulus for synchronization of a person’s circadian rhythms to the solar cycle. Without synchronization of circadian time to the solar day, individuals would likely experience sleep disruption and/or misalignment between alertness and working hours. The results from that study indeed suggested that exposures to daylight may positively affect productivity in commercial buildings during winter months as measured by time-at-task. The findings from Figueiro and colleagues were not replicated in a second (unpublished) study in the same location where layoffs had occurred and the staff was not as enthusiastic about their working environment as they had been in the earlier study. Thus, lifestyle issues may have obscured the effects previously demonstrated. Importantly, both the published13 and unpublished studies by Figueiro and colleagues were conducted before the Daysimeter was developed, so the actual light exposures experienced by the workers in the two studies were not known. The Daysimeter, a light exposure measurement device, is calibrated to record both photopic and circadian light exposures continuously for up to 30 days.24 Its photosensors are placed near the plane of the user’s corneas so as to measure retinal light exposure as accurately and practically as possible. The inability to characterize the light exposures experienced by subjects in the earlier studies undermined useful interpretation of those results. As shown subsequently by Figueiro and Rea in two recent studies,25, 26 in order to meaningfully interpret light-induced effects on circadian timing, it is very important to quantify circadian light exposure in naturalistic settings throughout the day, both during the phase advance and the phase delay portions of the, so-called phase response curve (PRC).23
In the first within-subjects study, Figueiro and Rea 25 showed that removal of circadian morning light delayed circadian timing in adolescents. In that study, the researchers compared dim light melatonin onset (DLMO) before and after participants wore orange glasses for five days during the school week. Results showed that DLMO was delayed by approximately 30 minutes. In the second within-subjects study,26 researchers showed that when the students were exposed to daylight during the spring evenings, they experienced delayed circadian phases and exhibited sleep restriction relative to winter time when they were exposed to less light indoors. Thus, the Daysimeter data were crucial for establishing a causal link between light exposures and circadian timing, as measured by DLMO.
Heschong and colleagues reported that scholastic performance was more than 20% better in “good” daylighted schools than in “poor” daylighted schools.6 Their conclusions rested on a regression analysis performed on the scholastic performance score changes over the school year among 21 000 secondary school students in over 2 000 classrooms; daylight was one of 150 variables used in a regression analysis. Although daylight was a statistically significant variable, it only accounted for 0.3% of the variance in the model, a very small amount compared to the many other variables. Recent reviews by Boyce27 and by the National Academy of Sciences28 call into question the validity of these claims on the basis of statistical orthodoxy. Indeed, Heschong and colleagues, using the same epidemiological techniques, could not replicate their findings in a subsequent study, although this report has received much less publicity.12
This does not mean, however, that daylight is unimportant to scholastic performance. It is still reasonable to develop social or organizational policies based upon a strong scientific foundation even if statistical associations are weak. In order to begin to establish a scientific foundation in the context of linking daylight to scholastic performance, three important issues must be addressed. First, it is necessary to identify an underlying mechanism that could plausibly support such a link. Second, it is necessary to measure the stimulus needed to trigger that mechanism. And, finally, a formal hypothesis of the presumed biophysical relationship between the measured stimulus and a measured response from the mechanism must be tested. Ultimately, for validation, it is also important to demonstrate that the application of the stimulus consistently produces a predictable response.
The purpose of the present study was to systematically explore the possibility that the human circadian system might be the underlying mechanism in the proposed link between daylight and scholastic performance. The present between-groups study is an attempt to extend the recent findings of Figueiro and Rea25 by implementing the same orange-glasses intervention in one group and comparing circadian light exposures, circadian timing, sleep onsets and duration, performance scores on standardized psychomotor vigilance tasks, and self-reports of well-being to a control group of students who did not wear the orange glasses. Based upon a previous site evaluation by the Lighting Research Center (LRC), it was expected that students at Smith Middle School in North Carolina would be exposed to some of the highest light levels found in an indoor classroom environment, due to south-facing roof monitors in most spaces, making this an appropriate site for the proposed study.
2. Methods
2.1 Participant Selection
Rensselaer Polytechnic Institute’s Institution Review Board (IRB) approved the study protocol.29 Two hundred forty eighth-grade students (100 female, 140 male) at Smith Middle School, Chapel Hill, NC, were invitedto complete several self-report measures of psychosocial stress, mood, and sleep quality. The following questionnaires were used: Sleep Habits Survey, Child Behavior Checklist (CBCL; parent to complete),30 Youth Self-Report (YSR),30 Perceived Stress Scale (PSS),31 the Positive and Negative Affect Schedule (PANAS),32 the Munich ChronoType Questionnaire (MCTQ),33 and the Center for Epidemiologic Studies Depression Scale (CES-D).34 These questionnaires are detailed in Figueiro et al26 and their reliability have been validated, in many cases using adolescents.35, 36, 37, 38 Twenty-four students who completed the surveys and were within the normal range on all scales were recruited to take part in the present study of light exposure, sleep onset and duration, perceived levels of sleepiness, psychomotor vigilance task performance, psychosocial distress, mood, and circadian phase. Twenty-three participants (nine females and 14 males, age 13–14 years) completed the present study conducted in February 2009.
2.2 Site Selection
Smith Middle School is unusual with respect to current architectural practice in terms of the amount and distribution of daylight provided to interior spaces.39 The building uses south-facing roof monitors in most spaces to deliver daylight to the interior (Figure 1). Diffuse toplighting is unaffected by occlusions due to blinds or wall displays typical of sidelighting. To minimize direct sunlight entering the spaces, light entering the roof monitor is baffled with cloth partitions; only diffuse light enters the room (Figure 2). The electric lighting system is controlled with manual switches, motion sensors, and photosensors that modulate the output of the 4100 K fluorescent lamps operated with dimming ballasts. This strategy minimizes glare and allows electric lights to be off for most of the day.
Figure 1.

Photo and Site plan of Smith Middle School. Rectangles within rooms indicate roof monitors for toplighting.39
Figure 2.

Cross-section and photo of typical south-facing roof monitor; the cloth baffles prevent direct sunlight from entering the space.39
The daylighting conditions were evaluated as part of an extensive case study in 2004.39 On a sunny afternoon in March 2004, LRC researchers measured illuminances on several surfaces in a classroom. At the time of the site measurements, all illumination was provided by daylight. Horizontal illuminances on desks ranged from 1330–2150 lux; vertical illuminances on the chalkboard ranged from 996–1265 lux. Battery-powered monitoring devices also recorded illuminances on the teacher’s desk over an extended period of time. Illuminance levels on the teacher’s desk, located near the perimeter of the room rather than directly under the roof monitor, averaged 550 lux on sunny days and 320 lux on partly-cloudy days. As mentioned above, this was an ideal site to study the effect of daylight on student physiology, behaviour, and attitudes.
2.3 Dependent Measures
2.3.1 Light
The Daysimeter was used to measure personal circadian and photopic light exposures for seven consecutive days. The Daysimeter employs two photosensors separately calibrated to provide a photopic (visual) and a short-wavelength (“blue”) response to optical radiation (Figure 3). The two sensors are juxtaposed at the end of a printed circuit board. This creates a compact, in-line package that rests on the side of a participant’s head and places the sensors close to the same plane as the participant’s cornea. The photopic sensor directly measures illuminance in lux. The “blue” light sensor has peak sensitivity at short wavelengths, near the peak of the spectral sensitivity of the human circadian system. Circadian light (CLA) levels are determined using post-processing software on the data obtained from the Daysimeter’s two light measurement channels.40 Data are stored in a flash memory drive, which may be easily used to download data to a computer.
Figure 3.

Student wearing orange glasses and a Daysimeter.
The Daysimeter is also equipped with two, on-board solid-state accelerometers and a solid-state thermometer; the latter is used as part of the light calibration procedure. The accelerometer and temperature data are used to determine whether participants complied with the prescribed experimental protocol. Because the Daysimeter was worn on the head, if there was limited motion and a temperature drop in the data string, it would be evident that the device had not been worn. For more detailed information about the Daysimeter device and how data are collected and analysed, please refer to previous publications.22, 24, 40, 41
2.3.2 Dim Light Melatonin Onset (DLMO)
Melatonin is a hormone produced by the pineal gland at night and under conditions of darkness.43 Melatonin is a well-known marker of circadian timing and can be measured in plasma, saliva, or urine. Melatonin onset occurs in the early evening, typically after 19:00–20:00; it reaches a peak between 02:00 and 05:00; and by 10:00 it reaches daytime levels again.42 DLMO is commonly used as a phase marker of the melatonin rhythm.43 Typically, DLMO is observed two to three hours prior to an individual’s habitual sleep time. DLMO can be determined from a threshold concentration (usually 4.0 pg/ml in saliva) using a partial melatonin profile. The partial melatonin profile is established from samples collected every 30 minutes for four to five hours in the early evening (usually two hours prior to estimated DLMO to two hours after estimated DLMO) while participants are sitting in a dim room (less than 10 lux of white light at the cornea).43 For this study, participants were placed in a room with dim red light (peak λ=640 nm; less than 2 lux at the cornea) for data collection. DLMO was calculated for each participant using linear interpolation between sample concentrations. An estimated melatonin concentration of 4.0 pg/ml was used as the threshold. The sensitivity of the saliva assay was 0.7 pg/ml and the intra- and inter-assay coefficients of variability were 12.1% and 13.2% respectively.
2.3.3 Psychomotor Vigilance Test (PVT) and self-reports of Sleepiness
Personal digital assistants (PDAs, Tungsten E2 models from Palm, Inc.) were used to evaluate and record students’ sleepiness and performance. The Karolinska Sleepiness Scale (KSS) was presented first on the PDA to assess their level of subjective sleepiness. Brain Checkers 2.75, from Behavioural Neuroscience Systems, LLC, was then used to administer Psychomotor Vigilance Tests (PVT).44 Three performance tests were employed: 1) a Simple Reaction Time (SRT) test, 2) a 2-Forced Choice Reaction Time (FCRT) test, and 3) a Matching-to-Sample (MTS) test. The SRT test presented the participant with a yellow shape on a blue background. The participant then had to tap the screen with a stylus as soon as the shape was seen; the system recorded the response time. For the FCRT, the participants were presented with a single-digit numeral—2, 3, 4 or 5—for up to five seconds. The participant was then given a choice between whether the numeral was either 2 or 3 or if it was 4 or 5. The participant then had to indicate the choice by tapping the appropriate box on the screen with a stylus; the system recorded the response time and whether the choice was correct. For the MTS test, participants were asked to memorize a grid pattern of red and blue squares for between two and four seconds. The pattern disappeared and after a random interval, two patterns appeared on the screen; one of them was the same as the first pattern and one was slightly different. The participant chose a pattern by tapping the appropriate box on the screen with a stylus; the system recorded the response time and whether the choice was correct.
2.4 Self-reports of Mood
Two scales used in the initial participant selection, the PANAS and CES-D scales, were subsequently used to probe affect and depression, respectively.32, 34 The PANAS scale is composed of 20 words describing feelings and emotions. It consists of 10 positive affect items (interested, excited, strong, enthusiastic, proud, alert, inspired, determined, attentive, and active) and 10 negative affect items (distressed, upset, guilty, scared, hostile, irritable, ashamed, nervous, jittery, and afraid). Participants were asked to rate how they felt on each item from 1 to 5, where 1 = “very slightly or not at all,” and 5 = “extremely.” CES-D is a 10-point scale that measures how a person felt during the past week.
2.5 Procedures
For one week (Friday, February 13, 2009 to Friday, February 20, 2009) participants were asked to wear the Daysimeter during their waking hours except during strenuous exercise and when bathing. When it was not being worn, they were asked to place the Daysimeter beside them; they were asked to place it next to their bed when they slept. In addition to the Daysimeter, and based upon pseudo-randomization and the individual’s willingness to wear them, half the participants also wore orange-tinted safety glasses (SAF-T-CURE® Orange UV Filter Glasses) like those used in the previous study.25 The orange glasses filtered out optical radiation below 525 nm. These participants (three females and eight males) were offered US$80 for the one-week protocol. Those participants who only wore the Daysimeter (six females and six males) were offered US$70. The students in the group that wore the orange glasses were asked to wear them, in addition to the Daysimeter, from the time they awoke until they returned home from school in the afternoon (approximately from 06:00 to 15:00). They were not asked to wear the orange glasses on the Friday the experiment started and on the weekend, although they were asked to wear the Daysimeter during those times; the orange glasses were, therefore, worn during the following school week, from Monday to Friday. When worn, the orange glasses covered the Daysimeter light sensors (Figure 3). One day (Thursday, February 19, 2009), school was scheduled to start at 10:00; the participants were required to wear the orange glasses and the Daysimeter at home, from the time they awoke. While the orange glasses undoubtedly affected colour perception, there was no reason to believe this intervention affected the participants’ mood and well-being. Several studies have also been conducted demonstrating that, for foveal tasks such as reading, the visual stimulus can be properly characterized in terms of photopic luminance, irrespective of source colour.14, 45, 46 Presumably then, the orange glasses should have had no effect on visual performance due to spectral changes, but the absolute reduction in retinal light exposure may have had an impact of visual performance for this group.47
The one-week session began at the school on the morning of Friday, February 13, 2009. Each student was asked to keep a sleep log to record his/her daily bedtimes, wake-up times, and sleep latency, as well as any times the Daysimeter may have been removed (e.g., for bathing or for strenuous exercise). On the following Friday evening, February 20, the students returned to school at 17:30. From 18:00 until 23:00, the ceiling lights in the meeting room were kept off and the room was lit with dim red light, during which time the students were allowed to watch movies, play games, read or study.
Participants were allowed to remove the Daysimeters at 18:00, just prior to DLMO data collection. This data collection time bracket was selected based on participants’ predicted DLMO. DLMO predictions were performed using reported bed times during the school week, which were provided in the MCTQ. Because participants with normal chronotypes were selected, saliva samples were collected at the same time on the last Friday evening, February 20. Additional samples were obtained from those participants who had indicated they had slightly later bed times. Students were not allowed to perform extraneous exercise during the collection period and were asked to remain sitting for at least five minutes prior to each sample collection. Serial saliva samples (test tubes utilized were Salivette products, The Sarstedt Group, Newton, NC, USA) were collected every 30 minutes to determine DLMO. Students were not allowed to eat during this period and were only allowed to drink water immediately following each sample collection. No water was allowed 15 minutes prior to each sample collection. The participants chewed on a plain cotton cylinder until it was saturated. These samples were then centrifuged and refrigerated by the research group. The refrigerated samples were later sent to Pharmasan Labs, in Osceola, WI, for melatonin assay. During this collection period, the students were again asked to complete the CES-D and the PANAS questionnaires they had completed during participant selection.
In addition to wearing the Daysimeter for one week, the students were asked to complete standardized performance tests (PVT) and to complete self-reports of sleepiness on a PDA twice daily while school was in session. The tests were administered when the students first arrived at school and again just before lunchtime. Students were asked to start the PDA tests on the first Friday at lunchtime so they could get used to them. These initial tests were not used in the data analyses.
3. Results
3.1 Light
Table 1 summarizes the means and standard error of the means (S.E.M.) results of the light measurements from Sunday 18:00 to Friday 18:00. Although participants were asked to wear the Daysimeter during the weekend, visual inspection of the data revealed that compliance was low; therefore, the weekend data were removed from the analyses. In order to have complete 24-hr data for each school day during the data collection week, the data analyses period started at 18:00 on Sunday, February 15 and ended at 18:00 on Friday, February 20, just prior to data collection for DLMO. Upon analysis of the data, it was discovered that some students removed the Daysimeters and the orange glasses for short periods of times throughout the school week as well as while they were asleep. Because two students who were not wearing the orange glasses and one who was wearing the orange glasses did not wear the Daysimeter as instructed (i.e., visual inspection of the data showed that the Daysimeter was not being worn for most of the days), their Daysimeter data were removed from the analyses. Two participants who were also wearing orange glasses had Daysimeters that malfunctioned in the field; the light data were declared invalid (inspection of the temperature data and the activity data showed they complied with the experimental protocol and wore the Daysimeter almost all times while awake). Reported here are data for eight students who wore the orange glasses as instructed and data for nine students in the control group. The summary statistics on light exposure are based upon five days (Sunday 18:00 to Friday 18:00) and exclude any data where participants had not worn the Daysimeter continuously for at least 30 minutes. Using MATLAB, a program code was written to eliminate those data where the temperature recorded by the Daysimeter’s on-board thermometer simultaneously dropped below a criterion value (34°C) and no activity was recorded; therefore, data collected while students were asleep are not included in the summary statistics table. Although a one-sample Kolmogorov-Smirnov test revealed that the data were normal, log transforms of the photopic and CLA data are also included because some of recorded light exposures valueswere extremely high during daylight hours. Table 1 lists means and S.E.M. values obtained from both groups for photopic light exposure (lux), log photopic light exposure (log lux), CLA, and log CLA. Unpaired one-tailed Student’s t tests were performed to compare the four estimates of light exposures for the two groups.
Table 1.
| a. Daysimeter photopic and circadian light exposure data (means and [S.E.M.]). | ||||
|---|---|---|---|---|
| Orange Glasses |
Photopic Light (lux) |
Log Photopic Light (Log lux) |
Circadian Light Exposure (CLA) |
Log Circadian Light Exposure |
| NO | 400 [162] | 1.6 [0.2] | 443 [154] | 1.7 [0.2] |
| YES | 166 [50] | 1.4 [0.2] | 66 [31] | 1.0 [0.2] |
| p value | < 0.0001 | < 0.0001 | < 0.0001 | < 0.0001 |
| b. Daysimeter Log Circadian Light Exposure (CLA) (means and [S.E.M]) for the four interval times shown in Figure 4. | ||||
|---|---|---|---|---|
| Orange Glasses |
06:00 – 08:30 | 08:30:01 – 15:00 | 15:00:01 – 18:00 | 18:00:01 –23:30 |
| NO | 1.64 [0.17] | 1.95 [0.24] | 1.44 [0.19] | 0.93 [0.21] |
| YES | 0.85 [0.08] | 0.77 [0.24] | 1.01 [0.37] | 0.7 [0.15] |
As expected, participants wearing the orange glasses received significantly less circadian light (CLA) during the morning and during the school day than the control group. Because the timing, duration, and amount of exposure are crucial for predicting the effects of light on circadian timing, the calibrated photometric data from the Daysimeter were separated into meaningful intervals. Using data from Monday 06:00 to Thursday 23:30, log CLA exposures for four intervals were calculated. Figure 4 shows log CLA values broken down into the time when the first student awoke until the start of the school (06:00 – 08:30), the school day (08:30 – 15:00), the time between end of school and sunset in Chapel Hill, NC during this week in February (15:00 – 18:00), and the time from sunset until the time when the last student went to bed (18:00 – 23:30).
Figure 4.
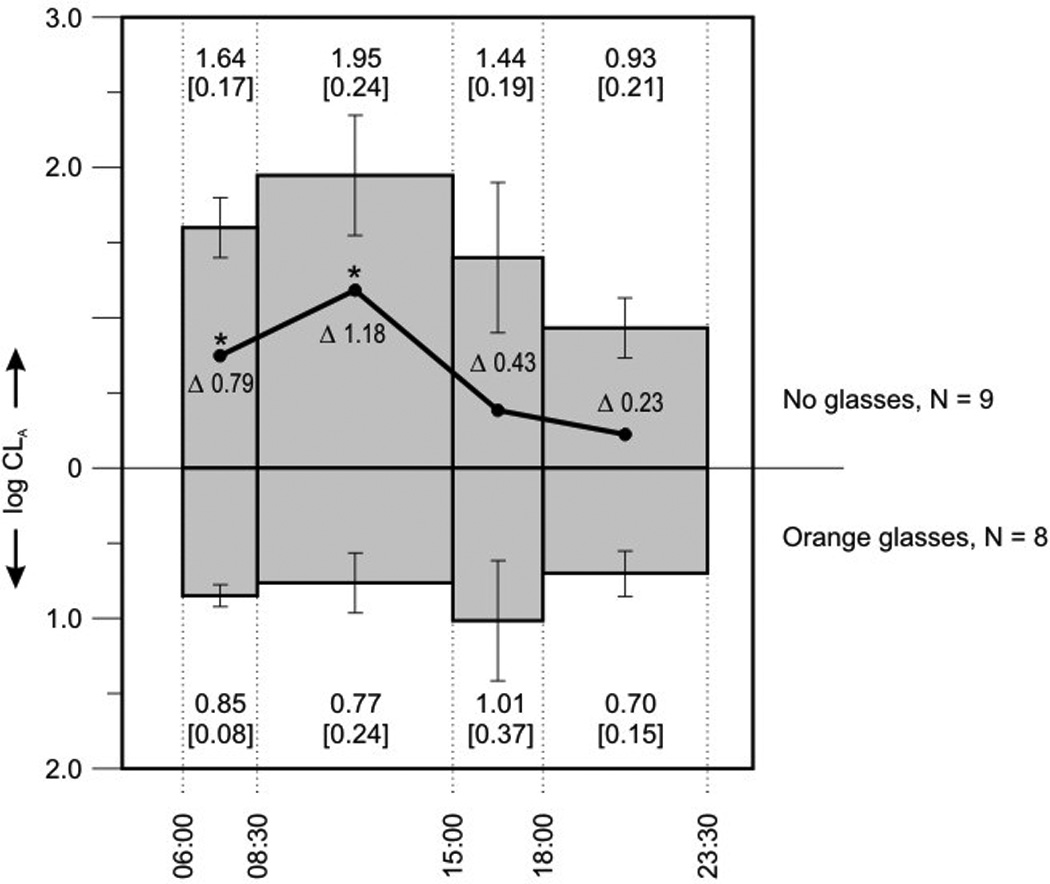
Log CLA values (the numbers at the top of the graph are the means and [S.E.M] for the “no glasses” group and the numbers at the bottom of the graph are the means and [S.E.M] for the “orange glasses” group) broken down into four time intervals. The solid line (and respective Δ log CLA values) represents the difference in log CLA for the two groups during the four intervals. These differences represent the differential exposures of circadian light exposure for the two groups of students during the phase advance (morning) and the phase delay (evening) portions of the PRC. Those who did not wear the orange glasses received significantly more circadian light (p < 0.01) in the early morning and while they were at school (shown with asterisks), compared to those wearing the orange glasses. It should be noted too that students who did not wear the orange glasses also received more light in their phase delay portion (evening) of the PRC, although this difference was not statistically significant.
Log CLA (means ± S.E.M.) for those not wearing the orange glasses are shown at the top, and log CLA for those wearing the orange glasses are shown at the bottom of the graph. Also shown in Figure 4 (solid line) are the differences in log CLA for the two groups during those intervals because the differences in log CLA represent the differential exposures of effective circadian light for the two groups of students during the phase advance and the phase delay portions of the PRC. The students wearing the orange glasses received significantly less circadian light throughout the day (06:00 – 23:30) than the control group, but statistically significant differences were limited to the phase advance portion of the PRC, that is, in the morning and midday (06:00 – 15:00). Given this differential exposure to circadian light between the two groups, the students wearing the orange glasses in the morning and during school were expected to be more phase-delayed than those in the control group.
3.2 Dim Light Melatonin Onset (DLMO)
DLMO ± standard deviation (in hours and minutes) for eleven participants who wore the orange glasses was at 21:35 ± 0.49 and for twelve participants who did not wear the orange glasses was 21.01 ± 0.31. Unpaired one-tailed Student’s t-test was performed and revealed a significantly (p = 0.03) later DLMO for those participants wearing the orange glasses compared to the control group.
3.3 Sleep Logs
Students were asked to keep a sleep log during the week of the study to report their bedtimes, sleep latency and wake-up times. Sleep times were calculated by adding the sleep latency minutes to the bedtimes. Delta (Δ) sleep times on Sunday evening (prior to orange glasses intervention in the intervention group) and on Thursday evening (after orange glasses intervention) were calculated to determine the impact of the orange glasses intervention on sleep timing. Δ sleep durations were calculated by taking the difference between sleep durations on Sunday night and those on Thursday night. Twenty participants completed the daily sleep logs (10 who wore the orange glasses and 10 controls) and their data were used in the analyses. Based upon unpaired Student’s t-tests, there were no statistically significant differences in Δ sleep times and Δ sleep durations between the two groups either on Sunday or on Thursday. The means ± standard deviations of the differences between Δ sleep times and Δ sleep durations and respective probabilities of a Type I error (p values) are listed in Table 2.
Table 2.
Differences (Δ)in sleep duration and sleep times [means ± standard deviation (SD)] between Sunday evening and Thursday evening for those wearing orange glasses and for controls.
| Orange Glasses | Δ Sleep Time (minutes ± SD) |
Δ Duration (minutes ± SD) |
|---|---|---|
| NO | 3.7 (61) | −6.6 (64) |
| YES | 8.9 (54) | −12.3 (57) |
| p value | 0.42 | 0.42 |
3.4 Subjective Scales
Naturally, individuals can vary considerably in terms of their introspective levels of affect (PANAS) and depression (CES-D). To minimize potentially high variability among individuals on these scales, the differences CES-D (Δ CES-D), PANAS positive affect (ΔPANASPos), and PANAS negative affect (ΔPANASNeg)values from those obtained during the initial screening to those obtained at the end of the experiment were compared for both groups. Unpaired one-tailed Student’s t-tests showed no significant difference for these difference measures between the two groups. The means ± standard deviations of the difference measures and the respective p values are listed in Table 3.
Table 3.
Means and standard deviations (SD) for changes in self-report values from those obtained during initial screening and those obtained at the end of the experiment (February 2009). A positive number for ΔCES-D and ΔPANASPos suggest an improvement in score after the experiment while a positive number for ΔPANASNeg suggests that scores got worse for this measure after the experiment.
| Orange Glasses |
ΔCES-D | ΔPANASPos | ΔPANASNeg |
|---|---|---|---|
| NO | 0.08 (5.7) | 1.2 (7.1) | 2.9 (4.0) |
| YES | 1.8 (3.8) | 4.9 (11.4) | 5.9 (5.4) |
| p value | 0.2 | 0.18 | 0.07 |
3.5 Performance Tests
The PVT software automatically calculates a score, called “throughput” (Tput) for each performance measure, SRT-Tput, FCRT-Tput and MTS-Tput, based upon an accuracy/speed ratio. For a given trial, the numerator in every Tput score is either 1 (correct) or 0 (miss); the denominator is the time, in minutes, between the onset of the target on the PDA screen until the subject taps the screen with the stylus or 1 (minute) if the subject does not tap the PDA screen.44 A few participants did not complete the daily tests, so data analyses were based on 20 participants who completed the tests daily (11 with orange glasses and 9 controls). Again, to minimize individual differences and the potential effect of the orange glasses increasing absolute response times, the differences in morning performance scores from Day 1 to Day 5 were calculated ΔSRT-Tput ΔFCRT-Tput and ΔMTS-Tput. A negative ΔTput value indicates that performance was higher on Day 5 than on Day 1. Unpaired one-tailed Student’s t-tests were conducted for each ΔTput measure; there were no significant differences between groups. The average ± standard deviations of the ΔTput values and their respective p values are listed in Table 4.
Table 4.
Means and standard deviations (SD) for changes in performance (ΔTput scores) from those obtained on Day 1 (Monday morning) and those obtained on Day 5 (Friday morning). A negative value suggests an improvement in Tput score on Day 5 compared to Day 1.
| Orange Glasses |
ΔSRT-Tput | ΔFCRT-Tput | ΔMTS-Tput |
|---|---|---|---|
| NO | −43.6 (38) | −10 (18) | −4.8 (20) |
| YES | −22.8 (34) | 2.7 (16) | −2.1 (16) |
| p value | 0.1 | 0.05 | 0.34 |
4. Discussion
In the present, between-subjects study, the orange glasses limited circadian light exposure in the morning and during school hours, as measured by the Daysimeter, and participants wearing the orange glasses had a reliably later DLMO relative to the control group. At the start of the experiment, the two groups of participants did not differ in terms of their reported chronotypes (all participants reported being in the normal range) and reported bedtimes, both measures obtained from the MCTQ. They also did not differ in terms of their self-reported sleep times and durations on the Sunday evening before the school week started. Therefore, it seems reasonable to conclude that the difference in average DLMO for the two groups was likely caused by the orange glasses intervention, not by inherent group differences. Moreover, the findings from the present study are consistent with those obtained earlier by Figueiro and Rea.25 As in the previous study by Figueiro and Rea,25 where there was a clear differential effect of orange glasses using a within-subjects experimental protocol, the group with orange glasses in the present experiment received less light in the phase advance portion of the PRC (i.e., morning and during school hours) relative to the control group, as shown in Figure 4. Additionally, like the previous study, the differential effects of circadian light exposure in the present study resulted in a statistically significant difference in DLMO, a difference that was the same in terms of both direction and magnitude (i.e., a delay in DLMO of approximately 30 minutes).
Although the difference in DLMO between the two groups was likely due to the orange glasses intervention, sleep times, sleep durations, short-term performance scores and mood measures were not differentially affected by the intervention relative to the control group. The potential effects of the orange glasses intervention on mood, performance and sleep times and duration were probably blunted by extraneous, group-specific variables. It is always harder to measure the effects of an intervention in between-subjects protocols,48 particularly with regard to complex outcome measures such as mood, task performance and self-report sleep measures. In fact, as the literature discussed in the introduction attests, it has been impossible up to this point to find causal links between daylight exposure in schools and relevant outcome measures like mood and scholastic performance. However, as also outlined in the introduction, one imperative step to establish such links is to actually measure the relevant stimulus for the hypothesized underlying mechanism.
Like the recently conducted studies by Figueiro and Rea,25, 26 the relevant light exposures for the human circadian system were measured in the present experiment, so the effects of the orange glasses intervention are more readily interpreted. As measured, the orange glasses intervention reduced circadian light exposure during the advancing portion of the PRC, and this reduction in morning circadian light exposures was, as hypothesized, associated with a reliable difference in DLMO for the two groups. In terms of validation, both the direction and magnitude of this difference is consistent with the delay in DLMO following the orange glasses intervention in the previous within-subjects study.25 Unfortunately, this relationship between a reduced circadian light exposure in the morning at school and a difference in circadian timing could not be reliably linked to differences in performance, mood or self-report sleep measures in the present study. Therefore, while support for a causal link between daylight exposure in schools and circadian timing can be found, both from theory49 and from empirical field studies,25, 26 supporting evidence for a further link to scholastic performance and well-being cannot be made, most likely because of undocumented, extraneous variables that are inevitably part of normal life and, indeed, a part of any field study (e.g.,6, 12, 13, 50, 51). To firmly establish the causal link between daylight exposures in schools to student scholastic performance and well-being, it remains for future studies to either increase sample size or reduce variance due to extraneous variables. It would seem, nevertheless, that the most fruitful approaches for establishing this link will be ones based upon testing hypotheses related to light exposures as they affect the human circadian system.
Acknowledgements
The authors would like to acknowledge the U.S. Green Building Council (USGBC) for sponsoring this research. Support for the work presented here was also given by the Trans-NIH Genes, Environment and Health Initiative Grant U01 DA023822, and the Office of Naval Research (ONR). The authors would also like to thank Dr. Mary Carskadon and Dr. Stephanie Crowley of Brown University and Bradley Hospital for helping with the DLMO calculations. Dr. Christopher Steele (ONR) is also acknowledged for lending the PDAs to the study. Andrew Bierman, Dennis Guyon, Ranjith Kartha, Christine Kingery, Terry Klein, Karen Kubarek, Natalia Lesniak, Dan Wang, and Brittany Woodof the Lighting Research Center and Kathleen Ackerbauer of Russell Sage College are acknowledged for their contributions to this project. We would also like to thank the staff, teachers, and Principal of Smith Middle School for making this project possible. And, finally, we would like to thank the students and parents who participated in this research project.
References
- 1.Boyce PR. Human factors in lighting. 2nd ed. London, New York: Taylor & Francis; 2003. [Google Scholar]
- 2.Cuttle C. Proceedings of the People and Physical Environment Research Conference. Wellington, New Zealand: 1983. People and windows in workplaces. [Google Scholar]
- 3.Hopkinson RG, Kay JD. The Lighting of Buildings. New York, Washington DC: Frederick A. Praeger; 1969. [Google Scholar]
- 4.Heerwagen J, Heerwagen D. Lighting and psychological comfort. Lighting Design and Application. 1986;6:47–51. [Google Scholar]
- 5.Leslie RP. Capturing the daylight dividend in buildings: why and how? Building and Environment. 2003;38:381–385. [Google Scholar]
- 6.Heschong L, Wright RL, Okura S. Daylight impacts on human performance in schools. Journal of the Illuminating Engineering Society of North America. 2002;31:101–114. [Google Scholar]
- 7.Hedge A. Reactions of computer users to three different lighting systems in windowed and windowless offices. Work with Display Units. Milan, Italy. 1994 Oct 2;5:B54–B56. [Google Scholar]
- 8.Kuller R, Lindstren C. Health and behaviour of children in classrooms with and without windows. Journal of Environmental Psychology. 1992;12:305–317. [Google Scholar]
- 9.Ulrich R. View through window may influence recovery from surgery. Science. 1983;224:420–421. doi: 10.1126/science.6143402. [DOI] [PubMed] [Google Scholar]
- 10.Stone N, Irvine J. Performance, mood, satisfaction and task type in various work environments: A preliminary study. Journal of General Psychology. 1991;120:489–497. doi: 10.1080/00221309.1993.9711162. [DOI] [PubMed] [Google Scholar]
- 11.Puleo SB, Leslie RP. Some Effects of the Sequential Experience of Windows on Human Response. Journal of Illuminating Engineering Society of North America. 1991;20(1):91–99. [Google Scholar]
- 12.Heschong L. Windows and classrooms: A study of student performance and the indoor environment. Technical Report to CEC PIER. 2003 Oct; Available at: http://www.energy.ca.gov/pier/project_reports/500-03-082.html.
- 13.Figueiro MG, Rea MS, Rea AC, Stevens RG. Proceedings of the teaming for efficiency: 2002; ACEEE summer study on energy efficiency in buildings. Washington, DC: American Council for an Energy-Efficient Economy; 2002. Daylight and productivity: A field study. [Google Scholar]
- 14.Boyce P, Hunter C, Howlett O. The benefits of daylight through windows. Capturing the Daylight Dividend. Troy, NY: Rensselaer Polytechnic Institute; 2003. Available at: http://www.lrc.rpi.edu/programs/daylighting/pdf/DaylightBenefits.pdf. [Google Scholar]
- 15.Rea M, Deng L, Wolsey R. Lighting Answers: Light Sources and Color. Troy, NY: Rensselaer Polytechnic Institute; National Lighting Product Information Program; 2004. Available at: http://www.lrc.rpi.edu/programs/nlpip/lightinganswers/lightsources/abstract.asp. [Google Scholar]
- 16.Kellert S, Wilson EO. The Biophilia Hypothesis. Washington DC: Island Press/Shearwater Books: 1993. [Google Scholar]
- 17.White R, Heerwagen J. Nature and mental health: Biophilia and biophobia. In: Lundberg A, Erlbaum L, editors. The Environment and Mental Health: A Guide for Clinicians. Mahwah, NJ: 1998. [Google Scholar]
- 18.Rea M, Deng L, Wolsey R. Lighting Answers: Full-Spectrum Light Sources. Troy, NY: Rensselaer Polytechnic Institute; National Lighting Product Information Program; 2003. Available at: http://www.lrc.rpi.edu/programs/nlpip/lightingAnswers/fullSpectrum/abstract.asp. [Google Scholar]
- 19.Leslie RP. Capturing the daylight dividend in buildings: Why and how? Building and Environment. 2003;38:381–385. [Google Scholar]
- 20.Moore R. Circadian Rhythms: Basic neurobiology and clinical applications. Annu. Rev. Med. 1997;48:253–266. doi: 10.1146/annurev.med.48.1.253. [DOI] [PubMed] [Google Scholar]
- 21.Refinetti R. Circadian Physiology. Boca Raton, London, New York: CRC Taylor & Francis; 2006. [Google Scholar]
- 22.Rea MS, Figueiro MG, Bullough JD, Bierman A. A model of phototransduction by the human circadian system. Brain Research Reviews. 2006;50:213–228. doi: 10.1016/j.brainresrev.2005.07.002. [DOI] [PubMed] [Google Scholar]
- 23.Khalsa SB, Jewett ME, Cajochen C, Czeisler CA. A phase response curve to single bright light pulses in human subjects. J Physiol. 2003;549(Pt 3):945–952. doi: 10.1113/jphysiol.2003.040477. Epub 2003 Apr 25. [DOI] [PMC free article] [PubMed] [Google Scholar]
- 24.Bierman A, Klein T, Rea M. The Daysimeter: A device for measuring optical radiation as a stimulus for the human circadian system. Measurement Science and Technology. 2005;16:2292–2299. [Google Scholar]
- 25.Figueiro MG, Rea MS. Lack of short-wavelength light during the school day delays dim light melatonin onset (DLMO) in middle school students. NeuroEndocrinology Letters. 2010a;31(1):92–96. [PMC free article] [PubMed] [Google Scholar]
- 26.Figueiro MG, Rea MS. Evening daylight may cause adolescents to sleep less in spring than in winter. Chronobiol. Int. Forthcoming. 2010b doi: 10.3109/07420528.2010.487965. [DOI] [PMC free article] [PubMed] [Google Scholar]
- 27.Boyce PR. Reviews of technical reports on daylight and productivity. Report submitted to Capturing the Daylight Dividends Program. Troy, NY: Lighting Research Center; 2004. [Google Scholar]
- 28.National Academy of Sciences. Green Schools: Attributes for Health and Learning. Washington, DC: The National Academies Press; 2006. [Google Scholar]
- 29.Portaluppi F, Touitou Y, Smolensky MH. Ethical and methodological standards for laboratory and medical biological rhythm research. Chronobiol Int. 2008;25(6):999–1016. doi: 10.1080/07420520802544530. [DOI] [PubMed] [Google Scholar]
- 30.Achenbach TM, Rescorla LA. Manual for ASEBA School-Age Forms & Profiles, University of Vermont Research Center for Children Youth, & Families, Burlington, VT, The Achenbach System of Empirically Based Assessment (ASEBA) 2001. [Google Scholar]
- 31.Cohen SK, Kamarck T, Mermelstein R. A global measure of perceived stress. J. Health Soc. Behav. 1983;24(4):385–396. [PubMed] [Google Scholar]
- 32.Watson D, Clark LA, Tellegen A. Development and validation of brief measures of positive and negative affect: The PANAS scale. J. Pers. Soc. Psychol. 1988;54:1063–1070. doi: 10.1037//0022-3514.54.6.1063. [DOI] [PubMed] [Google Scholar]
- 33.Roenneberg T, Wirz-Justice A, Merrow M. Life between clocks: daily temporal patterns of human chronotypes. J. Biol. Rhythms. 2003;18(1):80–90. doi: 10.1177/0748730402239679. [DOI] [PubMed] [Google Scholar]
- 34.Radloff LS. The CES-D scale: A self-report depression scale for research in the general population. Appl. Psychol. Measure. 1977;1:385–401. [Google Scholar]
- 35.Laurent J, Ettelson R. An examination of the tripartite model of anxiety and depression and its application to youth. Clinical Child and Family Psychology Review. 2001;4(3):209–230. doi: 10.1023/a:1017547014504. [DOI] [PubMed] [Google Scholar]
- 36.Radloff LS. The use of the the Center for Epidemiologic Studies depression scale in adolescents and young adults. 1991;20(20):149–166. doi: 10.1007/BF01537606. [DOI] [PubMed] [Google Scholar]
- 37.Roenneberg T, Kuehnle T, Juda M, Kantermann T, Allebrandt K, Gordijn M, Merrow M. Epidemiology of the human circadian clock. Sleep Medicine Reviews. 2007;11:429–438. doi: 10.1016/j.smrv.2007.07.005. [DOI] [PubMed] [Google Scholar]
- 38.Lukens E, Puig-Antich J, Behn J, Goetz R, Tabrizi M, Davies M. Reliability of the psychosocial schedule for school age children. Journal of the American Academy of Child Psychiatry. 1983;22(1):29–39. doi: 10.1097/00004583-198301000-00005. [DOI] [PubMed] [Google Scholar]
- 39.Lighting Research Center. Daylight Dividends case study: Smith Middle School, NC. Troy, NY: Rensselaer Polytechnic Institute; 2004. [Google Scholar]
- 40.Rea MS, Figueiro MG, Bierman A, Bullough JD. Circadian light. J Circadian Rhythms. 2010;8:2. doi: 10.1186/1740-3391-8-2. [DOI] [PMC free article] [PubMed] [Google Scholar]
- 41.Miller D, Bierman A, Figueiro MG, Schernhammer E, Rea MS. Ecological measurements of light exposure, activity, and circadian disruption in real-world environments. Lighting Research and Technology. doi: 10.1177/1477153510367977. Forthcoming in 2010. [DOI] [PMC free article] [PubMed] [Google Scholar]
- 42.Arendt J. Melatonin and the Mammalian Pineal Gland. Springer Us; 1994. [Google Scholar]
- 43.Benloucif S, Burgess HJ, Klerman EB, Lewy AJ, Middleton B, Murphy PJ, Parry BL, Revell VL. Measuring melatonin in humans. J Clin Sleep Med. 2008;4(1):66–69. [PMC free article] [PubMed] [Google Scholar]
- 44.Thorne DR, Johnson DE, Redmond DP, Sing HC, Belenky G, Shapiro JM. The Walter Reed palm-held psychomotor vigilance test. Behav Res Methods. 2005;37(1):111–118. doi: 10.3758/bf03206404. [DOI] [PubMed] [Google Scholar]
- 45.Lennie P, Pokorny J, Smith VC. Luminance. J. Opt. Soc. Am. A. 1993;10:1283–1293. doi: 10.1364/josaa.10.001283. [DOI] [PubMed] [Google Scholar]
- 46.He Y, Rea MS, Bierman A, Bullough J. Evaluating light source efficacy under mesopic conditions using reaction times. J. Illum. Eng. Soc. 1997;26:125–138. [Google Scholar]
- 47.Rea MS, Ouellette MJ. Relative visual performance: A basis for application. Light Res Technol. 1991;23(3):135–144. [Google Scholar]
- 48.Rea MS. Toward a model of visual performance: A review of methodologies. Journal of the Illuminating Engineering Society. 1987;16(1):128–142. [Google Scholar]
- 49.Wolfson AR, Carskadon MA. Understanding adolescents' sleep patterns and school performance: a critical appraisal. Sleep Med. Rev. 2003;7(6):491–506. doi: 10.1016/s1087-0792(03)90003-7. [DOI] [PubMed] [Google Scholar]
- 50.Eliasson A, Eliasson A, Joseph King, Gould B, Eliasson A. Association of sleep and academic performance. Sleep and Breathing. 2002;6(10):45–48. doi: 10.1007/s11325-002-0045-9. [DOI] [PubMed] [Google Scholar]
- 51.Norris D, Tillet L. Daylight and productivity: Is there a causal link?; Presented at the 5th International Conference on Architectural and Automotive Glass, Session 3, Tampere, Finland, September 13-15, 1997; pp. 213–217. [Google Scholar]