

Abstract
Circadian rhythms are biological rhythms that repeat at approximately 24 hours. In humans, circadian rhythms have an average period of 24.2 hours. The 24-hour patterns of light and dark on the retina synchronize circadian rhythms to the local time on earth. Lighting characteristics affecting circadian rhythms are very different than those affecting visual responses. Lack of synchronization between the endogenous clock and the local time has been associated with a host of maladies. Therefore, it is important to measure circadian light exposures over the course of the 24-hour day and to be able to assess circadian entrainment and disruption in actual living environments. Presented is an overview of the recently developed Daysimeter, a personal measurement device for recording activity and circadian light-exposure. When the Daysimeter is worn on the head, two light sensors near the eye are used to estimate circadian light (CLA) exposures over extended periods of time. Phasor analysis combines the measured periodic activity-rest patterns with the measured periodic light-dark patterns to assess behavioural circadian entrainment/disruption. As shown, day-shift and rotating-shift nurses exhibit remarkably different levels of behavioural circadian entrainment/disruption. These new ecological measurement and analysis techniques may provide important insights into the relationship between circadian disruption and well-being.
Keywords: Circadian rhythms, phasor analysis, circadian disruption, Daysimeter, circadian light, phototransduction
2. INTRODUCTION
Biological rhythms that repeat at approximately every 24 hours are called circadian rhythms. In mammals, these rhythms are generated and regulated by a master clock, the suprachiasmatic nuclei (SCN) located in the hypothalamus in the brain. The synchronization of the endogenous master clock to local time on earth is governed by a robust and regular 24-hour pattern of light and dark on the retina. If the light-dark pattern is not above threshold, or if its period is something other than 24-hours, human biology is disrupted, from single cells to overt behaviour.1,2 Circadian disruption can manifest itself in poor sleep, indigestion, and reduced attention and performance.3,4,5 Over time this disruption can lead to serious maladies such as cardiovascular disease,6 diabetes and obesity,7 and cancer.8,9,10 Despite the plethora of animal and epidemiological research demonstrating the negative impact of circadian disruption on health, surprisingly little is known about the levels of circadian disruption actually experienced by people in different types of living conditions and environments.
This paper describes a measurement tool for collecting ecological data on circadian light-dark stimuli and rest-activity behaviour along with methods of analyzing such data so that circadian entrainment and disruption can be assessed. Results of using such techniques to study a cohort of nurses engaged in both day-and rotating-shift work is also presented.
3. INSTRUMENTATION
The Daysimeter was developed as a personal circadian light exposure and activity meter to measure circadian light-dark and activity-rest patterns in the field.11 It was necessary to develop a sophisticated, small photometer calibrated in terms of the spectral and absolute sensitivities of the human circadian system as well as its spatial response. Since light must be incident on the retina to be effective, the Daysimeter had to be designed to place the light sensors near the plane of one cornea. Extending from a number of basic studies on circadian phototransduction,12,13,14 and physiological optics,15 a model was developed for human circadian phototransduction,16 and this model forms the basis of the Daysimeter's photometric response characteristics. To measure activity, the Daysimeter incorporates accelerometers that respond to head movements and orientation with respect to earth's gravitational field. Activity and light are measured together at regular time intervals and electronically stored. In addition, the Daysimeter logs its operating temperature. Using practical power management techniques, the Daysimeter can gather light, activity and temperature data for up to 30 days for subsequent analysis.
Two calibrated photosensors are employed to measure optical radiation in close proximity to the cornea. Based upon the spatial sensitivity model of the retina developed by Van Derlofske et al.,15 both sensors have a nearly cosine spatial response, meaning that the sensors are most sensitive to light at normal incidence with sensitivity at other angles decreasing proportional to the cosine of the incident angle. One sensor (photopic) is a conventional glass-filtered silicon photodiode (Hamamatsu model S2386-YYK, custom glass filter) having a spectral sensitivity (Figure 1) closely matching the standard photopic luminous efficiency function, V(λ).17 Spectral mismatch errors of the photopic channel for the light sources in Figure 2 are less than 2% except for the 470 nm LED which has a photopic spectral mismatch error of 8%. The other sensor is a short-wavelength (blue) sensor fabricated from a gallium arsenide phosphide (GaAsP) photodiode (Hamamatsu model GA5645), having an intrinsic long-wavelength response cut-off at approximately 580 nm, together with a UV blocking glass filter (Schott GG395). This blue sensor has a spectral response peaking at approximately 460 nm with an 80 nm full-width-half-maximum (FWHM) bandpass (Figure 1). A burst of 10 readings over 16.7 ms is acquired and summed once per second for each sensor. The average of these sums is recorded at 30-second intervals for later retrieval.
Figure 1.

The spectral response of the two photosensors on the Daysimeter, photopic and blue, plotted in terms of efficacy (lumens per watt) for the photopic sensor and a corresponding efficacy (blue lumens per watt) of the blue sensor. The efficacy of the blue sensor was scaled so that the integrated response to CIE Illuminate A (2856 K blackbody radiator) equals that of the photopic sensor. The readings from the blue and photopic sensors, B and P respectively, for any light source irradiance, S(λ), are given by the integral equations below the graph. Equations for approximating CLA from these two sensor readings are also provided.
Figure 2.
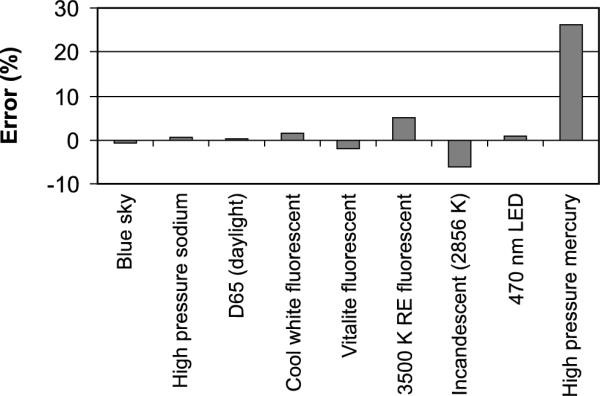
Errors in estimating a fixed level of circadian stimulus (1000 CLA) from the model of circadian phototransduction by Rea et al.16 generated by several common light sources using the algorithms applied to the two-sensor data acquired by the Daysimeter. D65: daylight 6500 K; RE: rare earth phosphor; nm: nanometre.
Once the optical radiation data obtained by the Daysimeter from both sensors are downloaded to a computer, “circadian light” levels can be approximated using post-processing algorithms based upon the model of circadian phototransduction by Rea et al.16 The values of circadian light levels are scaled so that 1000 lux of CIE Illuminant A (an incandescent blackbody radiator at 2856 K) is equivalent to 1000 circadian light units (CLA). Four spectral sensitivity functions are used in the model: the scotopic luminous efficiency function, V'(λ),17 based on rod sensitivity, V10(λ) based upon the S, M and L cone fundamentals,18 the S-cone fundamental,19 and a standard photo-opsin emulating melanopsin contained within the intrinsically photosensitive retinal ganglion cell (ipRGC12) and having a peak spectral response at 480 nm and a FWHM of 95 nm. Briefly, in the model the cone fundamentals form a spectrally opponent (blue vs. yellow20) input to the ipRGC which sends circadian light signals to the SCN. The modelled rod response suppresses output from the ipRGC when the blue-yellow opponent signal is positive, with diminishing suppression at higher irradiance levels as rods become more fully bleached. A negative blue-yellow opponent signal, however, produces a response determined solely by the ipRGC (no cone input and no rod suppression). The Daysimeter system uses its two channels to approximate the four photoreceptor channel inputs in the model according to the equations shown in Figure 1. Discrepancies were minimized between the two-channel estimates and the four-channel model calculation of CLA for the first seven light sources listed in Figure 2 using a conventional least-squares technique to arrive at the coefficients for weighting the blue and photopic readings; thus CLA is approximated using the two-sensor inputs from the Daysimeter. The results of this approximation are shown in Figure 2 for several light sources.
The human circadian system response to light (CLA), as measured by acute nocturnal melatonin suppression,21 follows a logistic function.22 This response function is used to transform the CLA values into circadian stimulus (CS) values. Values of CS correspond to acute melatonin suppression under the following conditions: one-hour exposure; minimal pupil size (2.3 mm diameter); and occurring near the midpoint of melatonin production. CS is considered to be a better measure of the effectiveness of the light stimulus for the human circadian system than CLA because it is defined in terms of the circadian system's input-output relationship, including both threshold and saturation.
The Daysimeter model used in the present study had two orthogonally oriented accelerometers contained within a single electronic sensor package (Analog Devices, model number ADXL330) and mounted on the Daysimeter's circuit board. The outputs of the sensor package are voltages that are proportional to the instantaneous acceleration of each accelerometer. These voltages are converted to digital values using the 12-bit analogue-to-digital converter of the microprocessor (Texas Instruments MSP430F169) that controls operation of the Daysimeter. The digital data are acquired once per second, and then used to calculate an activity index every 30 s using the following equation:
| (EQ 1) |
where SSx and SSy are the sums of the squared deviations from the mean digital value for each accelerometer (x and y) over the 30-second logging interval, n is the number of samples (30), and k is a calibration factor converting the measured output voltage of the accelerometers in arbitrary analogue-to-digital converter counts to units of g-force (1 g-force = 9.8 m/s2). In other words, the activity index is the root-mean-square (rms) deviation in acceleration in two dimensions measured for every 30-second logging interval.
4. ANALYSIS METHODS
Phasor analysis, a technique based on signal processing techniques,23 makes it possible to interpret the light and activity data, sampled together over consecutive multiple days (usually seven days for the data presented here), in terms of the phase and magnitude of the joint 24-hour patterns. The correlations between the periodic changes in light and in activity are first determined by calculating the circular correlation function of the light and activity time series. The circular correlation function reveals how the correlation (r, not r2) between light and activity changes as a function of the timing difference, or phase between them (Figure 3). It is described as circular because for this analysis the data are represented as an infinitely repeating sequence of the collected data, thereby enabling one data series to be time shifted by any amount relative to the other, from minutes to days. The circular correlation function is then decomposed into its temporal frequencies and phase angles using Fourier analysis techniques, from which the 24-hour frequency component is selected as a measure of circadian rhythmicity. The 24-hour phasor magnitude is used as the metric for behavioural circadian entrainment/disruption; the greater the magnitude, the greater the level of behavioural circadian entrainment of activity to light. The phasor angle reflects the phase relationship between the periodic light-dark exposure pattern and the periodic activity-rest pattern in the correlations (Figure 3). Figure 3 shows examples of the circular correlation functions and associated phasors for two nurses, a day-shift nurse and a rotating-shift nurse, as well as for two nocturnal rodents, one exposed to a regular pattern of 12 hours light and 12 hours dark (12L:12D) and one exposed to a simulated “jet lag” pattern (discussed later in the text).
Figure 3.

Circular correlation functions and associated phasors for two nurses, one day-shift and one rotating-shift, and for two nocturnal rodents, a rat exposed to a regular pattern of 12 hours of light and 12 hours of darkness (12L:12D) and a rat exposed to a “jet lag” pattern of light and dark (the 12L:12D pattern was reversed every 48 hours).
In Figure 3, the circular correlation functions for the entrained human and rodent display very pronounced, high amplitude, sine wave shapes with a period of one day. For the human, the correlation peaks occur at approximately integer days (0, 1, 2, etc.), while for the rodent the peaks occur at approximately half days (0.5, 1.5, 2.5, etc.). The phasor diagrams below the graphs represent the 24-hour sine wave component of the circular correlation function by a vector with magnitude equalling the amplitude of the 24-hour Fourier component and the angle representing the phase relationship between light and activity. Since the phase difference between human and rodent is almost exactly 0.5 day, the phasors are approximately 180 degrees apart. For the disrupted human and the disrupted rodent, it is difficult to extract a meaningful 24-hour sine wave Fourier component; therefore, the corresponding phasor magnitudes are very small and the angles are relatively meaningless.
Two techniques of parsing the Daysimeter data can be used for phasor analysis. The “all-at-once” technique computes the circular correlation function of the entire data set (e.g., seven days) in one operation. The resulting circular correlation function provides the correlation coefficients between light and activity for time shifts in activity ranging from zero to the total length of time over which data were collected (usually seven days for the data collected here). Because the circular correlation extends over multiple days, this technique is sensitive to day-to-day variations as well as variations within each day. Fourier analysis applied to the all-at-once circular correlation extracts the magnitude and the angle of the 24-hour component, separating it from the longer, infradian, and shorter, ultradian, variations. If the spectral power in these longer or shorter periods in the circular correlation is large, the magnitude of the 24-hour phasor is reduced. To facilitate Fourier harmonic analysis the time duration, or total length of the data set, is truncated to an integer number of days (usually seven days for the nurse data).
The “sliding-window” technique parses the data into a progression of overlapping 24-hour segments and calculates a circular correlation for every segment. Fourier analysis is applied to each of these circular correlation functions to extract the 24-hour, fundamental component. The resulting 24-hour phasors for each data segment are then averaged (vectorally) to arrive at a phasor representing the entire data collection period. The advantage of the sliding-window technique is that it utilizes all the available data without truncation; therefore, it is better than the all-at-once technique for short collection protocols because it utilizes all of the available data. A limitation of this technique, however, is that there is no ability with the sliding-window technique to identify rhythms slightly longer or shorter than 24 hours. Analyzing seven days of data using the all-at-once technique has a precision of approximately 3.4 hours for resolving the expressed circadian periods in the circular correlations, whereas the sliding-window technique cannot reliably resolve periods up to approximately 12 hours. This higher degree of period resolution with the all-at-once technique will necessarily result in shorter 24-hour phasor magnitudes than those obtained for the same data using the sliding-window phasors unless there is no significant power in the infradian or ultradian rhythms. This difference is most evident with disrupted subjects who do not necessarily show a strong 24-hour rhythm but still exhibit relatively large sliding-window phasor magnitudes. Because the period resolution is worse with the sliding-window technique than with the all-at-once technique, the power of the other non-24-hour periods also contribute to the phasor magnitude.
The activity index values can be used to compute two statistics used by Van Someren et al.24 to estimate the day-to-day consistency of activity over the recording session (interdaily stability, IS) and the hour to hour consistency of activity over the recording session (intradaily variability, IV). High values of IS indicate that the subject's 24-hour activity and rest pattern was consistent over the entire recording session; high values of IV indicate that the subject's pattern of activity and rest was highly fragmented with intermittent and inconsistent intervals of movement and no-movement. Neither statistic accounts for levels of light exposure or changes in light exposure levels.
5. DATA COLLECTION
The Nurses' Health Study II is a prospective cohort study that began in 1989, when 116,671 registered female nurses in the United States between the ages 25 to 42 were enrolled. The study was designed to prospectively examine the effects of oral contraceptive use and other life style factors on chronic diseases, particularly cancers and cardiovascular diseases. Surviving nurses within this cohort were contacted to serve as potential subjects between November 2006 and April 2008; 138 nurses volunteered to participate. The study was approved by the Committees on the Use of Human Subjects in Research at the Brigham and Women's Hospital and the Harvard School of Public Health, as well as Rensselaer's Institute Review Board; written informed consent was obtained from each participant.
Reported here are results from Daysimeter measurements for 38 day-shift and 61 rotating-shift nurses; the rotating-shift nurses worked from one to five nights over the recording period. For 16 other nurses in the study who were categorized as rotating-shift, the Daysimeter data indicated that they did not work any nights during the study period, so their data are not included. The larger number of rotating-shift nurses reflects the initial assumption that day-shift nurses would be more homogenous with respect to circadian entrainment than the rotating-shift nurses. Data from 23 of the 138 nurses were unusable due to recording irregularities or non-compliance with the seven-day protocol. It was possible to identify data from those nurses who did not comply with the protocol by using the data from the Daysimeter's on-board temperature sensor; room-temperature readings, as opposed to elevated temperatures when the Daysimeter is in close contact with the body, and extended periods of inactivity were certain signs that the nurse did not wear the device when required. Visual inspection of the temperature and activity data plotted against time was used to identify noncompliance. Only those protocol departures lasting about a day or more could be unambiguously identified and were removed. The data from 13 of the remaining 99 nurses showed non-compliance during only one to three days of the seven-day recording period. For these nurses, only the data for the noncompliant days were removed; 10 nurses provided six days of useful data and three provided five.
6. RESULTS
Table 1 summarizes the results of the measurements. Two-tailed student t-tests revealed that, on average, day-shift nurses were exposed to statistically higher levels of light (both photopic and CLA) than rotating-shift nurses during the recording sessions. It is interesting to note, however, that the ratio of the average photopic light level to the average circadian light level is similar for both day-shift and rotating-shift nurses. This suggests that the types of light sources, natural and electric, seen by both groups were not remarkably different for both groups. Interesting too, the average activity levels of the two groups were nearly identical. The phasor analysis of the continuous light and activity data provided by the Daysimeter indicated that the synchronization between the light-dark exposures and the activity-rest behaviour was much greater for the day-shift nurses than for the rotating-shift nurses based upon the highly significant difference between the two groups in terms of their respective phasor magnitudes determined using either the sliding-window or the all-at-once techniques. There was no difference between the two groups in terms of their phasor angles using the sliding-window technique, but there was a significant difference between the phasor angles of the two groups using the all-at-once technique. Following the earlier discussion, the all-at-once technique is much more sensitive to consistency in the light and activity patterns over the entire recording period than the sliding-window technique. Thus, there is a much larger difference between the two groups in terms of their phasor angles using the all-at-once technique.
Table 1.
Mean values shown; standard deviation values in [brackets].
| Photopic light (lux) | Circadian light (CLA) | Activity Index (Δg-forcerms) | Interdaily Stability (IS) | Intradaily Variability (IV) | Phasors | ||||
|---|---|---|---|---|---|---|---|---|---|
| Sliding-window | All-at-once | ||||||||
| Magnitude | Angle (hours) | Magnitude | Angle (hours) | ||||||
| Day-shift (N=38) | 302 [188] | 369 [227] | 0.0094 [0.0014] | 0.692 [0.144] | 0.447 [0.170] | 0.50 [0.11] | 0.65 [0.74] | 0.46 [0.12] | 0.68 [0.71] |
| Rotating-shift (N=61) | 188 [152] | 209 [166] | 0.0097 [0.0018] | 0.252 [0.129] | 0.458 [0.135] | 0.33 [0.10] | 0.64 [0.73] | 0.12 [0.10] | 2.3 [3.2] |
| t-test p-value (two-tail) | <0.01 | <0.001 | 0.26 | <0.001 | 0.72 | <0.001 | 0.94 | <0.001 | <0.001 |
Photopic light exposures: The Daysimeter system utilizes a fully calibrated (spectral, spatial, intensity) photopic light sensor measuring in lux (lm/m2). Group means [standard deviation] are computed from individual subject means of each subject's entire recording session.
Circadian light exposures: Using the model from Rea et al.,16 circadian light exposure values are determined from the photopic and blue sensor data measured in CLA. Group means [standard deviation] are computed from individual subject means of each subject's entire recording session.
Activity index: Values from two orthogonally oriented accelerometers (measuring up/down and forward/back head motions) are used to compute an activity index that is logged at regular time intervals along with the light readings. Each logged measure of activity is the rms combination of the standard deviation of acceleration taken once per second over a 30-second interval of both accelerometers. Group means [standard deviation] are computed from individual subject means of each subject's entire recording session.
Interdaily stability: The IS statistic developed by Van Someren et al.24 measures the consistency of activity among days and ranges from 0 to 1. A value of 1 results when every day's activity is identically to the other days, while conversely a value of 0 results from no similarity among days.
Intradaily variability: The IV statistic developed by Van Someren et al.24 measures the fragmentation of rest and activity based on a scale from 0 (no variability from hour to hour) to upwards of 2. A larger value indicates more fragmentation of rest and activity, or conversely, less consolidation of rest/activity patterns.
Phasor magnitude: A correlation between light exposure (CS) and activity (calculated using either the sliding-window or the all-at-once technique) for the observation period, in this case 5–7 days. A higher magnitude indicates the subject has a consistent, 24-hour schedule with respect to activity and light. Lower magnitudes indicate low correlation between daily cycles of light and activity irrespective of phase differences.
Phasor angle: A phase relationship between light exposure (CS) and activity (calculated using either the sliding-window or the all-at-once technique) for the observation period, in this case 5–7 days. A positive angle (first quadrant) indicates a delay in activity with respect to light and a negative angle (fourth quadrant) indicates an advance in activity with respect to light for diurnal species.
Figure 4 illustrates on polar coordinates the average phasors for both groups using both techniques, sliding-window and all-at-once. For diurnal species the phasors typically plot in the first and fourth quadrants (following standard convention, quadrants are numbered counter-clockwise starting with the upper right quadrant), indicating activity and light exposure are positively correlated. Phasor angles for humans are almost always in the first quadrant, indicating that activity is delayed with respect to light exposure, typically because people become active with the bright, morning light but continue to be active after sunset under dim, electric light; see later discussion on this point.
Figure 4.
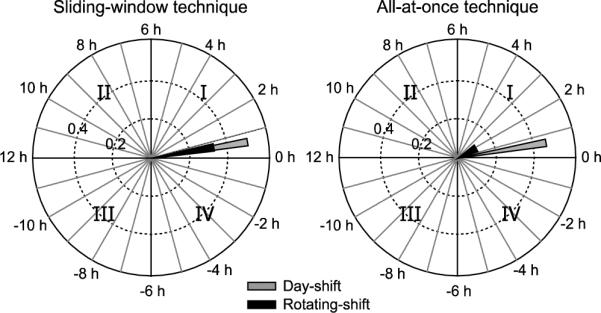
Average phasors for day-shift and for rotating-shift nurses using the sliding-window (left) and all-at-once (right) techniques. See text for discussion of the two methods.
Figure 5 shows the distribution of the phasor magnitudes for the two groups of nurses on a linear scale, but broken down in terms of the number of night-shifts they worked during the recording period. Obviously the day-shift nurses did not work any nights; two rotating-shift nurses worked five nights. Figure 5 shows that, in general, as the number of working nights increase, phasor magnitudes decrease. This suggests that behavioural circadian disruption increases with the number of nights worked. It should be noted, however, that one of the two nurses who worked five nights had a higher phasor magnitude than all those working three or four nights and most working two nights, and that the highest average circadian disruption was for nurses working three night shifts during the week. This suggests that disruption might be less for people who continually work the night shift compared to those who do so intermittently, but, of course, there are too few samples to reach any reliable conclusions concerning the health of these nurses. It should also be noted that, although day-shift nurses generally had larger phasor magnitudes than rotating-shift nurses, they still exhibited a wide range of phasor magnitudes and some day-shift nurses had smaller phasor magnitudes than those found in rotating-shift nurses.
Figure 5.

All-at-once phasor magnitudes for day-shift and rotating-shift nurses plotted as a function of the number of nights worked.
Figure 6 compares the sliding-window and the all-at-once techniques for computing phasor magnitudes for the day-shift and rotating-shift nurses. For the day-shift nurses, either method returns similar results (r2 = 0.91). For the rotating-shift nurses, the similarity is reduced (r2 = 0.18). The most obvious explanation being that the day-shift nurses are on a regular schedule with every day similar to every other day. Since their behaviour conforms to a stable 24-hour pattern both techniques give the similar phasor magnitudes. Rotating-shift nurses, on the other hand, have variable schedules so they do not have stable 24-hour patterns of light and/or of activity. They exhibit a complex variety of rhythm periods, some slightly shorter and some longer than 24 hours. As previously discussed, the sliding-window technique lumps together a broader range of periods in the 24-hour phasor resulting in relatively larger phasor magnitudes than those obtained by the all-at-once technique.
Figure 6.
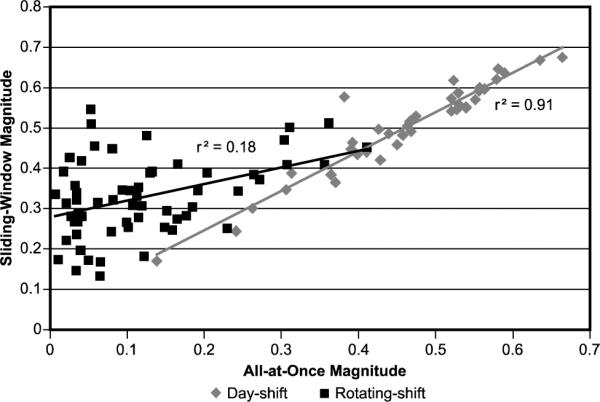
Comparison of phasor magnitudes for the sliding-window and the all-at-once techniques.
Figure 7 is a comparison of the IS statistic and the phasor magnitudes obtained using the sliding-window and the all-at-once techniques. The all-at-once technique yields results that correlate highly with the IS statistic (r2 = 0.94). The IS statistic is inherently based upon an assumed 24-hour activity rhythm, but since it does not depend on light exposures, the high correlation indicates that light exposure maintained a similar pattern with respect to activity throughout the week. The relatively weaker correlation between the IS statistic and the sliding-window phasor magnitude implies that, although light and activity might be highly correlated, the period of oscillation did not conform precisely to a 24-hour period. That is, the 24-hour based IS statistic is low but the sliding-window phasor magnitude is high, relative to the all-at-once phasor magnitude. It is not known at this time which phasor technique is more predictive of health and well-being; must people maintain high regularity across all days (measured with the all-at-once phasor) to be healthy or can people vary behaviour (activity) across days (measured with the sliding-window phasor) without consequences to health and well-being?
Figure 7.
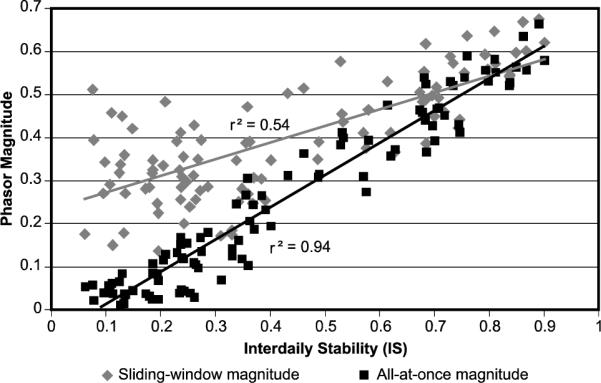
Comparison between the IS statistic based upon activity and the two techniques for determining phasor magnitude based on activity and light exposures.
Figure 8 illustrates sliding-window phasors for four different day-shift nurses paired with their average daily circadian stimulus (CS) and activity profiles. Because average activity and average CS are plotted independent of one another, they are not strictly comparable to the corresponding phasors. Nevertheless, the paired diagrams do help illustrate how activity and CS tend to affect phasor magnitudes and angles. Based upon examinations of a wide range of activity and light exposure profiles from day-shift nurses, the data from nurse A can be considered as “typical.” Generally speaking, a “typical” day-shift person exhibits a delayed phasor angle of between one and two hours with a phasor magnitude between 0.5 and 0.6. “Typical” individuals tend to be consistently active throughout their waking period, but are exposed to relatively higher light levels in the early part of their activity period than toward the end. This asymmetry in relative light exposure from the early to the late part of their activity period, in fact, produces delayed phasor angles in Quadrant I. The phasor angle for the “typical” nurse is nearly the same as that for day-shift nurse B, but the phasor magnitude for nurse B is lower. Comparing the average activity and CS exposure data for the two nurses, it is clear that for both nurses light exposures are lower in the late part of the activity period than in the early part of the activity period, thus leading to their nearly identical phasor angles. It is even clearer that activity is more variable and less well correlated with light exposure for nurse B than for nurse A. This yields a shorter phasor magnitude for nurse B than for nurse A. It is important to point out that the absolute time of activity and CS do not affect the phasor angle or the phasor magnitude. Again, the phasor is based upon the synchronization between activity and CS exposure, not between activity and clock time. Nevertheless, because zeitgebers are closely associated with clock time, such as sunrise, sunset and mealtimes, indirect effects of clock time on phasor magnitude and angle likely exist, thus the high correlation between IS and phasor magnitude for the all-at-once technique. The phasor magnitudes for nurses A and C are nearly identical, the major difference is in their phasor angles. It can be readily appreciated from this figure that nurse C does not exhibit the relative asymmetry in light exposure from the early to the late activity period as is seen with nurse A. Consequently the phasor angle for nurse C is advanced with respect to nurse A to near 0 hours. The average activity and CS exposure data for nurse D are very much like those for nurse C except they are less well correlated, yielding the same phasor angle, but a lower phasor magnitude. Compared to the “typical” nurse A then, nurse D is more variable in her activity and light exposure patterns and does not exhibit the asymmetry of activity from the early to the late parts of her activity period. Of potential interest, nurse D appears to be exposed to high levels of CS toward the end of her activity period relative to any of the other nurses, including the “typical” nurse. Also it should be noted that the period of time with no light and activity (presumably sleep) is less for nurses B and D than for nurses A and C who both have relatively large phasor magnitudes. Again, whether these differences are predictive of health and well-being remains to be studied systematically.
Figure 8.

Average activity and average circadian stimulus (CS) values across a day with corresponding sliding-window phasors for four different day-shift nurses.
7. DISCUSSION
It is becoming clearer that human health and well-being are dependent upon the synchronization of biological systems.25 The master clock in the SCN sets the pace for peripheral systems, but if these complex systems become asynchronous with one another (e.g., following jet lag) we experience poor sleep, indigestion, and performance errors. These, in turn, may lead to problems such as insomnia, diabetes and obesity, and injury from lack of alertness..
Since the pattern of light and dark drives the timing of the master clock, it is obviously important for our evolving understanding of human health that we begin to measure the light-dark cycles actually experienced by individuals in their own living environments as affected by electric lighting and modern day work schedules. The Daysimeter was developed for this purpose. Measuring the light-dark patterns experienced by people in their living environments is important, but those data are not particularly valuable unless it is possible to interpret them in the context of human well-being and health. Phasor analysis was developed to quantify the synchronization of oscillating light-dark patterns and activity-rest patterns, thereby giving an individual-specific measure of behavioural circadian entrainment or disruption. In addition to activity, but not examined here, other measures of circadian regulated processes, such as core body temperature, heart rate, and hormone levels, can be made together with light exposure measurements and then analyzed using the phasor analysis technique described here.
It is also readily possible to relate individual-specific measures of circadian disruption to individual-specific measures of performance, affect and fatigue. It is also theoretically possible to develop individual-specific treatments to correct circadian disruption and measure their efficacy through changes in phasor magnitude and angle as they relate to changes in medically meaningful outcomes. Obviously genetic differences as well as differences in environmental strain must also be considered. In the near future, however, it should be possible, using tools like the Daysimeter and phasor analysis, to begin to bridge ecological measurements of circadian disruption to controlled studies of circadian disruption using animal models for such diseases as cancer, cardiovascular disease, and diabetes.
Recently we were able to show the feasibility of this bridge. Figure 3 shows the circular correlations and associated phasors for a day-shift nurse and a rotating-shift nurse together with the circular correlations and associated phasors for a rat placed on a regular 12L:12D schedule and a rat placed on a regularly reversing (i.e., continuous jet lag) pattern of light and dark. As can readily be appreciated from Figure 3, and despite the differences in two species with regard to their photic niche (i.e., diurnal nurses versus nocturnal rats), it should now be possible to parametrically study the impact of circadian disruption actually experienced by individuals in different living environments with any one of several animal models for human diseases and disorders. These envisioned studies can then serve as the next logical step in understanding the impact of circadian disruption on human health, complementing the pioneering epidemiological studies that raised our collective concern for how circadian disruption might impact human health.8,9
ACKNOWLEDGEMENTS
This work was supported in part by CDC Grant R01 OH008171 to Dr. Eva Schernhammer at Harvard Public Health and by the Trans-NIH Genes, Environment and Health Initiative Grant U01 DA023822 to Dr. Mark Rea at the Lighting Research Center. The authors would like to thank Terry Klein and Dennis Guyon of the Lighting Research Center for their assistance with the study and the manuscript.
11. REFERENCES
- 1.Erren TC, Reiter RJ. Defining chronodisruption. Journal of Pineal Research. 2009;46(3):245–247. doi: 10.1111/j.1600-079X.2009.00665.x. [DOI] [PubMed] [Google Scholar]
- 2.Reppert SM, Weaver DR. Coordination of circadian timing in mammals. Nature. 2002;418:935–941. doi: 10.1038/nature00965. [DOI] [PubMed] [Google Scholar]
- 3.Kohsaka A, Bass J. A sense of time: How molecular clocks organize metabolism. Trends in Endocrinology & Metabolism. 2007;18(1):4–11. doi: 10.1016/j.tem.2006.11.005. [DOI] [PubMed] [Google Scholar]
- 4.Mallis MM, DeRoshia CW. Circadian rhythms, sleep, and performance in space. Aviation, Space, and Environmental Medicine. 2005;76(6 Suppl):B94–107. [PubMed] [Google Scholar]
- 5.Sack RL, Auckley D, Auger RR, Carskadon MA, Wright KP, Jr, Vitiello MV, Zhdanova IV. Circadian rhythm sleep disorders: part II, advanced sleep phase disorder, delayed sleep phase disorder, free-running disorder, and irregular sleep-wake rhythm (an American Academy of Sleep Medicine review) Sleep. 2007;30(11):1484–1501. doi: 10.1093/sleep/30.11.1484. [DOI] [PMC free article] [PubMed] [Google Scholar]
- 6.Young ME, Bray MS. Potential role for peripheral circadian clock dyssynchrony in the pathogenesis of cardiovascular dysfunction. Sleep Medicine. 2007;8(6):656–667. doi: 10.1016/j.sleep.2006.12.010. [DOI] [PMC free article] [PubMed] [Google Scholar]
- 7.Bechtold DA. Energy-responsive timekeeping. Journal of Genetics. 2008;87:447–458. doi: 10.1007/s12041-008-0067-6. [DOI] [PubMed] [Google Scholar]
- 8.Schernhammer ES, Laden F, Speizer FE, Willett WC, Hunter DJ, Kawachi I. Rotating night shifts and risk of breast cancer in women participating in the Nurses' Health Study. Journal of the National Cancer Institute. 2001;93:1563–1568. doi: 10.1093/jnci/93.20.1563. [DOI] [PubMed] [Google Scholar]
- 9.Stevens RG, Blask DE, Brainard GC, Hansen J, Lockley SW, Provencio I, Rea MS, Reinlib L. Meeting report: The role of environmental lighting and circadian disruption in cancer and other diseases. Environmental Health Perspectives. 2007;115(9):1357–1362. doi: 10.1289/ehp.10200. [DOI] [PMC free article] [PubMed] [Google Scholar]
- 10.Straif K, Baan R, Grosse Y, Secretan B, Ghissassi FE, Bouvard V, Altieri A, Benbrahim-Tallaa L, Cogliano V. Carcinogenicity of shift-work, painting, and fire-fighting. The Lancet Oncology. 2007;8(12):1065. doi: 10.1016/S1470-2045(07)70373-X. [DOI] [PubMed] [Google Scholar]
- 11.Bierman A, Klein TR, Rea MS. The Daysimeter: A device for measuring optical radiation as a stimulus for the human circadian system. Measurement Science and Technology. 2005;16:2292–2299. [Google Scholar]
- 12.Berson DM, Dunn FA, Takao M. Phototransduction by retinal ganglion cells that set the circadian clock. Science. 2002;295:1070–1073. doi: 10.1126/science.1067262. [DOI] [PubMed] [Google Scholar]
- 13.Brainard GC, Hanifin JP, Greeson JM, Byrne B, Glickman G, Gerner E, Rollag MD. Action spectrum for melatonin regulation in humans: Evidence for a novel circadian photoreceptor. Journal of Neuroscience. 2001;21(16):6405–6412. doi: 10.1523/JNEUROSCI.21-16-06405.2001. [DOI] [PMC free article] [PubMed] [Google Scholar]
- 14.Thapan K, Arendt J, Skene DJ. An action spectrum for melatonin suppression: Evidence for a novel non-rod, non-cone photoreceptor system in humans. Journal of Physiology. 2001;525(Pt 1):261–267. doi: 10.1111/j.1469-7793.2001.t01-1-00261.x. [DOI] [PMC free article] [PubMed] [Google Scholar]
- 15.Van Derlofske J, Bierman A, Rea MS, Ramanath J, Bullough JD. Design and optimization of retinal flux density meter. Measurement Science and Technology. 2002;13:821. [Google Scholar]
- 16.Rea MS, Figueiro MG, Bullough JD, Bierman A. A model of phototransduction by the human circadian system. Brain Research Reviews. 2005;50(2):213–228. doi: 10.1016/j.brainresrev.2005.07.002. [DOI] [PubMed] [Google Scholar]
- 17.Commission International de l'Eclairage (CIE) Light as a True Visual Quantity: Principles of Measurement. Commission Internationale de l'Eclairage; Paris: 1978. [Google Scholar]
- 18.Schanda J, Morren L, Rea M, Rositani-Ronchi L, Walraven P. Does lighting need more photopic luminous efficiency functions? Lighting Research and Technology. 2002;34(1):69–78. [Google Scholar]
- 19.Smith VC, Pokorny J. Spectral sensitivity of the foveal cone photopigments between 400 and 500 nm. Vision Research. 1975;15:161–171. doi: 10.1016/0042-6989(75)90203-5. [DOI] [PubMed] [Google Scholar]
- 20.Ingling CR, Martinez-Uriegas E. The relationship between spectral sensitivity and spatial sensitivity for the primate r-g X-channel. Vision Research. 1983;23:1495–1500. doi: 10.1016/0042-6989(83)90161-x. [DOI] [PubMed] [Google Scholar]
- 21.McIntyre I, Norman TR, Burrows GD, Armstrong SM. Human melatonin suppression by light is intensity dependent. Journal of Pineal Research. 1989;6(2):149–156. doi: 10.1111/j.1600-079x.1989.tb00412.x. [DOI] [PubMed] [Google Scholar]
- 22.Zeitzer JM, Dijk DJ, Kronauer R, Brown E, Czeisler C. Sensitivity of the human circadian pacemaker to nocturnal light: Melatonin phase resetting and suppression. Journal of Physiology. 2000;526(Pt 3):695–702. doi: 10.1111/j.1469-7793.2000.00695.x. [DOI] [PMC free article] [PubMed] [Google Scholar]
- 23.Rea M, Bierman A, Figueiro M, Bullough JD. A new approach to understanding the impact of circadian disruption on human health. Journal of Circadian Rhythms. 2008;6:7. doi: 10.1186/1740-3391-6-7. [DOI] [PMC free article] [PubMed] [Google Scholar]
- 24.Van Someren EJW, Hagebeuk EE, Lijzenga C, Scheltens P, de Rooij SE, Jonker C, Pot AM, Mirmiran M, Swaab DF. Circadian rest-activity rhythm disturbances in Alzheimer's disease. Biological Psychiatry. 1996;40:259–270. doi: 10.1016/0006-3223(95)00370-3. [DOI] [PubMed] [Google Scholar]
- 25.Reddy AB, Wong GK, O'Neill J, Maywood ES, Hastings MH. Circadian clocks: Neural and peripheral pacemakers that impact upon the cell division cycle. Mutation Research. 2005;574(1–2):76–91. doi: 10.1016/j.mrfmmm.2005.01.024. [DOI] [PubMed] [Google Scholar]