

Two filament subpopulations with very different turnover rates make up the actin cortex in living cells: one with fast turnover dynamics and polymerization resulting from addition of monomers to free barbed ends, and one with slow turnover dynamics with polymerization resulting from formin-mediated filament growth.
Abstract
The cell cortex is a thin network of actin, myosin motors, and associated proteins that underlies the plasma membrane in most eukaryotic cells. It enables cells to resist extracellular stresses, perform mechanical work, and change shape. Cortical structural and mechanical properties depend strongly on the relative turnover rates of its constituents, but quantitative data on these rates remain elusive. Using photobleaching experiments, we analyzed the dynamics of three classes of proteins within the cortex of living cells: a scaffold protein (actin), a cross-linker (α-actinin), and a motor (myosin). We found that two filament subpopulations with very different turnover rates composed the actin cortex: one with fast turnover dynamics and polymerization resulting from addition of monomers to free barbed ends, and one with slow turnover dynamics with polymerization resulting from formin-mediated filament growth. Our data suggest that filaments in the second subpopulation are on average longer than those in the first and that cofilin-mediated severing of formin-capped filaments contributes to replenishing the filament subpopulation with free barbed ends. Furthermore, α-actinin and myosin minifilaments turned over significantly faster than F-actin. Surprisingly, only one-fourth of α-actinin dimers were bound to two actin filaments. Taken together, our results provide a quantitative characterization of essential mechanisms underlying actin cortex homeostasis.
INTRODUCTION
The cell cortex is an approximately ∼0.1-μm-thick layer formed by a network of actin filaments and actin-binding proteins that underlies the plasma membrane in most eukaryotic cells (Figure 1; Alberts et al., 2004). This submembranous mesh plays a fundamental role in many events in the cell cycle, allowing cells to resist external mechanical forces, generate mechanical stress, and change shape during cell motility and cytokinesis. At the molecular level, the cellular cortex is a tightly woven mesh of actin filaments cross-linked by proteins such as α-actinin and myosin II (Charras et al., 2006; Morone et al., 2006) that forms a continuous shell tethered to the membrane by linker proteins such as ezrin (Charras et al., 2006; Charras, 2008) and endows the cell with its mechanical properties (MacKintosh et al., 1995; Gardel et al., 2004; Paluch et al., 2006).
FIGURE 1:
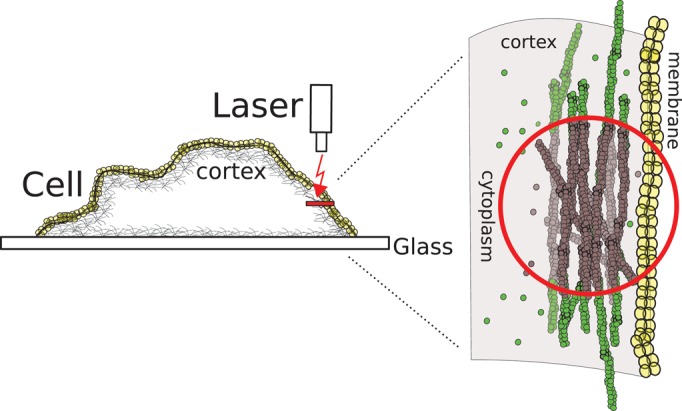
Experimental setup. FRAP and FLAP experiments are performed in a circular region within the cell cortex (red circle). Total fluorescence in the cortex results from both proteins bound to the actin cortex and proteins freely diffusing through the cortical actin mesh. Bleached monomers are shown in gray and fluorescent ones in green. After photobleaching, fluorescence in the cortex recovers through diffusion of fluorescent proteins through the cortical actin mesh (diffusive recovery) and through association/dissociation of fluorescent proteins to the cortex (reactive recovery). These two contributions can be separated experimentally because they occur on very different time scales: diffusive recovery has a characteristic time τ = 50 ms, whereas reactive recovery occurs on time scales >1 s.
Like most cytoskeletal structures, the actin cortex is highly dynamic, with actin-binding proteins attaching and detaching from the actin meshwork and the constituent actin filaments turning over due to addition and removal of monomers at the filament ends. In steady state, actin assembly and disassembly are balanced such that cortical thickness, structure, and mechanical properties stay constant over time. The relative rates of turnover of actin, actin cross-linking proteins, and contractile proteins in the cortex of cells notably participate in setting cortical tension and regulating cortical rheology (Bray and White, 1988; Tinevez et al., 2009) as they do in reconstituted actin gels (Mizuno et al., 2007; Sato et al., 1987). For example, disruption of contractility and actin turnover leads to changes in cortical tension (Tinevez et al., 2009) and cell rounding during mitosis (Stewart et al., 2011).
Our present understanding of protein turnover in the submembranous cortex is poor compared with that of other cytoskeletal structures such as the lamellipodium (Watanabe, 2010; Lai et al., 2008). Most studies concentrated on the cytokinetic cortex or the cleavage furrow. Recent studies show that cortical F-actin turnover in mammalian cells is very dynamic, with half-times of 20–25 s, and is modulated by the activity of proteins such as cofilin, α-actinin, or myosin (Murthy and Wadsworth, 2005; Mukhina et al., 2007; Tinevez et al., 2009; Wilson et al., 2010). However, detailed knowledge of the nature and rates of cortical F-actin polymerization and depolymerization mechanisms is lacking, and a thorough understanding of how actin filament mass is maintained remains elusive. In particular, the relative importance of the different molecular mechanisms of turnover influence the length distribution of actin filaments within the cortex, a parameter that, together with cross-link nature and density, plays a fundamental role in cortical structural integrity and mechanics (Gardel et al., 2004; Kasza et al., 2010; Bai et al., 2011).
Although many proteins localizing to the cell cortex have been identified (Charras et al., 2006), few studies have examined their dynamics and their precise role in the cortex. Myosin motors are dynamic in the cytokinetic cortex, with a turnover half-time of ∼10 s reported in Drosophila cells (Uehara et al., 2010). One detailed study of α-actinin found that its turnover is faster than that of F-actin (Mukhina et al., 2007). However, sole knowledge of the turnover half-time cannot provide information on what proportion of α-actinin dimers are bound to two actin filaments, something necessary to understand cortical rheology based on the dynamics and functions of cortical proteins. For example, myosin motors create tension in the cortex (Mizuno et al., 2007), and the rate of cross-link turnover dictates how long stresses persist (Wottawah et al., 2005). Indeed, when cross-links are released, filaments can slide past one another under the influence of motor proteins, leading to local dissipation of mechanical stresses. Hence understanding the relative turnover dynamics of actin, motors, and cross-links in the cortex of living cells is essential to formulating a quantitative description of cortex structure and mechanics that is based on molecular processes.
Here we examine the dynamics of three different cortical proteins involved in setting cortical thickness, providing structural integrity, and exerting mechanical stresses: the scaffold-protein actin, the bundling protein α-actinin, and the motor protein myosin II. We chose to do our experiments in a blebbing melanoma M2 cell line that has been used to characterize the proteic composition, ultrastructure, and physical properties of the cortex to identify the proteins involved in cortex regrowth (Charras et al., 2006, 2008). Furthermore, these cells offer us the possibility to compare the mature cortex with the newly formed cortex in blebs. We combined photobleaching (fluorescence recovery after photobleaching [FRAP]) and photoactivation (fluorescence loss after photoactivation [FLAP]) experiments with quantitative analysis in terms of first-order reaction kinetics. The molecular identity of participating processes was further characterized using drugs and expression of mutant proteins.
RESULTS
Analysis of FRAP experiments
In cortical regions, the total fluorescence signal results both from proteins bound to the actin cortex and from proteins freely diffusing through the cortical actin mesh (Figure 1). Hence fluorescence recovery after photobleaching will have contributions from diffusion of proteins through the cortical actin mesh (diffusive recovery) and association/dissociation of proteins to the cortex (reactive recovery; Sprague et al., 2004). In control photobleaching experiments, we showed that diffusive recovery was very rapid compared with reactive recovery, occurring with a half-time of 50 ms (Supplemental Figure S1). Therefore by subtracting the diffusive recovery from the total fluorescence recovery we could obtain the fluorescence recovery due to protein association and dissociation from the cortex only (see Materials and Methods, FRAP and FLAP data analysis, and Supplemental Figures S2 and S3).
We analyzed this reactive recovery in terms of first-order reaction kinetics, where free proteins in the cytoplasm associate with the cortex and cortical proteins dissociate from the cortex. In the simplest case, association and dissociation result from only one reaction, and the fluorescence intensity F(t) recovers as an exponential function of the form 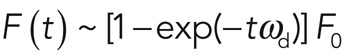 , with F0 the initial fluorescence before bleaching and ωd the effective dissociation rate of the turnover reaction (which is linked to the characteristic time of the reaction, τ = 1/ωd, and the half-time reported in most FRAP experiments, t1/2 = ln 2/ωd). A more realistic assumption is that several molecular processes contribute to turnover, and, in this case, fluorescence recovery is the sum of several exponential functions, with each exponential being associated to one molecular turnover process (see Materials and Methods, FRAP and FLAP data analysis). In summary, analysis of cortical FRAP recovery allows for the determination of 1) how many turnover processes contribute to fluorescence recovery, 2) the effective dissociation rate ωd,i and the characteristic time τd,i =1/ωd,i of each turnover process i, 3) the abundance fi of each turnover process relative to the whole population (with
 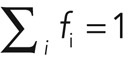 ), and 4) the time scales over which each turnover process is dominant in recovery (see Materials and Methods, FRAP and FLAP data analysis, and Supplemental Figure S4).
Also note that changes in the overall half-time of recovery t1/2 generally reported in FRAP experiments may result from changes in the number of processes participating in recovery, changes in the rates ωd,i of some or all of the turnover processes, changes in the abundances fi of some or all of the turnover processes, or a combination of all of these factors. Therefore analysis of fluorescence recovery in terms of first-order reaction kinetics allows a more precise characterization of turnover and of the changes occurring in response to chemical or genetic perturbations than merely reporting the recovery half-time.
Dynamics of actin in the cell cortex
In FRAP experiments, fluorescence recovery due to actin turnover occurred uniformly throughout the bleaching region (Figure 2, A and B). Fluorescence recovered with a half-time t1/2 = 12.8 ± 1 s, and recovery was complete in ∼80s (N = 30 cells; Figure 2, A and B). We then fitted functions F with an increasing number of exponentials to the experimental recovery curve to determine whether more than one molecular reaction process was involved in actin cortex turnover (Materials and Methods, FRAP and FLAP data analysis). Two exponential functions were necessary to fit our experimental data, suggesting that turnover in the cortex resulted from two distinct processes operating on different time scales and consequently that two subpopulations of actin filaments associated with these molecular turnover processes were present in the cortex. The values of the corresponding effective dissociation rates were  and
and 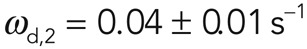 (25 of 25 curves examined; Figure 2B). Loss of fluorescence due to imaging (∼0.007 s–1) was an order of magnitude smaller than the slow recovery rate ωd,2, and hence imaging-induced fluorescence loss did not significantly affect the precision of our measurements. The subpopulation with fast turnover—henceforth referred to as subpopulation 1—accounted for 69% of fluorescence recovery (f1 = 0.69 ± 0.06), whereas the second subpopulation—referred to as subpopulation 2—accounted for 31% (f2 = 0.31 ± 0.06).
FIGURE 2:

Actin turnover in the cell cortex. (A) Consecutive confocal images of a FRAP experiment in a region comprising the actin cortex for a GFP-actin–expressing cell. GFP was bleached within the red circle between times t = 0 and 1 s. Diffusive fluorescence recovery was measured in the blue circle, and fluorescence loss due to imaging was determined from the region within the green circle. (B) Fluorescence recovery averaged over 25 cells (solid line) and fluorescence loss due to imaging (dotted line). (C) Consecutive confocal images of a FLAP experiment in a region comprising the actin cortex for cells expressing mRFP-PAGFP-actin (green channel). Photoactivation was performed between the red dots between times t = 0 and 1 s. After long times, fluorescent monomers incorporate elsewhere in the cortex (white arrows). (D) Fluorescence decay averaged over 12 cells. Scale bars, 1 μm (A, C). In B and D, error bars indicate SDs, and red solid lines represent best fits to multiexponential functions; see Materials and Methods and Supplementary Materials.
In our experiments, we chose to sample fluorescence recovery every 1s to minimize loss of fluorescence due to imaging and enable examination of recovery over long durations. However, one might worry that such slow sampling of recovery might not allow for an accurate determination of fast recovery kinetics, such as the recovery of subpopulation 1, which had a characteristic time of τd,i = 1/ωd,i = 0.72 s. To verify that our chosen sampling rate still enabled accurate determination of the dissociation rates of turnover processes with fast kinetics, we repeated our photobleaching experiments, sampling recovery every 100 ms over a duration of 5 s. Under these conditions, only one exponential was necessary to fit the recovery data (Supplemental Figure S5), consistent with the short duration of the experiments compared with the characteristic time of subpopulation 2 (τd,1 = 25 s), and we measured a dissociation rate  (N = 12 cells; Supplemental Figure S5), not significantly different from the recovery rate measured with slow sampling rates (p = 0.9). Therefore we concluded that sampling recovery every 1 s offered a good compromise between reliable determination of fast dissociation rates and minimization of imaging-induced fluorescence loss.
Because exposure to high local laser illumination can result in protein inactivation, a process known as chromophore-assisted laser inactivation (Jacobson et al., 2008), we asked whether subpopulation 1 was due to the creation of free barbed ends by laser-induced severing of actin filaments (Reymann et al., 2011), using two independent experiments. First, because laser-induced photodamage is very sensitive to illumination settings (Reymann et al., 2011), we varied the laser power used for photobleaching between 80 and 100% of maximal power. Analysis of the fluorescence recovery revealed that neither the reaction rates nor the relative sizes of the two filament subpopulations were affected by changes in laser power (Supplemental Figure S6). Second, if photodamage induces severing of actin filaments and the creation of new barbed ends, then we should observe a local increase in actin polymerization and F-actin density immediately after laser illumination. Indeed, previous work showed that local generation of free barbed ends by local uncaging of cofilin gives rise to a local increase in F-actin polymerization (Ghosh et al., 2004). To test whether this occurs, we transfected cells with actin labeled with both monomeric red fluorescent protein (mRFP) and photoactivatable green fluorescent protein (GFP; PAGFP-mRFP actin; Kueh et al., 2008) to allow for assessment of the turnover dynamics of actin filaments with the PAGFP signal and imaging of total actin with the mRFP signal. We reasoned that if photoactivation of PAGFP generated free barbed ends by laser-induced severing, we should observe an increase in the mRFP signal due to enhanced polymerization at the newly created barbed ends concomitant with photoactivation. In our experiments, no significant differences in mRFP signal were apparent between the photoactivation region and control regions (Supplemental Figure S6, A and B). We concluded that in photoactivation experiments no laser-induced severing of actin filaments occurs.
Furthermore, analysis of the PAGFP signal in photoactivation experiments allowed for independent determination of turnover rates. In the photoactivated region, fluorescence decayed uniformly throughout the activated region with a half-time t1/2 = 14.1 ± 1 s (N = 12 cells; Figure 2, C and D), and again two exponential functions were necessary to fit the fluorescence decay curves with turnover rates  and
and  and the first subpopulation representing a fraction f1 = 0.65 ± 0.06 of the total subpopulation (N = 25 curves examined; Figure 2D). The measured effective dissociation rates obtained from FRAP and FLAP experiments were not significantly different (p = 0.84 and 0.96, for ωd,1 and ωd,2, respectively). This, together with the absence of laser-induced severing in FLAP experiments, implied that subpopulation 1 was not created by laser-induced severing in FRAP experiments either. Taken together, these results strongly suggest that the presence of two actin filament subpopulations with different turnover rates represents an intrinsic characteristic of actin filament turnover in the cortex.
Polymerization processes contributing to cortical F-actin turnover
To biochemically characterize the two subpopulations of actin filaments, we perturbed actin polymerization with chemical inhibitors. Fluorescence recovery of bleached actin filaments in the cell cortex can occur via two distinct pathways. First, existing filaments elongate by incorporating fluorescent G-actin, predominantly at their barbed ends. This process can occur either by spontaneous addition of a monomer to a free barbed end or be mediated by proteins bound to the barbed end, such as members of the formin family. Second, the nucleation of new filaments may also contribute significantly to the maintenance of cortical actin mass and hence fluorescence recovery. At the concentration of free G-actin present in the cell, spontaneous nucleation can be neglected (Sept and McCammon, 2001). Instead, specialized proteins, known as nucleators, assist the formation of new actin filaments. Two broad classes of nucleators can be distinguished. Pointed-end nucleators facilitate the creation of actin seeds, which can then elongate by spontaneous addition of monomers to the free barbed end. Examples of such nucleators are the Arp2/3 complex, spire family proteins, and leiomodin. On the other hand, proteins like formins assist the formation of an actin nucleus while being located at the barbed end. These nucleators remain bound to the barbed end and accelerate elongation compared with spontaneous binding of monomers to free barbed ends (Romero et al., 2004).
To test the importance of spontaneous filament elongation at free barbed ends in cortical actin turnover, we treated cells with cytochalasin D, a drug that tightly binds to free barbed ends and blocks addition of monomers (Casella et al., 1981; MacLean-Fletcher and Pollard, 1980). After exposure of the cells to cytochalasin, the total fluorescence intensity of the cortex dropped by 60% in 30 min, reflecting cortical actin loss, until it reached a plateau between 30 and 60 min before sharply decreasing further (Supplemental Figure S7). We considered the cells to be in a quasi-steady state during the plateau phase and did our experiments in this time window.
In the presence of 1 μM cytochalasin D, cortex fluorescence recovered to 20% of its prebleach value (N = 12 cells), whereas recovery saturated at 10% in the presence of 10 μM cytochalasin D (N = 11 cells; Figure 3, A and B). The corresponding recovery half-times were t1/2 = 5 ± 1 and 2 ± 1s, respectively. In both cases, the effective dissociation rate ωd,1 decreased significantly compared with the control condition (p < 0.01), indicating barbed-end capping of the corresponding filaments (Table 1 and Figure 3C). In contrast, no significant change could be observed for ωd,2 Simultaneously, the abundance f1 of filaments in subpopulation 1 decreased from 69 to 40 and 26%, respectively (Table 1).
FIGURE 3:

Effects of genetic and chemical perturbations on actin cortex turnover. (A) Consecutive confocal images of a FRAP experiment in a region comprising the actin cortex for a GFP-actin–expressing cell in the presence of 10 μM cytochalasin D. Scale bar, 1 μm. (B) Fluorescence recovery in presence of 1 μM (dashed line, averaged over 12 cells) and 10 μM (dotted line, 11 cells) cytochalasin D and in control cells (solid line). Red lines represent best experimental fits to multiexponential functions. (C–F) Logarithmic acceleration plots (see Materials and Methods) of average fluorescence recovery in the presence of cytochalasin D (C); for cells expressing either constitutively active or a dominant-negative cofilin mutants, respectively, cofilinS3A and cofilinS3E (D); in the presence of the formin inhibitor SMIFH2 (E); and for cells overexpressing the pointed-end capping protein tropomodulin (F). Curves were averaged over at least 10 cells. Solid lines indicate fluorescence recovery in untreated cells expressing GFP-actin.
TABLE 1:
Parameters of the multiexponential fits of FRAP recovery (FLAP decay) curves for different treatments.
| Multiexponent fit | ωd,1 (1/s) | p value | f1 | ωd,2 (1/s) | p value | N | |
|---|---|---|---|---|---|---|---|
| FRAP | α-Actinin | 0.39 ± 0.1 | — | 0.75 ± 0.08 | 0.07 ± 0.01 | — | 20 |
| α-Actinin actin-binding domain | 0.32 ± 0.2 | 0.95 | 1.0 | — | — | 12 | |
| FRAP | MRLC | 0.6 ± 0.1 | — | 0.86 ± 0.09 | 0.07 ± 0.04 | — | 12 |
| FRAP | Actin | 1.38 ± 0.1 | — | 0.69 ± 0.06 | 0.04 ± 0.01 | — | 30 |
| Actin + 1 μM cytochalasin D | 0.47 ± 0.1 | <0.01 | 0.4 ± 0.06 | 0.03 ± 0.01 | 0.52 | 12 | |
| Actin + 10 μM cytochalasin D | 0.25 ± 0.1 | <0.01 | 0.26 ± 0.07 | 0.04 ± 0.01 | 0.99 | 11 | |
| Actin + 40 μM SMIFH2 | 0.49 ± 0.2 | <0.01 | 0.72 ± 0.07 | 0.02 ± 0.01 | <0.01 | 12 | |
| Actin + cofilinS3A | 0.69 ± 0.1 | <0.01 | 0.71 ± 0.07 | 0.06 ± 0.02 | <0.01 | 18 | |
| Actin + cofilinS3E | 0.81 ± 0.1 | <0.01 | 0.5 ± 0.05 | 0.05 ± 0.01 | <0.01 | 12 | |
| Actin + tropomodulin | 0.5 ± 0.1 | <0.01 | 0.72 ± 0.07 | 0.04 ± 0.01 | 0.92 | 18 |
The statistical significance of differences for rates ωd,1 and ωd,2 for genetically or chemically treated cells and untreated cells is given in terms of corresponding p values. The protein abundance f1 (with f2 = 1–f1) is given in the column next to each exponent.
To graphically visualize the effects of perturbations of the different processes of fluorescence recovery, we generated logarithmic acceleration plots in which we plotted the logarithm of the second derivative of F (Figure 3C). These graphs consist of piecewise linear segments, with each segment corresponding to a different turnover process with its slope equal to ωd,i (Materials and Methods). Therefore changes in the dissociation rates of individual turnover processes in response to perturbations can be visualized as changes in the slopes of the corresponding linear segments.
We verified that our observations were specific to the attachment of cytochalasin D to filament barbed ends by monitoring fluorescence recovery in cells treated with 520 nM latrunculin B, a drug that binds G-actin monomers, preventing their incorporation into actin filaments (Morton et al., 2000; Yarmola et al., 2000). In contrast to cytochalasin D, photobleaching experiments in the presence of latrunculin B showed fluorescence recovery only through diffusion into the bleached area, and no reactive component could be detected (Supplemental Figure S8).
Analysis of fluorescence recovery curves allowed for determination of the effective dissociation rates involved in actin turnover, yet cytochalasin acts at filament barbed ends, preventing association of new monomers. In steady state, association must balance dissociation, and hence we can also deduce the relative changes in the effective association rates ωa,i upon cytochalasin treatment, knowing the total fluorescence F of the cortex, the fluorescence F0 of the cytoplasm, the relative abundance fi, and the effective dissociation rate ωd,i (Eq. 4; see Materials and Methods, FRAP and FLAP data analysis). Experimentally, we found that the cytoplasmic fluorescence did not change significantly after addition of cytochalasin,  , and using our experimental measurements for fi and ωd,i, we obtain
  and
and  for 1 μM cytochalasin and
  and
and  for 10 μM cytochalasin. We concluded that cytochalasin D addition significantly affected the effective association rate of filaments in subpopulation 1 but not in subpopulation 2. Assuming, furthermore, that the number of filaments in subpopulation 2 does not change, this result suggests that the molecular process underlying G-actin addition to filaments in subpopulation 2 involves a factor that competes with cytochalasin for binding to barbed ends.
To test this hypothesis and examine whether formins contributed to addition of monomers to filaments in subpopulation 2, we performed FRAP experiments in the presence of the broad-spectrum formin inhibitor SMIFH2 (Rizvi et al., 2009). After 30 min of incubation with 40 μM SMIFH2, the turnover rates ωd,1 and ωd,2 of both subpopulations decreased significantly (p < 0.01 in both cases, N = 12 cells; Table 1 and Figure 3E), indicating that formin-mediated polymerization contributes significantly to actin cortex turnover. Remarkably, f1 and f2 did not change appreciably, suggesting that the two subpopulations are not independent of one another. Indeed, if filament subpopulations were only specified on the basis of barbed-end occupancy by formins, we would expect a flux of filaments from subpopulation 2 to subpopulation 1 due to formin dissociation from barbed ends or severing of formin-capped filaments.
Depolymerization processes contributing to cortical F-actin turnover
The previous experiments revealed two subpopulations of filaments with different turnover rates that reflected differences in polymerization mechanisms. We asked whether the subpopulations also exhibited differences in their depolymerization mechanisms. Filament depolymerization is regulated by a number of proteins, with cofilin being the best characterized among these. Cofilin accelerates depolymerization at the pointed end and can sever F-actin (Bernstein and Bamburg, 2010). We studied its effects on actin turnover by expressing the dominant cofilin mutants: constitutively active cofilinS3A and constitutively inactive cofilinS3E (Mseka et al., 2007; Bernstein and Bamburg, 2010).
First, we confirmed that expression of constitutively active cofilin led to a reduction in cortical F-actin and that constitutively inactive cofilin led to an increase in cortical F-actin by measuring the total F-actin mass through fluorescein isothiocyanate (FITC)–phalloidin fluorescence. Cells expressing constitutively active cofilinS3A showed a significant decrease in F-actin mass to 10 ± 3% of controls (p < 0.01, N = 18 cells), whereas cells expressing dominant inactive cofilinS3E had a twofold-higher F-actin mass (200 ± 25%, p < 0.01, N = 12; Supplemental Figure S9).
Next we examined the effect of cofilin mutants on the turnover of the two F-actin subpopulations using FRAP. Expression of dominant inactive cofilinS3E decreased ωd,1 and led to a small but significant increase in ωd,2 (Table 1 and Figure 3D). At the same time, cofilinS3E led to a significant increase in f2. The effect of expressing constitutively active cofilinS3A was qualitatively the same and quantitatively very similar, except that it did not change the relative weights of the subpopulations (Table 1 and Figure 3D). These results show that the turnover of both F-actin subpopulations is cofilin dependent.
To assess the relative effect of the end-depolymerization and severing activities of cofilin on cortical actin turnover, we overexpressed tropomodulin, which is a capping protein that prevents cofilin-mediated depolymerization at the pointed end but not severing (Dos Remedios et al., 2003). Tropomodulin overexpression resulted in a significant increase in cortical actin mass (180 ± 20%, N = 22 cells), as well as a significant decrease in the effective turnover rate ωd,1 but essentially no change in ωd,2 (Table 1 and Figure 3F). This signifies that depolymerization from pointed ends played an important role in the turnover of the filaments with free barbed ends in subpopulation 1, whereas depolymerization in the second formin-capped subpopulation occurred primarily through severing.
Turnover kinetics of α-actinin
As for actin, α-actinin fluorescence recovered uniformly throughout the bleached cortical region, (Figure 4A). Recovery was complete in ∼30 s with a half-time of t1/2 = 4.5 ± 1 s (Figure 4B and Table 2). The turnover of α-actinin is thus faster than for actin, as expected for an actin-binding protein. The recovery curve clearly revealed two distinct subpopulations with very different recovery rates (Figure 4C and Table 1). The bleaching rate was 0.004 s–1, small compared with the measured recovery rates.
FIGURE 4:
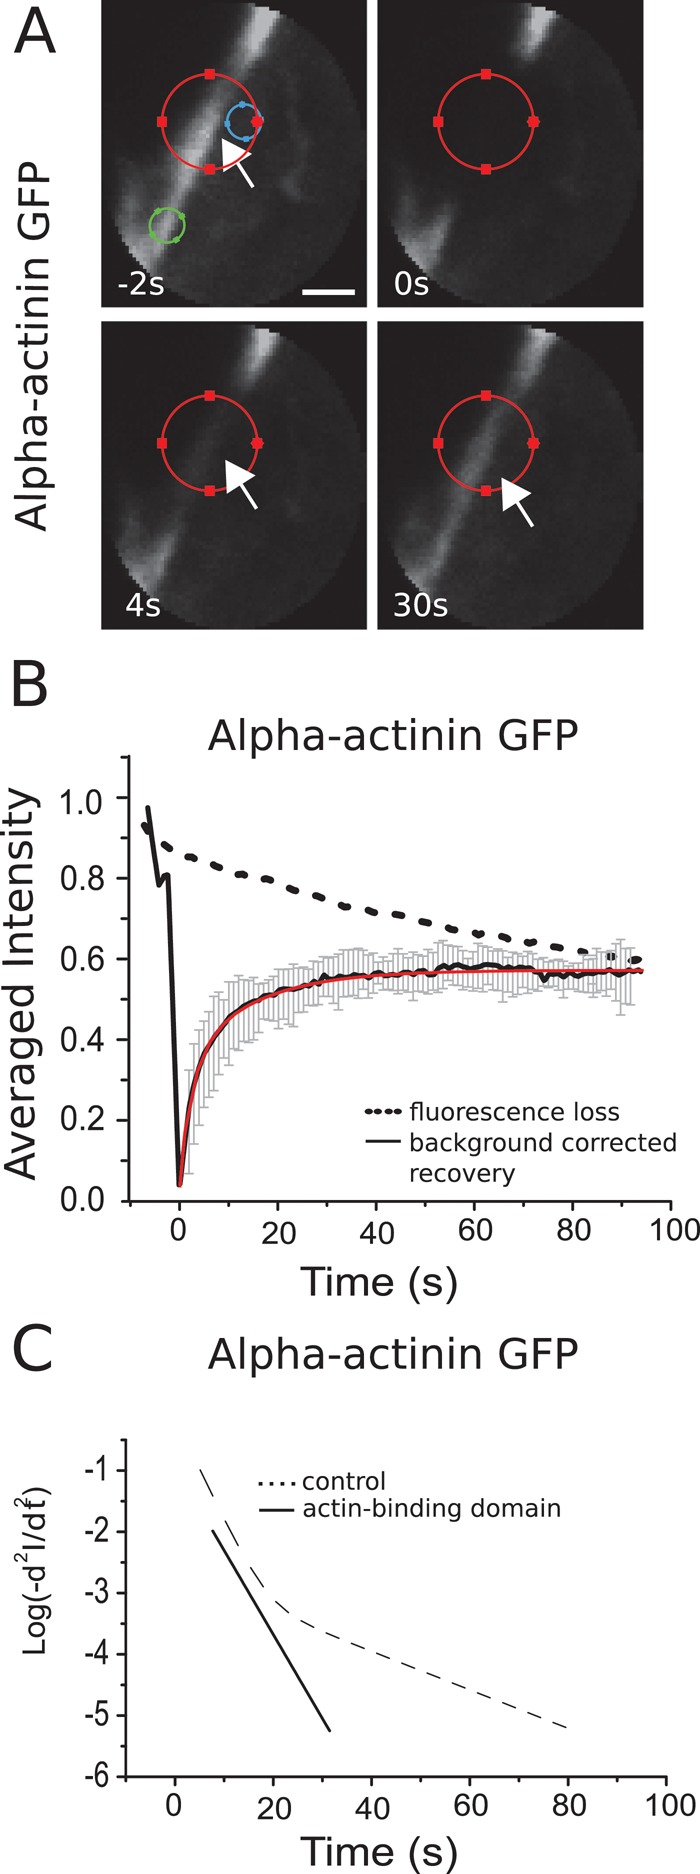
Turnover of α-actinin in the cortex. (A) Consecutive confocal images of a FRAP experiment in a region comprising the actin cortex for a cell expressing GFP–α-actinin. Circles of different colors indicate the same regions as in Figure 2. Scale bar, 1 μm. (B) Fluorescence recovery averaged over 20 cells. Error bars, SDs. Red line, fit of a sum of two exponentials to the data. (C) Logarithmic acceleration plots for full-length α-actinin and for its actin-binding domain (solid line). Two distinct subpopulations participate in the turnover of the full-length protein, whereas only a single population participates in the turnover of the actin-binding domain.
TABLE 2:
Half-times of recovery or decay and effective dissociation rate constants averaged over all of the participating processes.
| Experiment | ωd,i (1/s) | p value | Half-time (s) | N | ||
|---|---|---|---|---|---|---|
| FRAP | α-Actinin | Cortex | 0.12 ± 0.02 | — | 4.5 ± 1 | 20 |
| α-Actinin | Bleb | 0.16 ± 0.04 | 0.98 | 4.5 ± 1 | 8 | |
| FRAP | MRLC | Cortex | 0.07 ± 0.04 | — | 6.5 ± 1 | 12 |
| FRAP | Actin | Cortex | 0.04 ± 0.01 | — | 8.6 ± 1 | 25 |
| Actin | Bleb | 0.31 ± 0.07 | <0.01 | 1.9 ± 1 | 8 | |
| FLAP | Actin | Cortex | 0.04 ± 0.01 | — | 9.5 ± 1 | 10 |
| Actin | Bleb | 0.4 ± 0.1 | <0.01 | 2 ± 1 | 10 |
The p values compared with control are given in the column next to each exponent.
Given that α-actinin is a homodimer with two identical binding sites for actin, we hypothesized that the two subpopulations corresponded to singly and doubly bound α-actinin dimers. To test this hypothesis, we examined the cortex-binding dynamics of the α-actinin actin-binding domain alone. Like the full-length protein, the α-actinin actin-binding domain localized to the cell cortex (Supplemental Figure S10 and Supplemental Movie S1). Its fluorescence recovery was well described by a single exponential with a turnover rate similar to that of the fast recovery process for full-length α-actinin (p = 0.95 compared with control; Figure 4C and Table 1). We conclude that the α-actinin subpopulations with fast turnover kinetics represent dimers bound to the F-actin cortex through only one actin-binding domain, whereas the subpopulations with slow turnover represents doubly bound dimers.
The abundance of singly bound α-actinin was f1 = 0.75 ± 0.1. This value is similar to that expected if the two binding domains independently associate and dissociate from the actin network. Indeed, if we consider only bound α-actinin and let p denote the probability of one binding domain to be bound, then 2p + p2 = 1 if binding of the two binding domains is independent of one another. The first term on the left-hand side accounts for the probability that proteins are bound via one domain, and the second for the probability that both domains are bound. Consequently, p = 0.41, yielding an expected abundance f1 = 0.82 for singly bound α-actinin. We conclude that there is, if at all, very weak cooperativity between the two binding domains. Furthermore, this indicates that the availability of actin-binding sites does not limit cross-linking by α-actinin, perhaps because the molecular length of α-actinin between 30 and 45 nm (Meyer and Aebi, 1990) is close to the mesh size of the cortical actin network (Charras et al., 2006).
Myosin regulatory light-chain turnover kinetics
To investigate turnover of the motor protein myosin II, we examined fluorescently labeled myosin regulatory light chain (MRLC), a component of myosin II whose phosphorylation controls myosin activity. Myosin II assembles into bipolar minifilaments bound to F-actin that appear as distinct, long-lived puncta in the cortex and blebs of nonmuscle cells (Charras et al., 2006; Craig et al., 1985; Svitkina et al., 1997; Zhou and Wang, 2008; Supplemental Figure S11). In FRAP experiments, MRLC recovery occurred uniformly with a half-time t1/2 = 6.5 ± 1 s (Table 1 and Supplemental Figure S11). The bleach rate was 0.002, small compared with the measured effective dissociation rates. As expected, MRLC's turnover rate is faster than for actin but slower than that for α-actinin. In this way, myosin II can reorganize actin network topology in spite of transient passive cross-links. Similar to α-actinin, two subpopulations with different effective turnover rates could be identified in the recovery of myosin II.
Comparative turnover in mature and new cortices
Because our results on turnover of mature actin cortex revealed the presence of two subpopulations of actin with different kinetics, we decided to examine actin turnover in cellular blebs, reasoning that their actin cortex is younger and therefore that the relative abundances of each actin subpopulation may differ. Blebs are spherical protrusions of the cell membrane that are originally devoid of an actin cortex. As bleb growth slows, a new actin cortex forms. Subsequently α-actinin and myosin motors are recruited to the actin network (Charras et al., 2006) and the bleb retracts. During retraction, the total actin filament mass in the new cortex, as well as the amount of α-actinin, stays constant (Charras et al., 2008), indicating that both proteins can be considered in steady state during retraction.
When we performed FRAP experiments for actin in blebs, we observed a fourfold reduction in the recovery half-time as compared with mature cortex (Table 2 and Figure 5B). Half-times obtained from FLAP experiments were not significantly different from those obtained from the FRAP experiments (Table 2), supporting the notion that the actin mass of the cortex in a retracting bleb is in steady state. Turnover of actin in retracting blebs was almost one order of magnitude faster than in mature cortex (p < 0.01 compared with mature cortex, N = 8; Table 2). In contrast, α-actinin dynamics was not significantly different in blebs compared with mature cortex.
FIGURE 5:
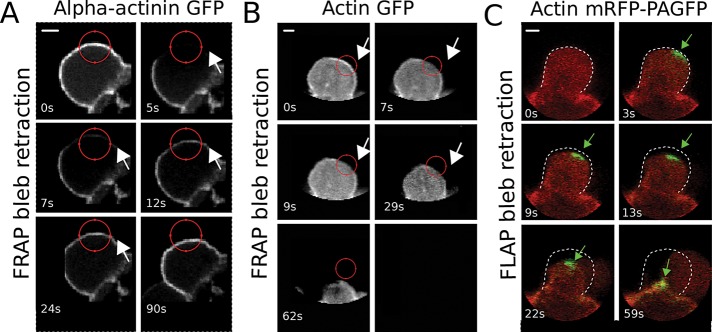
Actin and α-actinin turnover in blebs. Consecutive confocal images of retracting blebs for (A) a FRAP experiment in a cell expressing GFP–α-actinin, (B) a FRAP experiment in a cell expressing GFP-actin, and (C) a FLAP experiment in a cell expressing mRFP-PAGFP-actin (mRFP channel shown in red, GFP channel in green). In A and B, red circles indicate the bleach region, and in C the green arrow points to the region of photoactivation and the initial bleb boundary is indicated by the white dashed line. Scale bar, 1 μm.
DISCUSSION
In this work, we studied the dynamics of actin, the F-actin cross-linker α-actinin, and the motor protein myosin II in the submembranous F-actin cortex, using photobleaching and photoactivation experiments. To this end, we expressed the proteins of interest fused to fluorophores against the endogenous background. Note that the ensuing overexpression does not markedly affect the binding or unbinding rates of the proteins of interest as long as the amount of actin filaments is not rate limiting. For all three proteins, we could identify distinct protein subpopulations with different turnover kinetics. For α-actinin, which can cross-link actin filaments, the two corresponding subpopulations are readily identified as singly and doubly bound α-actinin. In the case of F-actin, the interpretation is less straightforward because many proteins influence actin turnover by acting on barbed or pointed ends, nucleating new filaments, or severing existing filaments.
Using chemical and genetic tools, we characterized the observed F-actin subpopulation. The two subpopulations reacted differently to barbed-end capping by cytochalasin D: the effective association rate ωa,1 of subpopulation 1 decreased markedly, whereas ωa,2 remained unaffected, suggesting that the barbed ends of the latter filaments are protected against cytochalasin D binding. Addition of the formin inhibitor SMIFH2 then suggested that this protection is mediated by formins. At first sight, this seems to be at odds with the fact that subpopulation 2 turns over more slowly than subpopulation 1, because, at the molecular level, formins speed up F-actin elongation at the barbed end (Romero et al., 2004). However, subpopulation 1 can dominate recovery in spite of a slower elongation rate if filaments with free barbed ends far outnumber filaments with formin-capped ends. In support of this, our experiments revealed that subpopulation 1 was most abundant, accounting for two-thirds of the monomers incorporated into the cortex (f1 = 0.69). Finally, the fact that we can detect recovery due to filaments in subpopulation 2 at long time scales coupled to the faster elongation rate of filaments by formins (Romero et al., 2004, Kovar et al., 2006) implies that filaments within subpopulation 2 are many times longer than those in subpopulation 1.
The turnover of both subpopulations of actin filaments in the cortex was dependent upon cofilin, but turnover of filaments in subpopulation 2 depended primarily on severing, whereas pointed-end depolymerization was important in subpopulation 1. Because severing of the formin-capped filaments in subpopulation 2 generates formin-free filaments belonging to subpopulation 1, the relative abundance of the former increased upon expression of constitutively inactive cofilinS3E. The constitutively active cofilinS3A mutant induced a reduction in turnover of subpopulation 1, whereas it increased turnover of the formin-capped subpopulation 2. Consequently, for subpopulation 1 the increased depolymerization activity of cofilinS3A must be compensated by a reduction in the respective number of filaments to result in the observed reduction of turnover. Overexpression of tropomodulin, a pointed-end capping protein that prevents cofilin-mediated pointed-end depolymerization but not severing, slowed turnover of the first subpopulation and increased overall actin mass but had no effect on the effective turnover of the second subpopulation or the relative abundance of filament subpopulations in the cortex. This, together with the slower turnover observed upon expression of inactive cofilinS3E, suggested that tropomodulin decreased the average depolymerization rate in filaments in subpopulation 1 by competing with cofilin for the pointed end. Tropomodulin's lack of effect on the second subpopulation further supports the idea that severing may be more important than pointed-end depolymerization in its turnover. Together with the decrease in turnover of both subpopulations observed upon SMIFH2 treatment, our findings lead us to speculate that, in the homeostatic cortex, cofilin-mediated severing generates fluxes of filaments from the formin-capped subpopulation 2 that replenish subpopulation 1.
In addition to changes in turnover rates, we also observed changes in the abundances of filaments belonging to each subpopulation in response to perturbations. Some changes were expected, such as the reduction in the abundance of filaments in subpopulation 1 (with free barbed ends) after addition of cytochalasin or upon expression of constitutively inactive cofilinS3E. Indeed, in the first case, the growth of filaments with unprotected barbed ends is blocked, implying a shorter lifetime and length of these filaments, leading to a decrease in their overall abundance. In the second case, the flux of filaments from subpopulation 2 to subpopulation 1 is reduced by inactivation of severing, leading to a decrease in abundance of subpopulation 1. Other changes are more challenging to explain and will necessitate further analysis. For example, it is unclear why we did not observe a significant change in the relative abundance of either subpopulation upon addition of the formin inhibitor SMIFH2, constitutively active cofilinS3A, or tropomodulin.
Actin in retracting blebs showed an almost 10-fold-higher turnover compared with the mature cortex. Either entirely different molecular mechanisms of turnover might be at work in new cortices or increased turnover could just result from a different balance of the actin filament subpopulations present in mature cortices. Further work is necessary to determine which of these hypotheses is correct.
Based on measured FRAP recovery half-times, the turnover of cross-linker is in general found to be faster than that of actin (Mukhina et al., 2007). This draws a mechanical picture in which myosin minifilaments constantly put F-actin cross-links under stress that is released through filament sliding on time scales longer than the turnover of cross-linking by α-actinin. However, our experiments show that turnover of cross-linking myosin and α-actinin is between the rates of the two actin subpopulations. Because the turnover of cross-linking α-actinin and the slow subpopulation of myosin is between the rates of the two actin subpopulations, this suggests that cortical rheology is more complex than the simple picture described earlier. The tethering of the actin filaments from subpopulation 1 to the cortex may therefore be mediated by different actin cross-linkers with a faster turnover than the doubly bound α-actinin subpopulation. Furthermore, the slower turnover of actin filament subpopulation 2 compared with the doubly bound α-actinin subpopulation leads us to speculate that actin filaments within subpopulation 2 may support contractility and generate cortical tension but not those in subpopulation 1, signifying that two functionally different actin networks exist within the cortex (Michelot and Drubin, 2011). Such complexity suggests that multiple relaxation times exist in cortical mechanics, something supported by experimental characterizations of cortical microrheology (Van Citters et al., 2006).
In summary, our experiments identified two filament subpopulations with distinct turnover kinetics in the cellular actin cortex: one population with free barbed ends and one with formins bound to their barbed ends. The filaments in the former population turn over faster, are more abundant, and, we speculate, are on average shorter than the filaments in the latter population. Furthermore, cofilin-mediated severing of formin-capped filaments might contribute to replenishing the filament subpopulation with free barbed ends. Such conclusions open new questions. In particular, the exact molecular mechanisms leading to the nucleation of each filament subpopulation and how the two subpopulations interact to maintain steady-state in the cortex remain to be determined, and the consequences for the cortical mechanical properties need to be ascertained.
MATERIALS AND METHODS
Cell culture
Filamin-deficient M2 melanoma cells (Cunningham et al., 1992) were cultured at 37°C in an atmosphere of 5% CO2 in air in MEM (Life Technologies, Paisley, United Kingdom) with penicillin/streptomycin, glutamine and 10% of an 80:20 mix of DCS:FCS. For experimentation, cells were trypsinized and plated onto 25-mm-diameter glass coverslips and cultured overnight. All imaging was done in Leibovitz L15 medium (Life Technologies) supplemented with 10% fetal bovine serum.
Cell lines, transfections, and transductions
Actin-GFP, actin-PAGFP, actin-PAGFP-mRFP, and MRLC-GFP stable cell lines were created using retroviruses generated by transfecting 293-GPG packaging cell lines (a kind gift of D. Ory, University of Washington, Seattle, WA) with the gene of interest inserted into pRetroQ-Ac-GFP or pLPCX vectors (Clontech, Mountain View, CA). Cells were then selected with puromycin and subcloned as described in Charras et al. (2006). For expression of α-actinin–GFP, the actin-binding domain of α-actinin, tropomodulin-RFP, and cytoplasmic GFP, cells were transfected with plasmids using Lipofectamine 2000 (Invitrogen, Carlsbad, CA) or Effectene R (Qiagen, Valencia, CA) according to the manufacturer's protocol, using 1 μg of cDNA per well of a six-well plate, and cells were examined the following day. The plasmid encoding α-actinin-GFP and MRLC-YFP were described in Charras et al. (2006), the plasmid encoding mRFP-PAGFP-actin is described in Kueh et al. (2008), the construct for tropomodulin-RFP was a kind gift from N. Watanabe (Tohoku University, Sendai, Japan), and the construct encoding the actin-binding domain of α-actinin–GFP was a kind gift from M. Murata-Hori (Temasek Life Sciences Laboratory, Singapore). For expression of cofilin mutants, cells were transduced with adenovirus encoding either cofilinS3A or cofilinS3E along with a red fluorescent protein that served as a marker of transduction. Adenovirus production and handling was effected as described in Mseka et al. (2007). Cofilin constructs were a kind gift from J. Bamburg (Colorado State University, Fort Collins, CO) and adenoviruses a kind gift from L. Cramer (University College London, London, United Kingdom).
Drug treatment
Cytochalasin D, latrunculin B, and SMIFH2 were purchased from Merck Biosciences (Darmstadt, Germany). Drugs were added to the culture medium at the desired concentration, and the cells were left to incubate for at least 30 min. Inhibitors were also present at the same concentration in the imaging medium.
F-actin staining
For F-actin staining, cells were fixed for 15 min with 2% paraformaldehyde at room temperature, permeabilized with 0.1% Triton-X on ice for 5 min, and passivated by incubation with phosphate-buffered saline (PBS) containing 10 mg/ml bovine serum albumin (BSA) for 10 min. They were then stained with FITC–phalloidin (50 μg/ml; Invitrogen) for 30 min at room temperature, washed several times with PBS-BSA, and mounted for microscopy examination on a confocal microscope.
Confocal microcopy
All fluorescence imaging was done using a 1.3 numerical aperture/100× oil-immersion objective on a scanning laser confocal microscope (Olympus FluoView FV1000; Olympus, Tokyo, Japan). Fluorophores were excited at 488-nm wavelength for GFP-tagged proteins and 543-nm wavelength for RFP-tagged proteins or rhodamine. For live microscopy, laser intensities of 5–15% of a 20-mW laser were used to obtain a strong signal while minimizing image acquisition–induced fluorescence loss. Images were acquired at 0.2- to 1-s intervals to minimize the general loss of fluorescence due to imaging while still sampling fluorescence recovery sufficiently rapidly.
FRAP and FLAP protocol
In both FRAP and FLAP experiments, a small circular region of interest (r = 2 μm) centered on part of the cell cortex was imaged (Figures 1 and 2A). In the center of this region of interest, a smaller circular bleaching/photoactivation region (r = 1 μm) containing both cortex and cytoplasm was chosen. This choice of imaging and bleaching region helped to minimize acquisition-induced fluorescence loss by not exposing the whole cell volume to light. After photobleaching/activation, fluorescence recovery/decay was followed separately in the cortex and the cytoplasm by segmenting these areas based on prebleach/activation images.
To assess the fluorescence loss due to imaging-induced photobleaching, we simultaneously recorded fluorescence from a cortical region separated from the bleached region.
For FRAP experiments, bleaching was performed by scanning the 488-nm beam operating at 100% laser power line by line over the circular bleach region. For FLAP, photoactivatable GFP was activated by scanning the 405-nm beam (20-mW ultraviolet laser operating at 30% laser power) line by line over the circular activation region. In both cases, our experimental protocol was as follows: five frames were acquired for normalization of the fluorescence signal, bleaching/photoactivation was carried out with one single iteration of the laser pulse at 8 μs/pixel, and finally recovery/decay was monitored over 100 frames. Frames were separated by either 100 ms or 1 s.
FRAP and FLAP data analysis
For the analysis of FRAP and FLAP data, we assume that the cortex is in steady state. Thus the total number of cortical proteins is constant, and the numbers of, respectively, bleached and fluorescent proteins in the region of interest change after bleaching or photoactivation at time t = 0.
In cortical regions, the total fluorescence results both from proteins bound to the actin cortex and from proteins freely diffusing through the actin mesh. Consequently, both diffusion and attachment/detachment of proteins to/from the cortex determine the fluorescence recovery/decay dynamics (Tardy et al., 1995; McGrath et al., 1998). To determine the time scale of diffusive recovery in our experimental conditions, we carried out FRAP experiments for cytoplasmic GFP. Within our relatively small region of interest, fluorescence was initially homogeneous, and, after photobleaching, recovery appeared to occur homogeneously throughout the region. After photobleaching within our regions of interest, GFP fluorescence appeared homogeneous throughout the bleach region within τ ≈ 50 ms (Supplemental Figure S1). We can estimate the corresponding diffusion constant as D ≈ r2/τ, yielding D ≈ 20 μm2/s (see Supplementary Materials), which is in agreement with previously published results. Hence, given the small diameter of our bleach zone, the rapidity of diffusive recovery, and the sampling rate of our experiments (1 frame/s), we can neglect any spatial dependence of fluorescence in the region of interest for proteins freely diffusing in the cytoplasm or through the actin mesh, in contrast to the analysis presented in Tardy et al. (1995), which examined many-times-larger bleach zones.
From the homogeneity of the fluorescence signal of freely diffusing proteins, we can furthermore conclude that within the region of interest the dynamics of protein exchange between the cortex and the cytosol occurs on significantly slower time scales than diffusion in the cytosol. From observation of images of the cortex immediately after photobleaching (Figure 2A), we also conclude that the density of fluorescent proteins freely diffusing through the cortical mesh is the same as in the cytoplasm and recovers rapidly after photobleaching. Hence subtracting the fluorescence from the cytoplasm (appropriately normalized to account for the mismatch in size between the cortical and the cytoplasmic parts of the region of interest) from the total cortical fluorescence gives the fluorescence of proteins bound to the cortex only (Supplemental Figures S2 and S3).
Close examination of cortical fluorescence recovery and loss curves suggested that they could be well described by a sum of n exponential functions (Figure 2 and Supplemental Figure S4). Consequently, we could quantify our data by simply giving the corresponding n time scales τi. Alternatively, the data can be quantified in terms of n independent first-order processes. Each of these processes effectively represents a mechanism of how the protein of interest shuttles between the cortex and the cytoplasm. We will now give a formal description of this approach and show that the dissociation rates ωd,i are directly given by the inverse of the time scales, ωd,i = 1/τd,i, whereas some more information is needed to infer the association rates ωa,i Note that molecular information is not required to infer the values of the various rates. Still, by observing changes in the association and dissociations rates upon drug treatment or genetic modifications, we can characterize the molecular processes underlying cortex turnover.
Let Fi denote the fluorescence associated with cortical molecules in the region of interest that turn over through processes i = 1,…n. Then
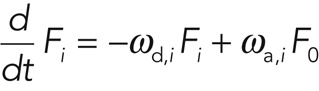 (1) (1)
|
with F0 being the fluorescence of freely diffusing molecules in the cortex region. Owing to the fast diffusive exchange with the cytoplasm and the small overall fraction of proteins that are bleached or photoactivated, F0 in Eq. 1 can be taken as constant. In steady state, the rates ωd,i and ωa,i are tightly coupled, as we have ωd,i Fi = ωa,iF0. Hence, in the following, we report only the values of the dissociation rates ωd,i as a measure for protein turnover associated with the respective processes.
The solution to Eq. 1 is
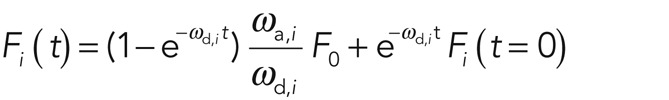 (2) (2)
|
In an ideal FRAP scenario, Fi(t = 0) = 0, whereas for FLAP, F0 = 0. The total fluorescence from cortical molecules is then  . In steady state, the relative abundance of molecules participating in process i is given by
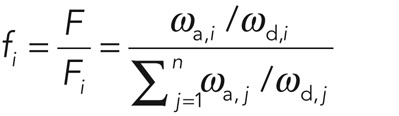 (3) (3)
|
The values of ωd,i and fi are obtained directly from fitting the function  to the experimental data. Knowing the total fluorescence F of cortical F-actin and F0 of the cytoplasm, we can also determine the effective association rate ωa,i through
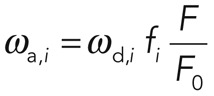 (4) (4)
|
In practice, functions F with increasing n were fitted to the FRAP and FLAP curves by adjusting the values of Fi (t = 0), ωa,iF0, and ωd,i using custom-written Matlab routines (MathWorks, Natick, MA) until three conditions were met: the goodness of fit estimated by the coefficient of determination r2 no longer increased, the total change in fluorescence associated with process n was <10–5, and the sum of squared errors no longer decreased. In our experiments, the order n of the fit functions was the same for all curves, corresponding to a specific experimental condition. An example of this procedure is presented in the Supplementary Materials (Supplementary Figure S10).
In experiments, the measured dissociation rates ωd,i have two contributions: one resulting from protein turnover, the other from photobleaching due to imaging. We corrected the measured rates by subtracting the bleach rate obtained from a single-exponential fit to the fluorescence loss curve that was obtained as described in the description of the FRAP and FLAP protocols. In all cases, the correction due to bleaching was within the error bars of the measured dissociation rate.
To visualize the different processes participating in turnover, as well as the effects of drug treatment and genetic perturbations on them, we produced logarithmic plots of the second derivative of F. We refer to these as logarithmic acceleration plots. They consist essentially of piecewise-linear segments with each segment corresponding to a different process. The slopes of these segments are, respectively, –ωd,i (see Supplementary Materials).
We can relate the measured effective rates ωa,i and ωd,i to molecular reaction rates. In the case of actin binding proteins, 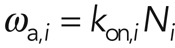 , where kon,i is the association rate of a molecule to a binding site and
  is the number of available binding sites along actin filaments. This expression holds as long as the binding sites are far from being saturated and binding is not cooperative. The rate ωd,i can be directly interpreted as a molecular dissociation rate koff,i. For actin turnover, monomer association is restricted to filament barbed ends, and therefore we can write ωa,i = kon,iNi, where Ni is the number of actin barbed ends participating in process i and kon,i is the rate of monomer addition to a single filament for process i. Furthermore, we can use the steady-state condition to relate ωd,i to the rate koff,i of monomer removal from a single filament in subpopulation i. Because the number of plus ends equals the number of filament minus ends, we can write
 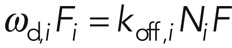 , with
  the population-averaged fluorescence of an individual monomer. Note that although there is a strong relation between the molecular rates and the filament length distribution, knowledge of the latter is not necessary to interpret the rates/processes. The rates ωa,i and ωd,i and thus kon,i and koff,i could result from several processes occurring on similar time scales. For example, for koff,i, severing and pointed-end depolymerization could both contribute. Changes in the relative importance of these processes would lead to changes in the length distribution but not the value of ωd,i and ωa,i.
For comparison with previous studies, we report also the half-time t1/2 after which half of the fluorescence has been recovered or lost as a rough, model-free quantification of our data.
Supplementary Material
Acknowledgments
We thank M. Bovellan, E. Moeendarbary, and R. Thorogate for technical support and C. Erlenkämper, E. Paluch, and G. Salbreux for discussions, along with J. R. Bamburg, L. Cramer, M. Murata Hori, D. Ory, and N. Watanabe for their kind gifts of reagents.
Abbreviations used:
- DCS
double charcoal-stripped
- FCS
fetal calf serum
- FITC
fluorescein isothiocyanate
- FLAP
fluorescence loss after photoactivation
- FRAP
fluorescence recovery after photobleaching
- GFP
green fluorescent protein
- MEM
minimum essential medium
- MRLC
myosin regulatory light chain
- PAGFP
photoactivatable green fluorescent protein
- RFP
red fluorescent protein
- YFP
yellow fluorescent protein
Footnotes
This article was published online ahead of print in MBoC in Press (http://www.molbiolcell.org/cgi/doi/10.1091/mbc.E12-06-0485) on January 23, 2013.
*Deceased.
REFERENCES
- Alberts B, Bray D, Lewis J, Raff M, Roberts K, Watson J. Molecular Biology of the Cell. New York: Taylor and Francis; 2004. [Google Scholar]
- Bai M, Missel AR, Levine AJ, Klug WS. On the role of the filament length distribution in the mechanics of semiflexible networks. Acta Biomater. 2011;7:2109–2118. doi: 10.1016/j.actbio.2010.12.025. [DOI] [PubMed] [Google Scholar]
- Bernstein BW, Bamburg JR. ADF/cofilin: a functional node in cell biology. Trends Cell Biol. 2010;20:187–195. doi: 10.1016/j.tcb.2010.01.001. [DOI] [PMC free article] [PubMed] [Google Scholar]
- Bray D, White JG. Cortical flow in animal cells. Science. 1988;239:883–888. doi: 10.1126/science.3277283. [DOI] [PubMed] [Google Scholar]
- Casella JF, Flanagan MD, Lin S. Cytochalasin D inhibits actin polymerization and induces depolymerization of actin filaments formed during platelet shape change. 1981;293:302–305. doi: 10.1038/293302a0. [DOI] [PubMed] [Google Scholar]
- Charras GT. A short history of blebbing. J Microsc. 2008;231:466–478. doi: 10.1111/j.1365-2818.2008.02059.x. [DOI] [PubMed] [Google Scholar]
- Charras GT, Coughlin M, Mitchison TJ, Mahadevan L. Life and time of a cellular bleb. Biophys J. 2008;94:1836–1853. doi: 10.1529/biophysj.107.113605. [DOI] [PMC free article] [PubMed] [Google Scholar]
- Charras GT, Hu C, Coughlin M, Mitchison TJ. Reassembly of contractile actin cortex in cell blebs. J Cell Biol. 2006;175:477–490. doi: 10.1083/jcb.200602085. [DOI] [PMC free article] [PubMed] [Google Scholar]
- Craig R, Greene L, Eisenberg E. Structure of the actin-myosin complex in the presence of ATP. Proc Natl Acad Sci USA. 1985;82:3247–3251. doi: 10.1073/pnas.82.10.3247. [DOI] [PMC free article] [PubMed] [Google Scholar]
- Cunningham C, Gorlin C, Kwiatkowski J, Hartwig D, Janmey P, Byers H, Stossel R. Actin-binding protein requirement for cortical stability and efficient locomotion. Science. 1992;255:325–327. doi: 10.1126/science.1549777. [DOI] [PubMed] [Google Scholar]
- Dos Remedios CG, Chhabra D, Kekic M, Dedova IV, Tsubakihara M, Berry DA, Nosworthy NJ. Actin binding proteins: regulation of cytoskeletal microfilaments. Physiol Rev. 2003;83:433–473. doi: 10.1152/physrev.00026.2002. [DOI] [PubMed] [Google Scholar]
- Gardel ML, Shin JH, MacKintosh FC, Mahadevan L, Matsudaira P, Weitz DA. Elastic behavior of cross-linked and bundled actin networks. Science. 2004;304:1301–1305. doi: 10.1126/science.1095087. [DOI] [PubMed] [Google Scholar]
- Ghosh M, Song X, Mouneimne G, Sidani M, Lawrence DS, Condeelis JS. Cofilin promotes actin polymerization and defines the direction of cell motility. Science. 2004;304:743–746. doi: 10.1126/science.1094561. [DOI] [PubMed] [Google Scholar]
- Jacobson K, Rajfur Z, Vitriol E, Hahn K. Chromophore-assisted laser inactivation in cell biology. Trends Cell Biol. 2008;18:443–450. doi: 10.1016/j.tcb.2008.07.001. [DOI] [PMC free article] [PubMed] [Google Scholar]
- Kasza KE, Broedersz CP, Koenderink GH, Lin YC, Messner W, Millman EA, Nakamura F, Stossel TP, Mackintosh FC, Weitz DA. Actin filament length tunes elasticity of flexibly cross-linked actin networks. Biophys J. 2010;99:1091–1100. doi: 10.1016/j.bpj.2010.06.025. [DOI] [PMC free article] [PubMed] [Google Scholar]
- Kovar DR, Harris ES, Higgs RM, Higgs H, Pollard TD. Control of the assembly of ATP- and ADP-actin by formins and profilin. Cell. 2006;124:423–435. doi: 10.1016/j.cell.2005.11.038. [DOI] [PubMed] [Google Scholar]
- Kueh HY, Charras GT, Mitchison TJ, Brieher WM. Actin disassembly by cofilin, coronin, and Aip1 occurs in bursts and is inhibited by barbed-end cappers. J Cell Biol. 2008;182:341–353. doi: 10.1083/jcb.200801027. [DOI] [PMC free article] [PubMed] [Google Scholar]
- Lai FP, Szczodrak M, Block J, Faix J, Breitsprecher D, Mannherz HG, Stradal TE B, Dunn GA, Small JV, Rottner K. Arp2/3 complex interactions and actin network turnover in lamellipodia. EMBO J. 2008;27:982–992. doi: 10.1038/emboj.2008.34. [DOI] [PMC free article] [PubMed] [Google Scholar]
- MacKintosh FC, Käs J, Janmey PA. Elasticity of semiflexible biopolymer networks. Phys Rev Lett. 1995;75:4425–4428. doi: 10.1103/PhysRevLett.75.4425. [DOI] [PubMed] [Google Scholar]
- MacLean-Fletcher S, Pollard TD. Mechanism of action of cytochalasin B on actin. Cell. 1980;20:329–341. doi: 10.1016/0092-8674(80)90619-4. [DOI] [PubMed] [Google Scholar]
- McGrath JL, Tardy Y, Dewey CF, Meister JJ, Hartwig JH. Simultaneous measurements of actin filament turnover, filament fraction and monomer diffusion in endothelial cells. Biophys J. 1998;175:2070–2078. doi: 10.1016/S0006-3495(98)77649-0. [DOI] [PMC free article] [PubMed] [Google Scholar]
- Meyer RK, Aebi U. Bundling of actin-filaments by alpha-actinin depends on its molecular length. J Cell Biol. 1990;110:2013–2024. doi: 10.1083/jcb.110.6.2013. [DOI] [PMC free article] [PubMed] [Google Scholar]
- Michelot A, Drubin DG. Building distinct actin filament networks in a common cytoplasm. Curr Biol. 2011;21:R560–R569. doi: 10.1016/j.cub.2011.06.019. [DOI] [PMC free article] [PubMed] [Google Scholar]
- Mizuno D, Tardin C, Schmidt CF, Mackintosh FC. Nonequilibrium mechanics of active cytoskeletal networks. Science. 2007;31:370–373. doi: 10.1126/science.1134404. [DOI] [PubMed] [Google Scholar]
- Morone N, Fujiwara T, Murase K, Kasai RS, Ike H, Yuasa S, Usukura J, Kusumi A. Three-dimensional reconstruction of the membrane skeleton at the plasma membrane interface by electron tomography. J Cell Biol. 2006;174:851–862. doi: 10.1083/jcb.200606007. [DOI] [PMC free article] [PubMed] [Google Scholar]
- Morton WM, Ayscough KR, McLaughlin PJ. Latrunculin alters the actin-monomer subunit interface to prevent polymerization. Nat Cell Biol. 2000;2:376–378. doi: 10.1038/35014075. [DOI] [PubMed] [Google Scholar]
- Mseka T, Bamburg JR, Cramer LP. ADF/cofilin family proteins control formation of oriented actin-filament bundles in the cell body to trigger fibroblast polarization. J Cell Sci. 2007;120:4332–4344. doi: 10.1242/jcs.017640. [DOI] [PubMed] [Google Scholar]
- Mukhina S, Wang Y, Murata-Hori M. Alpha-actinin is required for tightly regulated remodeling of the actin cortical network during cytokinesis. Dev Cell. 2007;13:554–565. doi: 10.1016/j.devcel.2007.08.003. [DOI] [PMC free article] [PubMed] [Google Scholar]
- Murthy K, Wadsworth P. Myosin-II-dependent localization and dynamics of F-actin during cytokinesis. Curr Biol. 2005;15:724–731. doi: 10.1016/j.cub.2005.02.055. [DOI] [PubMed] [Google Scholar]
- Paluch E, Sykes C, Prost J, Bornens M. Dynamic modes of the cortical actomyosin gel during cell locomotion and division. Trends Cell Biol. 2006;16:5–10. doi: 10.1016/j.tcb.2005.11.003. [DOI] [PubMed] [Google Scholar]
- Reymann A-C, Suarez C, Guérin C, Martiel J-L, Staiger CJ, Blanchoin L, Boujemaa-Paterski R. Turnover of branched actin filament networks by stochastic fragmentation with ADF/cofilin. Mol Biol Cell. 2011;22:2541–2550. doi: 10.1091/mbc.E11-01-0052. [DOI] [PMC free article] [PubMed] [Google Scholar]
- Rizvi SA, Neidt EM, Cui J, Feiger Z, Skau CT, Gardel ML, Kozmin SA, Kovar DR. Identification and characterisation of a small molecule inhibitor of formin-mediated actin assembly. Chem Biol. 2009;16:1158–1168. doi: 10.1016/j.chembiol.2009.10.006. [DOI] [PMC free article] [PubMed] [Google Scholar]
- Romero S, Le Clainche C, Didry D, Egile C, Pantaloni D, Carlier MF. Formin is a processive motor that requires profilin to accelerate actin assembly and associated ATP hydrolysis. Cell. 2004;119:419–429. doi: 10.1016/j.cell.2004.09.039. [DOI] [PubMed] [Google Scholar]
- Sato M, Schwartz W, Pollard T. Dependence of the mechanical properties of actin/a-actinin gels on deformation rate. Nature. 1987;325:828–830. doi: 10.1038/325828a0. [DOI] [PubMed] [Google Scholar]
- Sept D, McCammon JA. Thermodynamics and kinetics of actin filament nucleation. Biophys J. 2001;81:667–674. doi: 10.1016/S0006-3495(01)75731-1. [DOI] [PMC free article] [PubMed] [Google Scholar]
- Sprague BL, Pego RL, Stavreva DA, McNally GA. Analysis of binding reactions by fluorescence recovery after photobleaching. Biophys J. 2004;86:3473–3495. doi: 10.1529/biophysj.103.026765. [DOI] [PMC free article] [PubMed] [Google Scholar]
- Stewart MP, Helenius J, Toyoda Y, Ramanathan SP, Muller DJ, Hyman AA. Hydrostatic pressure and the actomyosin cortex drive mitotic cell rounding. Nature. 2011;469:226–230. doi: 10.1038/nature09642. [DOI] [PubMed] [Google Scholar]
- Svitkina TM, Verkhovsky AB, McQuade KM, Borisy GG. Analysis of the actin-myosin II system in fish epidermal keratocytes: mechanism of cell body translocation. J Cell Biol. 1997;139:397–415. doi: 10.1083/jcb.139.2.397. [DOI] [PMC free article] [PubMed] [Google Scholar]
- Tardy Y, McGrath JL, Hartwig JH, Dewey CF. Interpreting photoactivated fluorescence microscopy measurements of steady-state actin dynamics. Biophys J. 1995;69:1674–1682. doi: 10.1016/S0006-3495(95)80085-8. [DOI] [PMC free article] [PubMed] [Google Scholar]
- Tinevez J, Schulze U, Salbreux G, Roensch J, Joanny JF, Paluch E. Role of cortical tension in bleb growth. Proc Natl Acad Sci USA. 2009;106:18581–18586. doi: 10.1073/pnas.0903353106. [DOI] [PMC free article] [PubMed] [Google Scholar]
- Uehara R, Goshima G, Mabuchi I, Vale RD, Spudich JA, Griffis ER. Determinants of myosin II cortical localization during cytokinesis. Curr Biol. 2010;20:1080–1085. doi: 10.1016/j.cub.2010.04.058. [DOI] [PMC free article] [PubMed] [Google Scholar]
- Van Citters KM, Hoffman BD, Massiera G, Crocker JC. The role of F-actin and myosin in epithelial cell rheology. Biophys J. 2006;91:3946–3956. doi: 10.1529/biophysj.106.091264. [DOI] [PMC free article] [PubMed] [Google Scholar]
- Watanabe N. Inside view of cell locomotion through single-molecule: fast F-/G-actin cycle and G-actin regulation of polymer restoration. Proc Jpn Acad B Phys Biol Sci. 2010;86:62–83. doi: 10.2183/pjab.86.62. [DOI] [PMC free article] [PubMed] [Google Scholar]
- Wilson CA, Tsuchida MA, Allen GA, Barnhart EL, Applegate KT, Yam PT, Ji L, Keren K, Danuser G, Theriot JA. Myosin II contributes to cell-scale actin network treadmilling through network disassembly. Nature. 2010;465:373–377. doi: 10.1038/nature08994. [DOI] [PMC free article] [PubMed] [Google Scholar]
- Wottawah F, Schinkinger S, Lincoln B, Ananthakrishnan R, Romeyke M, Guck J, Käs J. Optical rheology of biological cells. Phys Rev Lett. 2005;94:098103. doi: 10.1103/PhysRevLett.94.098103. [DOI] [PubMed] [Google Scholar]
- Yarmola EG, Somasundaram T, Boring TA, Spector I, Bubb MR. Actin-latrunculin A structure and function. Differential modulation of actin-binding protein function by latrunculin A. J Biol Chem. 2000;275:28120–28127. doi: 10.1074/jbc.M004253200. [DOI] [PubMed] [Google Scholar]
- Zhou M, Wang Y. Distinct pathways for the early recruitment of myosin II and actin to the cytokinetic furrow. Mol Biol Cell. 2008;19:318–326. doi: 10.1091/mbc.E07-08-0783. [DOI] [PMC free article] [PubMed] [Google Scholar]
Associated Data
This section collects any data citations, data availability statements, or supplementary materials included in this article.