

Sphingolipids are membrane components and signaling molecules. Nutrient-sensitive TORC1 inhibition stimulates the kinase Npr1 to phosphorylate Orm proteins and thereby up-regulate complex sphingolipid synthesis. This appears to be a physiological response to starvation to up-regulate the nutrient-scavenging permease Gap1.
Abstract
The evolutionarily conserved Orm1 and Orm2 proteins mediate sphingolipid homeostasis. However, the homologous Orm proteins and the signaling pathways modulating their phosphorylation and function are incompletely characterized. Here we demonstrate that inhibition of nutrient-sensitive target of rapamycin complex 1 (TORC1) stimulates Orm phosphorylation and synthesis of complex sphingolipids in Saccharomyces cerevisiae. TORC1 inhibition activates the kinase Npr1 that directly phosphorylates and activates the Orm proteins. Npr1-phosphorylated Orm1 and Orm2 stimulate de novo synthesis of complex sphingolipids downstream of serine palmitoyltransferase. Complex sphingolipids in turn stimulate plasma membrane localization and activity of the nutrient scavenging general amino acid permease 1. Thus activation of Orm and complex sphingolipid synthesis upon TORC1 inhibition is a physiological response to starvation.
INTRODUCTION
Target of rapamycin (TOR) is a highly conserved serine/threonine kinase that controls cell growth in response to nutrients. TOR is found in two structurally and functionally distinct complexes termed TOR complex 1 (TORC1) and TORC2 (Loewith et al., 2002; Wedaman et al., 2003; Wullschleger et al., 2006). Rapamycin-sensitive TORC1 controls cell growth in response to nutrients by promoting anabolic processes such as translation and ribosome biogenesis and by antagonizing catabolic processes such as autophagy and mRNA degradation (De Virgilio and Loewith, 2006; Loewith and Hall, 2011). In yeast, TORC1 also regulates the abundance and activity of amino acid permeases. When cells are grown in nutrient-rich medium, TORC1 maintains several highly specific amino acid permeases—for example, the tryptophan permease Tat2 (Beck et al., 1999). On TORC1 inhibition, by rapamycin treatment or nutrient deprivation, the specific permeases are turned over and replaced by the general amino acid permease 1 (Gap1). Replacement of several distinct permeases by Gap1 enables cells to optimize nutrient uptake and energy consumption during nutrient stress (Roberg et al., 1997; Beck et al., 1999). TORC1 inhibits export and stability of Gap1 via phosphorylation and inhibition of the serine/threonine kinase Npr1 (Schmidt et al., 1998; De Craene et al., 2001). However, the molecular mechanism by which Npr1 promotes Gap1 export and stability remains incompletely characterized.
Sphingolipids are structural components of membranes and signaling molecules (Hannun and Obeid, 2008). The first and rate-limiting step in de novo synthesis of sphingolipids is the condensation of l-serine and fatty acid-CoA at the endoplasmic reticulum (ER) to produce long-chain bases (LCBs; Figure 1). This reaction is catalyzed by serine palmitoyltransferase (SPT), a multiprotein complex consisting of Lcb1, Lcb2, and Tsc3 (Nagiec et al., 1994; Gable et al., 2000). LCBs, including dihydrosphingosine (DHS) and phytosphingosine (PHS), are in turn acylated to form ceramides (Guillas et al., 2001; Schorling et al., 2001; Vallee and Riezman, 2005). Ceramides are transported to the Golgi for further modification to generate complex sphingolipids such as inositol phosphorylceramide (IPC) and mannosyl IPC (MIPC). In yeast, LCBs transiently increase in response to heat stress and are required for the response to this stress (Dickson et al., 1997; Jenkins et al., 1997; Skrzypek et al., 1999; Zhang et al., 2001; Meier et al., 2006). De novo sphingolipid synthesis is also required for nutrient stress responses, including appearance of Gap1 at the plasma membrane (PM; Lauwers et al., 2007), but it is unknown whether nutrients control synthesis of sphingolipids.
FIGURE 1:
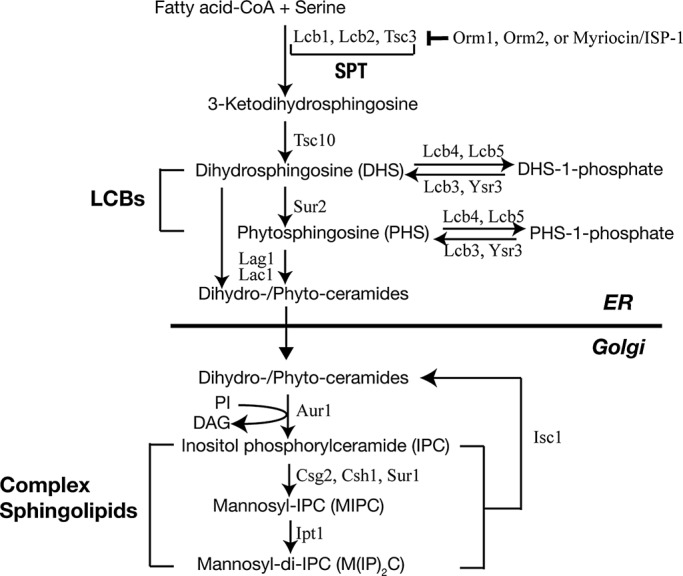
Schematic diagram of de novo sphingolipid biosynthesis in yeast.
Several lines of evidence suggest that sphingolipid synthesis and the TOR signaling pathway are functionally linked in yeast. A screen for suppressors of a csg2 mutation, conferring a defect in complex sphingolipid synthesis, identified TOR2 and AVO3/TSC10, both of which encode components of TORC2 (Beeler et al., 1998). Conversely, a screen for high-copy suppressors of a TOR2 defect yielded SUR1, encoding a subunit of MIPC synthetase (Helliwell et al., 1998). Aronova et al. (2008) subsequently showed that TORC2 positively regulates ceramide production. More recent findings suggest that TORC2 mediates sphingolipid homeostasis via Orm proteins (Breslow et al., 2010; Roelants et al., 2011). Thus at least TORC2 appears to control sphingolipids synthesis.
The Orm proteins are an evolutionarily conserved family of ER transmembrane proteins that mediate sphingolipid homeostasis (Breslow et al., 2010). In yeast and likely in mammals, an Orm1–Orm2 complex binds and inhibits SPT (Figure 1; Breslow et al., 2010; Han et al., 2010). Orm1 and Orm2 are phosphorylated and thereby inhibited in response to sphingolipid depletion caused, for example, by treatment with a low concentration of the SPT inhibitor myriocin/ISP-1. Myriocin induces phosphorylation of Ser-51, Ser-52, or Ser-53 in Orm1 and Ser-46, Ser-47, or Ser-48 in Orm2 (Breslow et al., 2010; Roelants et al., 2011). On Orm inhibition, SPT is activated, and cells restore sphingolipid levels (Breslow et al., 2010). Sphingolipid depletion by myriocin activates TORC2 and its downstream AGC kinase Ypk1, which directly phosphorylates and inhibits Orm (Roelants et al., 2011; Berchtold et al., 2012). Thus TORC2 stimulates sphingolipid synthesis. Orm2 is also transiently phosphorylated and inactivated by Ypk1 in response to heat stress (Sun et al., 2012), causing an increase in LCBs required for the heat stress response (Dickson et al., 1997; Jenkins et al., 1997). In addition, TORC1 inhibition (rapamycin treatment) leads to Orm1 phosphorylation, but at sites distinct from those phosphorylated upon TORC2 activation (Huber et al., 2009; Soulard et al., 2010). This suggests that TORC1 signaling, independent of TORC2, also regulates Orm and sphingolipid metabolism.
Here we show that the TORC1 indeed controls the Orm proteins and consequently sphingolipid synthesis independent of TORC2. Rapamycin-triggered Orm phosphorylation does not affect SPT activity but instead increases de novo synthesis specifically of complex sphingolipids. Thus, whereas TORC2 inhibition reduces sphingolipid synthesis, TORC1 inhibition stimulates synthesis of complex sphingolipids downstream of SPT. TORC1 controls Orm phosphorylation via the starvation-activated kinase Npr1. Npr1 phosphorylation of Orm stimulates de novo synthesis of complex sphingolipids and appearance of Gap1 at the PM. Thus TORC1 controls Orm and sphingolipid synthesis as a part of an adaptive response to nutrient stress.
RESULTS
TORC1 inhibition stimulates Orm phosphorylation
Two phosphoproteomic studies suggested that Orm1 phosphorylation increases upon TORC1 inhibition (rapamycin treatment; Huber et al., 2009; Soulard et al., 2010). To confirm this observation and to investigate whether rapamycin also affects Orm2 phosphorylation, we examined Orm phosphorylation by immunoblotting cellular extracts resolved by phospho–affinity gel electrophoresis (Kinoshita et al., 2006). Rapamycin increased phosphorylation of both Orm1 and Orm2 in a TORC1-sensitive manner (Figure 2, A and B, and Supplemental Figure S1A). Inactivation of TORC1 by nitrogen starvation also triggered Orm phosphorylation, suggesting that the effect of rapamycin is physiologically relevant (Figure 2C and Supplemental Figure S1B). Conversely, cycloheximide (CHX), which increases intracellular pools of free amino acids and thereby activates TORC1 (Binda et al., 2009), decreased Orm phosphorylation (Figure 2D). Thus TORC1 inhibits phosphorylation of both Orm1 and Orm2 in response to nutrients.
FIGURE 2:

TORC1 negatively regulates Orm phosphorylation. (A, B) Immunoblot analysis of Orm1 (A) and Orm2 (B) phosphorylation in wild-type (WT), tor1∆, and rapamycin-resistant TOR (TORRR) cells. Growing cells expressing HA-Orm proteins were treated with rapamycin (200 ng/ml) for 1 h. The total lysates were resolved by a phospho–affinity gel and conventional SDS–PAGE gels and analyzed by Immunoblot against HA and actin, a loading control. TB50a was used as a mock control. (C) Immunoblot analysis of Orm phosphorylation upon nitrogen starvation. Growing cells expressing HA-Orm1 or HA-Orm2 were shifted to nitrogen-free medium (SD-N) and cultured for 1 h. The total lysates were analyzed as described in A and B. (D) Immunoblot analysis of Orm phosphorylation after 1-h treatment of cycloheximide (CHX, 25 μg/ml) with or without cotreatment of rapamycin. The total lysates prepared from FLAG-Orm1– or FLAG-Orm2–expressing cells were analyzed as in A and B, except that a FLAG antibody was used.
TORC1 does not control SPT activity
The finding that TORC1 controls Orm phosphorylation prompted us to investigate whether TORC1 regulates SPT. Myriocin triggers Orm phosphorylation, dissociation of Orm oligomers, and reduced Orm2 cortical-ER (cER) localization, thereby inhibiting Orm. Orm inhibition in turn leads to SPT activation (Breslow et al., 2010). We asked whether rapamycin-triggered Orm phosphorylation has similar effects. Contrary to what was observed with myriocin (Breslow et al., 2010), rapamycin treatment had only mild effect on the integrity of Orm oligomers and no effect on cER localization of GFP-Orm (Figure 3, A and B, and Supplemental Figure S2A). Furthermore, TORC1 inhibition had no effect on the interaction of Orm with SPT or Sac1 (phospatidylinositol-4-phosphate phosphatase; Supplemental Figure S2, B and C). Orm had been shown to associate with Sac1, although the functional significance of this interaction is unknown (Breslow et al., 2010). Rapamycin had no effect on de novo synthesis of LCBs and ceramides in vivo (Figure 3C). Finally, rapamycin had no effect on SPT activity, as measured by incorporation of [3H]serine into LCBs in vitro (Figure 3D). Thus TORC1 does not regulate SPT activity, although TORC1 inhibition causes Orm phosphorylation.
FIGURE 3:

TORC1 inhibition increases de novo synthesis of complex sphingolipids downstream of SPT. (A) Coimmunoprecipitation analysis of Orm1 and Orm2. Immunoprecipitation of FLAG-Orm1 and Orm2 was performed as described in Materials and Methods. Immunoprecipitated proteins were analyzed by Immunoblot as in Figure 2. (B) Confocal microscopic analyses of GFP-Orm2 with (+) or without (–) 200 ng/ml rapamycin treatment for 1 h. Sec63-mCherry was used as a marker for ER localization. Arrows indicate cER. (C) TLC analysis of [3H]serine-labeled sphingolipids. Growing cells were treated with (+) or without (–) 200 ng/ml rapamycin for 1 h and labeled with [3H]serine for 30 min. The extracted lipids were subjected to mild alkaline hydrolysis and separated by TLC. Sphingolipid profiles of myriocin-treated WT cells and csg2∆ cells were used to identify sphingolipids and IPCs/MIPCs, respectively. Ceramides, DHS, and PHS were identified by mobility of respective standard lipid species on TLC. DHS, dihydrosphingosine; IPCs, inositol phosphorylceramides; MIPCs, mannosyl IPCs; PHS, phytosphingosine. *Unidentified myriocin-insensitive lipids. (D) in vitro SPT assay. SPT activity was measured by incorporation of [3H]serine into 3-ketosphinganine as described in Materials and Methods. (E) Quantification of [3H]serine-labeled MIPCs (mean ± SEM) in Figure 3C. *p < 0.05. (F) Serine uptake assay in rapamycin-treated and untreated cells. Cells were treated with rapamycin and labeled with [3H]serine as in C. Incorporation of [3H]serine was measured by a scintillation counter. Data are presented as mean ± SEM. (G) Quantification of [3H]DHS-labeled MIPCs (mean ± SEM). Cells were treated with rapamycin and labeled with [3H]DHS as in C. **p < 0.01. (H) TLC analysis of [3H]serine-labeled sphingolipids in WT and orm1∆orm2∆ cells. The [3H]serine labeling, lipid preparation, and TLC were performed as in C. *Unidentified myriocin-insensitive lipids.
TORC1 negatively controls synthesis of complex sphingolipids
On measuring de novo sphingolipid synthesis by [3H]serine incorporation, we unexpectedly observed a ∼60% increase in IPCs and in MIPCs in rapamycin-treated cells (Figure 3, C and E, and Supplemental Figure S3A). The increase in complex sphingolipids was not due to increased uptake of [3H]serine (Figure 3F and Supplemental Figure S3A) or decreased turnover of IPCs and MIPCs (Supplemental Figure S3B). Decreased turnover was ruled out because rapamycin still enhanced IPC and MIPC levels in cells deleted for ISC1, encoding inositol phosphosphingolipid phospholipase that cleaves IPCs and MIPCs (Figure 1 and Supplemental Figure S3B). The ∼60% increase in de novo synthesis of complex sphingolipids was confirmed by measuring incorporation of [3H]DHS (Figure 3G and Supplemental Figure S3C). Because DHS enters the sphingolipid biosynthesis pathway below SPT, the rapamycin-induced increase observed upon [3H]DHS labeling suggests that TORC1 inhibition stimulates complex sphingolipid synthesis at a later step than SPT. Thus TORC1 inhibition triggers de novo synthesis of complex sphingolipids.
Orm is required for de novo synthesis of complex sphingolipids
The foregoing indicates that TORC1 inhibition leads to Orm phosphorylation and enhanced synthesis of complex sphingolipids. Does Orm have a role in the synthesis of complex sphingolipids? To address this question, we examined the effect of loss of Orm1 and Orm2 on synthesis of complex sphingolipids. An orm1∆ orm2∆ strain displayed significantly reduced amounts of complex sphingolipids (IPCs and MIPCs), as measured by incorporation of [3H]serine (Figure 3H), as well as of [3H]DHS (Supplemental Figure S3C). This suggests that Orm has a positive role in the synthesis of complex sphingolipids downstream of SPT. The orm1∆ orm2∆ strain also exhibited elevated levels of LCBs and ceramides (Figure 3H). The accumulation of elevated levels of LCBs and ceramides is consistent with the previously described role of Orm as a negative regulator of SPT but can also be explained by loss of Orm-dependent synthesis of complex sphingolipids downstream of SPT. These finding suggest that Orm has two separate functions in sphingolipid metabolism—inhibition of SPT and activation of complex sphingolipid synthesis.
TORC1 inhibits complex sphingolipid synthesis via inhibition of Orm
Does TORC1 control synthesis of complex sphingolipids via Orm phosphorylation? To answer this question, we first determined the rapamycin-dependent phosphorylation sites in Orm1 and Orm2. Previous studies describing the rapamycin sensitive phosphoproteome reported only Orm1 phosphorylation (Huber et al., 2009; Soulard et al., 2010). FLAG-Orm proteins were purified from cells grown in the presence or absence of rapamycin, trypsinized, and analyzed by mass spectrometry. Confirming previous studies, rapamycin induced single, double, or triple phosphorylation of Orm1 on Ser-29, Ser-32, Ser-34, Ser-35, and/or Ser-36. We found that rapamycin also induced single or double phosphorylation of Orm2 on Ser-9, Ser-15, Thr-18, Ser-22, Ser-29, and/or Ser-31 (Figure 4, A and B, and Supplemental Figure S4, A and B). These Orm1 and Orm2 phosphorylation sites are distinct from the sites that are phosphorylated in response to myriocin treatment (see Introduction). Serine-to-alanine mutation of the five serines in Orm1 (orm1-5A) abolished rapamycin-triggered phosphorylation of Orm1 (Figure 4C). Similarly, conversion of the six Ser/Thr sites in Orm2 in combination with the previously identified phosphosite Thr-36 (Breslow et al., 2010) to alanine (orm2-7A) prevented rapamycin-induced phosphorylation of Orm2 (Figure 4D). Orm1-5A and Orm2-7A were still phosphorylated in response to myriocin (Figure 4, E and F). Conversely, mutation of the sites in Orm1 (orm1-3A) and Orm2 (orm2-3A) that are phosphorylated in response to myriocin had no effect on rapamycin-induced phosphorylation (Figure 4, C and D). These findings suggest that TORC1 (rapamycin) controls Orm phosphorylation and sphingolipid synthesis via a mechanism distinct from that of TORC2 (myriocin).
FIGURE 4:

TORC1 inhibition promotes de novo complex sphingolipid synthesis via Orm phosphorylation. (A, B) An N-terminal peptide sequence of Orm1 (A) and Orm2 (B). The phosphodeficient mutations are highlighted in red. (C) Immunoblot analysis of Orm1 phosphorylation in phosphodeficient mutants of Orm1 upon rapamycin treatment. Cells expressing FLAG-Orm1 summarized in A were treated with (+) or without (–) rapamycin (200 ng/ml) for 1 h. The total lysates were analyzed as in Figure 2D. (D) Immunoblot analysis of Orm2 phosphorylation in phosphodeficient mutants of Orm2 upon rapamycin treatment. Cells expressing FLAG-Orm2 summarized in B were treated with (+) or without (–) rapamycin (200 ng/ml) for 1 h. (E, F) Immunoblot analysis of Orm1 (E) and Orm2 (F) phosphorylation in phosphodeficient mutants upon myriocin treatment. Same cells as in C and D were treated with (+) or without (–) myriocin (500 ng/ml) for 1 h. (G) TLC analysis of [3H]serine-labeled IPCs and MIPCs in WT (ORM1 ORM2) and Ala mutants in rapamycin-responsive sites (orm1-5A orm2-7A). Labeling and TLC analysis were performed as in Figure 3C, and rapamycin-triggered increase of MIPCs was quantified in a bar graph (mean ± SEM). *p < 0.05. (H) Phosphodeficient mutant alleles of Orm proteins were analyzed for growth on SD plates in the presence of myriocin. The plates were incubated at 30ºC for 3 d. (I) in vitro SPT assay. SPT activity was measured by incorporation of [3H]serine into 3-ketosphinganine as described in Materials and Methods.
To investigate whether rapamycin-triggered synthesis of complex sphingolipids is mediated by Orm phosphorylation, we examined the sphingolipid profile in orm1-5A orm2-7A cells. Rapamycin failed to stimulate synthesis of complex sphingolipids in orm1-5A orm2-7A cells (Figure 4G), as measured by incorporation of [3H]serine. Furthermore, consistent with the foregoing findings that TORC1 (rapamycin) and TORC2 (myriocin) independently affect Orm phosphorylation and sphingolipid synthesis (Figure 4, B–G), orm1-5A and orm2-7A had no effect on growth inhibition by myriocin (Figure 4H and Supplemental Figure S5) or on SPT activity as measured in vitro (Figure 4I). Thus TORC1 inhibition triggers Orm phosphorylation and thereby activates Orm to promote de novo synthesis of complex sphingolipids downstream of SPT.
TORC1 mediates Orm phosphorylation and complex sphingolipid synthesis via Npr1
What is the TORC1-inhibited (rapamycin-stimulated) kinase that phosphorylates Orm? TORC1 inhibits the Ser/Thr kinase Npr1 (Schmidt et al., 1998), and a recent phosphoproteome analysis suggested that Orm1 is phosphorylated in an Npr1-dependent manner (MacGurn et al., 2012). The observation that an orm1-5A orm2-7A mutant phenocopies an npr1∆ mutant with regard to rapamycin resistance further suggested that Npr1 and Orm are functionally related (Figure 5A; Schmidt et al., 1998; De Craene et al., 2001; MacGurn et al., 2012). Thus we investigated whether Npr1 is the rapamycin-triggered kinase that phosphorylates Orm. Rapamycin failed to stimulate Orm phosphorylation in npr1∆ cells or in cells expressing a kinase-dead version of Npr1 (npr1-K467R; Figure 5B and Supplemental Figures S4B and S6, A and B). Rapamycin also failed to stimulate Orm phosphorylation in sit4∆ cells that lack the catalytic subunit of the PP2A phosphatase responsible for Npr1 dephosphorylation and activation downstream of TORC1 (Supplemental Figure S6C; Arndt et al., 1989; Schmidt et al., 1998). To determine whether Npr1 phosphorylates Orm directly, we performed an in vitro kinase assay with native or recombinant Orm and Npr1 immunopurified from rapamycin-treated cells. Npr1, but not kinase-dead Npr1-K467R, phosphorylated native and recombinant Orm1 and Orm2 but not recombinant Orm1-5A and Orm2-7A (Figure 5, C–G). Thus Npr1 directly phosphorylates Orm1 and Orm2 downstream of TORC1.
FIGURE 5:

TORC1 mediates Orm phosphorylation and complex sphingolipid synthesis via Npr1. (A) WT, npr1∆, and phosphodeficient mutant alleles of Orm proteins were analyzed for growth on SD plates in the presence of rapamycin. The plates were incubated at 30ºC for 3 d. (B) Immunoblot analysis of Orm phosphorylation in rapamycin-treated WT or npr1∆ cells. Cells expressing HA-Orm1 or HA-Orm2 were treated with (+) or without (–) rapamycin (200 ng/ml) for 1 h. The total lysates were analyzed as in Figure 2A. (C–E) In vitro kinase assay of GST-Npr1 toward native Flag-Orm1 and -Orm2 purified from yeast (C) or N-terminal–truncated recombinant GST-Orm1 (D) and GST-Orm2 (E) as described in Materials and Methods. kd, kinase dead Npr1-K467R. (F, G) In vitro kinase assay of GST-Npr1 toward recombinant Ala mutant alleles of GST-Orm1 (F) and GST-Orm2 (G). (H, I) TLC analysis of [3H]serine (H)– or [3H]DHS (I)–labeled IPCs and MIPCs in WT and npr1∆ cells. Growing cells were treated with (+) or without (–) rapamycin for 1 h and labeled with [3H]serine (H) or [3H]DHS (I) for 30 min. The extracted lipids were subjected to mild alkaline hydrolysis and separated by TLC. The bar graphs show quantification of rapamycin-triggered increase of MIPCs (mean ± SEM). *p < 0.05, **p < 0.01.
The finding that Npr1 mediates rapamycin-induced phosphorylation of Orm suggests that Npr1 controls complex sphingolipid synthesis. To investigate this possibility, we examined incorporation of [3H]serine or [3H]DHS in rapamycin-treated npr1∆ cells (Figure 5, H and I). Rapamycin failed to stimulate incorporation of either label in Npr1-deficient cells. Thus TORC1 inhibition activates Npr1 kinase, which directly phosphorylates Orm to promote de novo synthesis of complex sphingolipids.
Npr1-mediated Orm phosphorylation enhances Gap1 localization and activity
What is the physiological significance of Npr1-mediated Orm phosphorylation and complex sphingolipid synthesis? Npr1 promotes PM localization and stabilization of the general amino acid permease Gap1 in response to nutrient limitation (De Craene et al., 2001). Furthermore, Gap1 PM localization and stabilization require de novo synthesis of sphingolipids, most likely ceramides or complex sphingolipids (Lauwers et al., 2007). These findings suggest that Npr1 is activated in nutrient-deprived (TORC1-inhibited) cells to increase de novo synthesis of complex sphingolipids and thereby to stabilize Gap1 permease at the PM. To investigate this possibility, we monitored Gap1 localization by subcellular fractionation of cells grown in nitrogen-poor conditions. Gap1 from orm1-5A orm2-7A cells was found mainly in endosomal fractions, whereas Gap1 from wild-type cells was found largely in PM fractions (Figure 6, A and B). We also visualized Gap1-GFP in live cells grown in a poor nitrogen source. Consistent with the subcellular fractionation, PM localization of Gap1-GFP was mildly reduced in orm1-5A orm2-7A cells compared with wild-type cells (Figure 6, C and D). To determine the functional consequence of reduced Gap1 at the PM, we assayed uptake of the Gap1 substrate citrulline. The rate of [14C]citrulline uptake was mildly but significantly reduced in orm1-5A orm2-7A cells compared with wild-type cells (Figure 6E). Thus Npr1-mediated Orm phosphorylation and thereby complex sphingolipid synthesis promote Gap1 PM localization and activity in response to nutrient limitation.
FIGURE 6:

Npr1-mediated Orm phosphorylation stimulates Gap1 PM localization and activity. (A) Subcellular fractionation analysis of Gap1 in Flag-ORM1 Flag-ORM2 (WT) and Flag-orm1-5A Flag-orm2-7A (orm1-5A orm2-7A) cells. Cells were grown in SD media and shifted to urea media. After 2 h of incubation, harvested cells were lysed and fractionated by ultracentrifugation on continuous 20–60% (wt/wt) sucrose gradients. The fractions were resolved by SDS–PAGE and analyzed by immunoblot against Pma1 (a plasma membrane marker), Gap1, and Pep12 (an endosomal marker). (B) Quantification of relative Gap1 in A. Data are presented as means ± SEM. (C) Microscopic analysis of Gap1-GFP in Flag-ORM1 Flag-ORM2 (WT) and Flag-orm1-5A Flag-orm2-7A (orm1-5A orm2-7A) cells. Cells were cultured in SD-N supplemented with urea for 2 h and analyzed by fluorescence microscopy. (D) Quantification of relative expression of PM Gap1-GFP. The intensities of PM GFP signals were normalized to those of total GFP signals from at least 50 cells. Data are presented as means ± SEM. ***p < 10−9. (E) The [14C]citrulline uptake in Flag-ORM1 Flag-ORM2 (WT) and Flag-orm1-5A Flag-orm2-7A (orm1-5A orm2-7A) cells. Cells were cultured in SD-N supplemented with urea and assayed for [14C]citrulline incorporation as described in Materials and Methods. The relative uptake of [14C]citrulline ± SEM respect to WT cells is shown. *p < 0.05, **p < 0.01.
DISCUSSION
Here we report that TORC1 inhibition stimulates Orm phosphorylation and de novo synthesis of complex sphingolipids (Figure 7). On TORC1 inhibition by rapamycin treatment or nutrient limitation, Npr1 phosphorylates and activates Orm1 and Orm2, which in turn promotes synthesis of complex sphingolipids downstream of SPT. The raison d’être of this response appears to be to alter cell physiology to allow the cell to better cope with nutrient limitation, as complex sphingolipids are required for up-regulation of the nutrient-scavenging permease Gap1. The negative regulation of sphingolipid synthesis by TORC1 described here is distinct from the previously reported positive regulation of sphingolipids by TORC2. On TORC2 activation by myriocin treatment or sphingolipid depletion, Ypk1 phosphorylates and inhibits the Orm1–Orm2, complex which in turn results in activation of SPT and synthesis of LCBs to restore sphingolipid levels (Roelants et al., 2011). We note that the orm1-5A orm2-7A mutant phenocopies the rapamycin resistance of an npr1 mutant, whereas the orm1-3A orm2-3A mutant phenocopies the rapamycin hypersensitivity of a ypk1 mutant (Gelperin et al., 2002), further suggesting that TORC1 and TORC2 have distinct roles in the control of Orm.
FIGURE 7:
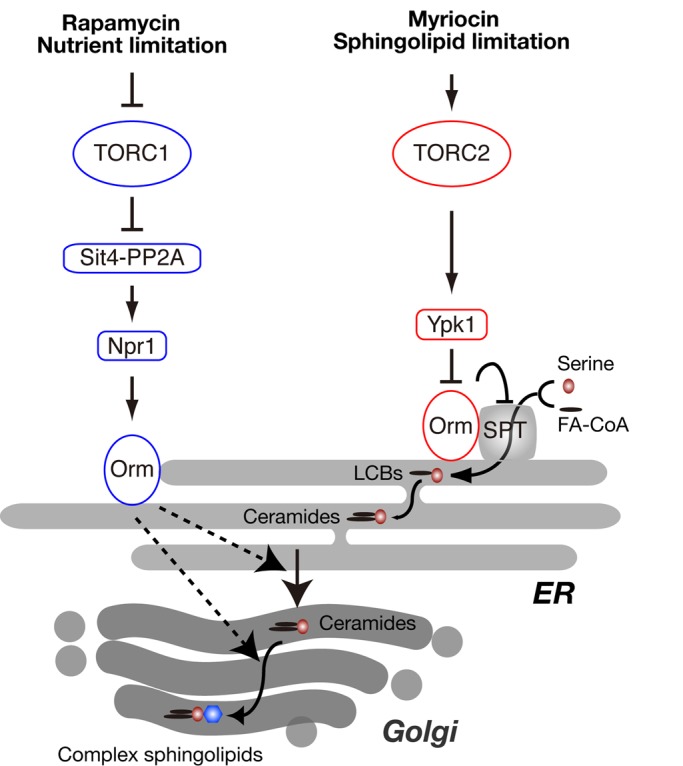
Model of regulation of sphingolipid synthesis by TORC1 and TORC2 signaling. FA-CoA, fatty acid-CoA.
We propose a new function for the Orm proteins in the regulation of sphingolipid biosynthesis. Breslow et al. (2010) examined genetic interactions between ORM2 and ER-related functions. They reported that an ORM2 deletion suppresses defects in ER-localized sphingolipid biosynthesis caused by a lcb1, lcb2, tsc3, tsc10, lcb4, sur2, lag1, or lac1 mutation (Figure 1). However, they also found, but without further mention, that an ORM2 deletion exacerbates the effect of an aur1, csg2, csh1, or sur1 mutation defective in complex sphingolipid synthesis. These genetic data suggest that Orm has two distinct functions in sphingolipid metabolism. The first, as described previously (Breslow et al., 2010; Han et al., 2010), is to antagonize SPT. Indeed, Orm1–Orm2 directly binds and inhibits SPT in the ER. The second Orm function, as described here, is to promote the synthesis of complex sphingolipids in the Golgi. The molecular mechanism by which Orm promotes synthesis of complex sphingolipids in the Golgi is unknown, although it may be indirect, as Orm has been reported to be exclusively in the ER (Breslow et al., 2010). One possible mechanism is that ER-localized Orm increases synthesis of complex sphingolipid precursors such as ceramides, since Orm proteins were shown recently to physically associate with the ceramide synthetase Lac1 (Liu et al., 2012). However, this seems unlikely since orm1∆ orm2∆ cells accumulate ceramides (Figure 3H). A second potential mechanism is that ER-localized Orm increases ER-to-Golgi flux of ceramides and/or enzymes required for synthesis of complex sphingolipids in the Golgi. Third, Orm may activate/modify substrates or enzymes in the ER that are subsequently required for IPC synthesis in the Golgi. For example, Orm may activate Sac1. Sac1 is an ER phosphatidylinositol-4-phosphate phosphatase required for synthesis of complex sphingolipids in the Golgi (Brice et al., 2009). Of interest, sac1∆ cells are rapamycin hypersensitive, indicating a functional interaction between Sac1 and TORC1 (Banuelos et al., 2010), and Orm physically interacts with Sac1 (Breslow et al., 2010; Supplemental Figure S2C). The last two possibilities are supported by the observation that orm1∆ orm2∆ cells are defective in conversion of ceramides to IPCs (Figure 3H and Supplemental Figure S3C). Further work is required to elucidate the molecular mechanism by which Orm proteins regulate complex sphingolipid synthesis.
TORC1 inhibition stimulates synthesis of complex sphingolipids without stimulating SPT and de novo synthesis of LCBs and ceramides as precursors. How does the cell sustain synthesis of complex sphingolipids upon TORC1 inhibition? The increase in complex sphingolipids could be merely a transient response that uses existing pools of LCBs and ceramides for adaptation to starvation. Another possibility is that the cell ceases to use LCBs for production of LCB phosphates and uses the resulting liberated LCBs to produce complex sphingolipids. In support of this possibility, rapamycin treatment stimulates vacuolar degradation of the LCB kinase Lcb4 (Iwaki et al., 2007).
Liu et al. (2012) recently also reported regulation of Orm1 phosphorylation by TORC1-PP2A-Npr1 signaling. However, unlike our study, they did not observe regulation of Orm2 phosphorylation by TORC1-PP2A-Npr1 signaling. This apparent discrepancy is likely due to the different methods used in the two studies to assay Orm2 phosphorylation. Whereas they assayed Orm phosphorylation by mobility shift in conventional SDS–PAGE (Liu et al., 2012), we used phospho–affinity gels and mass spectrometry. Our Npr1 kinase assay in vitro further demonstrates that both Orm1 and Orm2 are downstream of TORC1-Npr1 (Figure 5, C–G). Another important difference in the two studies is that Liu et al. did not distinguish myriocin- and rapamycin-triggered Orm phosphorylation and thus did not investigate a potential role of rapamycin-triggered Orm phosphorylation in sphingolipid synthesis.
We show that TORC1 inhibition stimulates Gap1 permease activity via Npr1-mediated phosphorylation of Orm and up-regulation of complex sphingolipid synthesis. Complex sphingolipids enhance stability of Gap1 at the PM (Lauwers et al., 2007). Two recent studies suggest that TORC1 inhibition stimulates Gap1 sorting to the PM by Npr1-mediated phosphorylation of Aly1/2 and Bul1/2 α-arrestin proteins (O'Donnell et al., 2010; Merhi and Andre, 2012). Aly1 and Aly2 stimulate transport of Gap1 from endosomal compartments to the trans-Golgi network and/or the PM. Bul1 and Bul2 are adaptor proteins for the Rsp5 ubiquitin ligase, which promotes Gap1 ubiquitylation and turnover. Npr1 phosphorylates and inhibits Bul1/2 to inhibit Gap1 ubiquitylation and turnover. Moreover, TORC1 inhibition also stimulates Gap1 transcription via the GATA factors Gln3 and Gat1 (Beck and Hall, 1999; Cardenas et al., 1999; Hardwick et al., 1999). Thus there are four separate effector pathways via which TORC1 inhibition up-regulates Gap1. This may explain why the orm1-5A orm2-7A mutant, in which only one of the four pathways is inhibited, displays only a mild effect on Gap1 activity.
The human ORM orthologue, ORMDL3, is a risk factor for childhood asthma (Moffatt et al., 2007), type 1 diabetes (Barrett et al., 2009), ulcerative colitis (McGovern et al., 2010), and Crohn's disease (Barrett et al., 2008). It would be of interest to determine whether mammalian TOR (mTOR) has a role in ORMDL3 regulation, although Npr1 has no obvious orthologue in humans and the Npr1 target sites in Orm are not conserved. mTOR may have novel physiological roles in the aforementioned ORM-related diseases, which may lead to new applications for drugs that target the mTOR pathway (Benjamin et al., 2011).
MATERIALS AND METHODS
Yeast strains, plasmids, growth conditions, chemicals, and antibodies
Yeast strains and plasmids used in this study are listed in Supplemental Tables S1 and S2, respectively. Gene deletions and modifications were performed by standard PCR-based methods (Longtine et al., 1998). The functional FLAG- or hemagglutinin (HA)-tagged ORM genes were cloned from previously described strains (Breslow et al., 2010). Point mutations were introduced by a reverse-PCR method, and DNA sequences were verified. Yeast cells were grown in standard SD medium (6.7 g of yeast nitrogen base without amino acids [US Biological, Swampscott, MA] containing 20 g/l glucose) with appropriate nutrients to maintain plasmids. For nitrogen starvation, SD-N medium (1.7 g of Difco yeast nitrogen base without amino acids and ammonium sulfate [BD Biosciences, San Diego, CA] and 20 g/l glucose) was used. For Gap1 experiments, 10 mM urea was supplemented in SD-N medium as nitrogen source. Phos-tag (Wako, Richmond, VA) was prepared as indicated in the instruction manual. Rapamycin (LC Laboratories, Woburn, MA) was dissolved in ethanol (10% Tween-20) or dimethyl sulfoxide (DMSO). Cycloheximide (Calbiochem, La Jolla, CA) was dissolved in DMSO. Myriocin/ISP-1 (Sigma-Aldrich, St. Louis, MO) was dissolved in methanol. Antibodies are as follows: anti-FLAG (M2, Sigma-Aldrich), anti-HA (Cell Signaling Technology, Beverly, MA), anti-Pgk1 (Life Technologies, Carlsbad, CA), anti-actin (Millipore, Billerica, MA), anti–glutathione S-transferase (GST; GE Healthcare, Piscataway, NJ), anti-Pma1 (Santa Cruz Biotechnology, Santa Cruz, VA), anti-Gap1 (a kind gift from Bruno André, Université Libre de Bruxelles, Brussels, Belgium), anti-Pep12 (Life Technologies), HRP-conjugated anti-mouse immunoglobulin G (IgG; Pierce, Rockford, IL), HRP-conjugated anti-goat IgG (Thermo Scientific, Waltham, MA), and HRP-conjugated anti-rabbit IgG (Jackson ImmunoResearch Laboratories, West Grove, PA).
Phospho–affinity gel electrophoresis
Yeast cells were resuspended in lysis buffer (Tris-buffered saline [TBS] containing 15% glycerol, 0.5% Tween-20, phosphatase inhibitor mixture [PPi: 10 mM NaF, 10 mM NaN3, 10 mM p-nitrophenyl phosphate, 10 mM sodium pyrophosphate, and 10 mM ß-glycerophosphate], 1 mM phenylmethylsulfonyl fluoride, and protease inhibitor cocktails [Pi:EDTA-free Complete; Roche, Indianapolis, IN]). The cells were broken by a Fastprep (45 s ×5; 3-min interval on ice) at 4°C with glass beads. Unbroken cells and debris were removed by centrifugation at 500 × g for 10 min, and the supernatant containing 10 μg of protein was used for SDS–PAGE analysis. For phospho–affinity gels, the gels were run at 70 V constant for 2.5 h, rinsed twice for 5 min in transfer buffer containing 1 mM EDTA, and rinsed twice more for 5 min in transfer buffer without EDTA before transfer. Gel-to-gel differences in band pattern are due to variability in phospho–affinity gel resolution as described in Breslow et al. (2010).
Fluorescence microscopy
For GFP-Orm localization, cells were cultured to early log phase and treated with rapamycin (final concentration, 200 ng/ml) for 1 h. The fluorescence signals were observed using an inverted microscope (IX70; Olympus, Tokyo, Japan) equipped with a 100× objective and a charge-coupled device (CCD) camera (Cool SNAP HQ/OL; Photometrics, Tucson, AZ) or confocal microscope (3i Spinning Disk Confocal; Carol Zeiss, Jena Germany) equipped with Photometrics Evolve 512, back-illuminated electron-multiplying CCD. Images were analyzed using MetaMorph (Olympus) and ImageJ software (National Institutes of Health, Bethesda, MD). For Gap1-GFP localization, prototrophic cells were cultured to early log phase and washed twice with SD-N media supplemented with 10 mM urea. The washed cells were resuspended in the same urea media and cultured for 2 h. The fluorescence signals were observed by a Zeiss AxioImager Z1 microscope equipped with an AxioCam MRm camera. Images were analyzed using ImageJ software. All images are based on observations of ∼100 cells. PM signal of Gap1-GFP was quantified from at least 50 cells by ImageJ.
Analysis of sphingolipids
In vivo labeling of sphingolipids by [3H]serine or [3H]DHS was performed as described in Zanolari et al. (2000) with minor modification. In brief, 2.5 OD units of cells were treated with drugs for 1 h and labeled with 20 μCi of [3H]serine or 4 μCi of [3H]DHS for 30 min. The labeling was stopped by adding final concentration of 10 mM sodium azide and sodium fluoride. The cells were washed three times with ice-cold water, and lipids were extracted with chloroform/methanol/water (CMW; 10:10:3) by vortexing with glass beads. The crude lipid extracts were dried up by N2 gas and subjected to mild alkaline treatment with NaOH. The lipid mixture was neutralized with acetic acid and dried up by N2 gas. The lipids were resuspended in water-saturated n-butanol and desalted with water. The water phase was reextracted with the water-saturated n-butanol, and the combined butanol phase was dried up by N2 gas. The lipids were resuspended in CMW and separated by TLC. The TLC plates were developed in chloroform/methanol/4.2 N ammonium solution (9:7:2). The TLC plates were exposed to a tritium-sensitive imaging plate (Fujifilm, Tokyo, Japan) for 3–5 d, and the radioactivity was scanned with a Typhoon scanner (GE Healthcare, Piscataway, NJ). The abundance of sphingolipids was quantified from at least three independent experiments by using ImageJ.
SPT assay
SPT assays were carried out by the method of Rutti et al., (2009). Yeast cell lysates were prepared in 50 mM 4-(2-hydroxyethyl)-1-piperazineethanesulfonic acid (HEPES; pH 8.3), 1 mM EDTA, and 0.1% sucrose monolaurate (Sigma-Aldrich) by a Fastprep (45 s × 5; 3-min interval on ice) at 4°C with glass beads.
Purification of FLAG-tagged proteins
Purification of FLAG-tagged proteins was performed as described in Breslow et al. (2010) with small modification. In brief, logarithmically growing yeast cells (500–750 OD units) were harvested, washed in cold water, and resuspended in immunoprecipitation buffer (50 mM HEPES-KOH, pH 6.8, 150 mM KOAc, 2 mM MgOAc, 1 mM CaCl2, 15% glycerol) with 0.1% water-soluble digitonin (Biosynth, Staad, Switzerland), PPi, and Pi. Cell lysates were prepared as described, followed by addition of equal volume of immunoprecipitation buffer with 1.9% digitonin, PPi, and Pi. Membrane proteins were solubilized by incubating lysates at 4ºC for 45 min. Unsolubilized material and unbroken cells were removed by ultracentrifugation at 100,000 × g for 1 h. Clarified lysates were incubated with anti-FLAG resin (Sigma-Aldrich) for 2.5 h. The anti-FLAG beads were then washed with 1 ml of immunoprecipitation buffer containing 0.1% digitonin, and bound proteins were eluted by addition of immunoprecipitation buffer with 0.25% digitonin and 1 mg/ml 3× FLAG peptide (Sigma-Aldrich).
Phosphomapping of Orm proteins
Purified FLAG-tagged Orm1 and Orm2 were reduced with 10 mM dithiothreitol in 100 mM Tris-HCl, pH 8.0, and 6 M urea for 60 min at 37°C and alkylated with 50 mM iodoacetamide for 15 min in the dark. FLAG-tagged Orm1 and Orm2 were digested with 500 ng of endoproteinase LysC (lysylendopeptidase; Wako) for 2 h. The digest was diluted with 100 mM Tris-HCl, pH 8.0, to lower the urea concentration to 2 M. The endoprotein LysC (ELC) digest was further digested with 500 ng of trypsin (sequencing grade modified; Promega, Madison, WI) overnight at 37°C. Digestion was stopped with trifluoroacetic acid (TFA) to 1% final concentration, and the peptides were desalted on a MicroSpin C18 cartridge (The Nest Group, Southborough, MA). Bound peptides were eluted with 80% acetonitrile/0.1% TFA and dried in a SpeedVac for subsequent analysis. The peptides were dissolved in 50 μl of 0.1% TFA, and 2 μl was analyzed by capillary liquid chromatography tandem mass spectrometry (MS/MS) using a setup of a trapping ProteoCol C-18 column (0.15 × 10 mm; SGE Analytical Science, Austin, TX) and a separating column (0.1 mm × 10 cm) that had been packed with Magic 300-Å C18 reverse-phase material (5-μm particle size; Michrom Bioresources/Bruker-Michrom, Auburn, CA). The columns were connected on-line to an Orbitrap FT hybrid instrument (Thermo Scientific). A linear gradient from 2 to 80% solvent B (0.1% acetic acid and 80% acetonitrile in water) in solvent A (0.1% acetic acid and 2% acetonitrile in water) in 85 min was delivered with an Agilent 1200 pump (Agilent Technologies, Santa Clara, CA) at a flow rate of 300 nl/min. The eluting peptides were ionized at 1.7 kV. The mass spectrometer was operated in a data-dependent manner. The precursor scan was done in the Orbitrap set to 60,000 resolution, and the fragment ions were mass analyzed in the LTQ instrument. A top-five method was run, so that the five most intense precursors were selected for fragmentation. The MS/MS spectra were then searched against SwissProt data bank using Mascot software. The data bank was searched with 10-ppm precursor ion tolerance, and the fragment ions were set to 0.6-Da tolerance. Postfiltering was set to a false discovery rate of 0.01. All spectra corresponding to phosphopeptides were manually validated.
Purification of recombinant Orm proteins from Escherichia coli
BL21 cells harboring pGEX-6P-1–based plasmids were cultured in LB media to OD = 0.6 at 37ºC, and the expression of N-terminal truncated Orm proteins was induced by 1 mM of isopropyl-β-d-thiogalactopyranoside for 6 h. GST fusion proteins were purified by using glutathione Sepharose 4B, eluted by glutathione, and dialyzed against TBS.
In vitro kinase assay of GST-Npr1
GST-Npr1 and -Npr1-K467R (kinase dead) were purified from rapamycin-treated yeast cells as described in Gander et al. (2008). In vitro kinase reaction was performed in 50 μl consisting of 50 mM Tris-HCl, pH 7.2, 2 mM MnCl2, 400 μM ATP, and 100 kBq [γ-32P]ATP (Amersham Bio-Sciences, Piscataway, NJ). After incubation at 37ºC for 30 min, the reaction was stopped by adding 12.5 μl of 5× SDS sample buffer, and the sample was incubated at 65ºC for 10 min. The proteins were separated by two acryl amide gels. One gel was transferred to nitrocellulose membrane for immunodetection, and the other gel was autoradiographed with an imaging plate (Fujifilm, Tokyo, Japan), and the image was scanned on a Typhoon instrument (GE Healthcare Science).
Subcellular fractionation
Subcellular fractionation assay was performed as described in Kaiser et al. (2002) with minor modifications. In brief, logarithmically growing cells in SD media were washed twice with and resuspended in SD-N medium supplemented with 10 mM urea. After 2 h in culture, cells were harvested by centrifugation and washed once with washing buffer (10 mM sodium azide, 10 mM potassium fluoride, 50 mM Tris-HCl, pH 7.5) and once with STE10 buffer (10% [wt/wt] sucrose, 10 mM Tris-HCl, pH 7.5, 10 mM EDTA). The washed cells were resuspended in the STE10 buffer with protease inhibitor cocktail and lysed with glass beads. The unbroken cells and debris were removed by centrifugation, and the supernatants were layered on the top of 20–60% (wt/wt) sucrose gradient in 10 mM Tris-HCl, pH 7.5, 10 mM EDTA. Samples were centrifuged for 17 h at 4ºC at 100,000 × g in an AH-650 rotor (Thermo Scientific). Fractions were collected from the top of the gradient by a fraction collector. For immunoblot, the collected fractions were solubilized with sample buffer at 37ºC for 1 h.
Citrulline uptake assays
Citrulline uptake assay was performed as described in Roberg et al. (1997). Briefly, logarithmically growing cells were washed twice with SD-N media supplemented with 10 mM urea and resuspended in the same urea media. Cells were further cultured for 2 h. To initiate an assay, 20 μM [14C]citrulline was added to cell suspension, and 100-μl aliquots were removed and immediately filtered every 30 s up to a total of 2.5 min. Cells were washed three times with 10 ml of ice-cold doubly distilled H2O and placed in scintillation fluid to determine cellular incorporation of [14C]citrulline. The relative rate of [14C]citrulline uptake was calculated from three independent experiments.
Supplementary Material
Acknowledgments
We thank J. S. Weissman (University of California, San Francisco, San Francisco, CA) for yeast strains, B. André (Université Libre de Bruxelles, Brussels, Belgium) for Gap1 antibody and plasmids, the Biozentrum Imaging Care Facility for the microscope, and A. Spang (Biozentrum, Basel, Switzerland) for antibodies and helpful discussion. The experiments described here were initiated in the laboratory of Yasunori Kozutsumi (Kyoto University, Kyoto, Japan). This work was supported by grants from the Canton of Basel, SystemsX.ch, and the Swiss National Science Foundation (M.N.H).
Abbreviations used:
- cER
cortical-ER
- CHX
cycloheximide
- DHS
dihydrosphingosine
- ER
endoplasmic reticulum
- Gap1
general amino acid permease 1
- IPC
inositol phosphorylceramide
- LCBs
long-chain bases
- MIPC
mannosyl IPC
- PHS
phytosphingosine
- PM
plasma membrane
- SPT
serine palmitoyltransferase
- TORC
target of rapamycin complex
Footnotes
This article was published online ahead of print in MBoC in Press (http://www.molbiolcell.org/cgi/doi/10.1091/mbc.E12-10-0753) on January 30, 2013.
REFERENCES
- Arndt KT, Styles CA, Fink GR. A suppressor of a HIS4 transcriptional defect encodes a protein with homology to the catalytic subunit of protein phosphatases. Cell. 1989;56:527–537. doi: 10.1016/0092-8674(89)90576-x. [DOI] [PubMed] [Google Scholar]
- Aronova S, Wedaman K, Aronov PA, Fontes K, Ramos K, Hammock BD, Powers T. Regulation of ceramide biosynthesis by TOR complex 2. Cell Metab. 2008;7:148–158. doi: 10.1016/j.cmet.2007.11.015. [DOI] [PMC free article] [PubMed] [Google Scholar]
- Banuelos MG, Moreno DE, Olson DK, Nguyen Q, Ricarte F, Aguilera-Sandoval CR, Gharakhanian E. Genomic analysis of severe hypersensitivity to hygromycin B reveals linkage to vacuolar defects and new vacuolar gene functions in Saccharomyces cerevisiae. Curr Genet. 2010;56:121–137. doi: 10.1007/s00294-009-0285-3. [DOI] [PMC free article] [PubMed] [Google Scholar]
- Barrett JC, et al. Genome-wide association study and meta-analysis find that over 40 loci affect risk of type 1 diabetes. Nat Genet. 2009;41:703–707. doi: 10.1038/ng.381. [DOI] [PMC free article] [PubMed] [Google Scholar]
- Barrett JC, et al. Genome-wide association defines more than 30 distinct susceptibility loci for Crohn's disease. Nat Genet. 2008;40:955–962. doi: 10.1038/NG.175. [DOI] [PMC free article] [PubMed] [Google Scholar]
- Beck T, Hall MN. The TOR signalling pathway controls nuclear localization of nutrient-regulated transcription factors. Nature. 1999;402:689–692. doi: 10.1038/45287. [DOI] [PubMed] [Google Scholar]
- Beck T, Schmidt A, Hall MN. Starvation induces vacuolar targeting and degradation of the tryptophan permease in yeast. J Cell Biol. 1999;146:1227–1238. doi: 10.1083/jcb.146.6.1227. [DOI] [PMC free article] [PubMed] [Google Scholar]
- Beeler T, Bacikova D, Gable K, Hopkins L, Johnson C, Slife H, Dunn T. The Saccharomyces cerevisiae TSC10/YBR265w gene encoding 3-ketosphinganine reductase is identified in a screen for temperature-sensitive suppressors of the Ca2+-sensitive csg2Delta mutant. J Biol Chem. 1998;273:30688–30694. doi: 10.1074/jbc.273.46.30688. [DOI] [PubMed] [Google Scholar]
- Benjamin D, Colombi M, Moroni C, Hall MN. Rapamycin passes the torch: a new generation of mTOR inhibitors. Nat Rev Drug Discov. 2011;10:868–880. doi: 10.1038/nrd3531. [DOI] [PubMed] [Google Scholar]
- Berchtold D, Piccolis M, Chiaruttini N, Riezman I, Riezman H, Roux A, Walther TC, Loewith R. Plasma membrane stress induces relocalization of Slm proteins and activation of TORC2 to promote sphingolipid synthesis. Nat Cell Biol. 2012;14:542–547. doi: 10.1038/ncb2480. [DOI] [PubMed] [Google Scholar]
- Binda M, Peli-Gulli MP, Bonfils G, Panchaud N, Urban J, Sturgill TW, Loewith R, De Virgilio C. The Vam6 GEF controls TORC1 by activating the EGO complex. Mol Cell. 2009;35:563–573. doi: 10.1016/j.molcel.2009.06.033. [DOI] [PubMed] [Google Scholar]
- Breslow DK, Collins SR, Bodenmiller B, Aebersold R, Simons K, Shevchenko A, Ejsing CS, Weissman JS. Orm family proteins mediate sphingolipid homeostasis. Nature. 2010;463:1048–1053. doi: 10.1038/nature08787. [DOI] [PMC free article] [PubMed] [Google Scholar]
- Brice SE, Alford CW, Cowart LA. Modulation of sphingolipid metabolism by the phosphatidylinositol-4-phosphate phosphatase Sac1p through regulation of phosphatidylinositol in Saccharomyces cerevisiae. J Biol Chem. 2009;284:7588–7596. doi: 10.1074/jbc.M808325200. [DOI] [PMC free article] [PubMed] [Google Scholar]
- Cardenas ME, Cutler NS, Lorenz MC, Di Como CJ, Heitman J. The TOR signaling cascade regulates gene expression in response to nutrients. Genes Dev. 1999;13:3271–3279. doi: 10.1101/gad.13.24.3271. [DOI] [PMC free article] [PubMed] [Google Scholar]
- De Craene JO, Soetens O, Andre B. The Npr1 kinase controls biosynthetic and endocytic sorting of the yeast Gap1 permease. J Biol Chem. 2001;276:43939–43948. doi: 10.1074/jbc.M102944200. [DOI] [PubMed] [Google Scholar]
- De Virgilio C, Loewith R. Cell growth control: little eukaryotes make big contributions. Oncogene. 2006;25:6392–6415. doi: 10.1038/sj.onc.1209884. [DOI] [PubMed] [Google Scholar]
- Dickson RC, Nagiec EE, Skrzypek M, Tillman P, Wells GB, Lester RL. Sphingolipids are potential heat stress signals in Saccharomyces. J Biol Chem. 1997;272:30196–30200. doi: 10.1074/jbc.272.48.30196. [DOI] [PubMed] [Google Scholar]
- Gable K, Slife H, Bacikova D, Monaghan E, Dunn TM. Tsc3p is an 80-amino acid protein associated with serine palmitoyltransferase and required for optimal enzyme activity. J Biol Chem. 2000;275:7597–7603. doi: 10.1074/jbc.275.11.7597. [DOI] [PubMed] [Google Scholar]
- Gander S, Bonenfant D, Altermatt P, Martin DE, Hauri S, Moes S, Hall MN, Jenoe P. Identification of the rapamycin-sensitive phosphorylation sites within the Ser/Thr-rich domain of the yeast Npr1 protein kinase. Rapid Commun Mass Spectrom. 2008;22:3743–3753. doi: 10.1002/rcm.3790. [DOI] [PubMed] [Google Scholar]
- Gelperin D, Horton L, DeChant A, Hensold J, Lemmon SK. Loss of ypk1 function causes rapamycin sensitivity, inhibition of translation initiation and synthetic lethality in 14-3-3-deficient yeast. Genetics. 2002;161:1453–1464. doi: 10.1093/genetics/161.4.1453. [DOI] [PMC free article] [PubMed] [Google Scholar]
- Guillas I, Kirchman PA, Chuard R, Pfefferli M, Jiang JC, Jazwinski SM, Conzelmann A. C26-CoA-dependent ceramide synthesis of Saccharomyces cerevisiae is operated by Lag1p and Lac1p. EMBO J. 2001;20:2655–2665. doi: 10.1093/emboj/20.11.2655. [DOI] [PMC free article] [PubMed] [Google Scholar]
- Han S, Lone MA, Schneiter R, Chang A. Orm1 and Orm2 are conserved endoplasmic reticulum membrane proteins regulating lipid homeostasis and protein quality control. Proc Natl Acad Sci USA. 2010;107:5851–5856. doi: 10.1073/pnas.0911617107. [DOI] [PMC free article] [PubMed] [Google Scholar]
- Hannun YA, Obeid LM. Principles of bioactive lipid signalling: lessons from sphingolipids. Nat Rev Mol Cell Biol. 2008;9:139–150. doi: 10.1038/nrm2329. [DOI] [PubMed] [Google Scholar]
- Hardwick JS, Kuruvilla FG, Tong JK, Shamji AF, Schreiber SL. Rapamycin-modulated transcription defines the subset of nutrient-sensitive signaling pathways directly controlled by the Tor proteins. Proc Natl Acad Sci USA. 1999;96:14866–14870. doi: 10.1073/pnas.96.26.14866. [DOI] [PMC free article] [PubMed] [Google Scholar]
- Helliwell SB, Howald I, Barbet N, Hall MN. TOR2 is part of two related signaling pathways coordinating cell growth in Saccharomyces cerevisiae. Genetics. 1998;148:99–112. doi: 10.1093/genetics/148.1.99. [DOI] [PMC free article] [PubMed] [Google Scholar]
- Huber A, Bodenmiller B, Uotila A, Stahl M, Wanka S, Gerrits B, Aebersold R, Loewith R. Characterization of the rapamycin-sensitive phosphoproteome reveals that Sch9 is a central coordinator of protein synthesis. Genes Dev. 2009;23:1929–1943. doi: 10.1101/gad.532109. [DOI] [PMC free article] [PubMed] [Google Scholar]
- Iwaki S, Sano T, Takagi T, Osumi M, Kihara A, Igarashi Y. Intracellular trafficking pathway of yeast long-chain base kinase Lcb4, from its synthesis to its degradation. J Biol Chem. 2007;282:28485–28492. doi: 10.1074/jbc.M701607200. [DOI] [PubMed] [Google Scholar]
- Jenkins GM, Richards A, Wahl T, Mao C, Obeid L, Hannun Y. Involvement of yeast sphingolipids in the heat stress response of Saccharomyces cerevisiae. J Biol Chem. 1997;272:32566–32572. doi: 10.1074/jbc.272.51.32566. [DOI] [PubMed] [Google Scholar]
- Kaiser CA, Chen EJ, Losko S. Subcellular fractionation of secretory organelles. Methods Enzymol. 2002;351:325–338. doi: 10.1016/s0076-6879(02)51855-3. [DOI] [PubMed] [Google Scholar]
- Kinoshita E, Kinoshita-Kikuta E, Takiyama K, Koike T. Phosphate-binding tag, a new tool to visualize phosphorylated proteins. Mol Cell Proteomics. 2006;5:749–757. doi: 10.1074/mcp.T500024-MCP200. [DOI] [PubMed] [Google Scholar]
- Lauwers E, Grossmann G, Andre B. Evidence for coupled biogenesis of yeast Gap1 permease and sphingolipids: essential role in transport activity and normal control by ubiquitination. Mol Biol Cell. 2007;18:3068–3080. doi: 10.1091/mbc.E07-03-0196. [DOI] [PMC free article] [PubMed] [Google Scholar]
- Liu M, Huang C, Polu SR, Schneiter R, Chang A. Regulation of sphingolipid synthesis via Orm1 and Orm2 in yeast. J Cell Sci. 2012;23:2388–2398. doi: 10.1242/jcs.100578. [DOI] [PMC free article] [PubMed] [Google Scholar]
- Loewith R, Hall MN. Target of rapamycin. (TOR) in nutrient signaling and growth control. Genetics. 2011;189:1177–1201. doi: 10.1534/genetics.111.133363. [DOI] [PMC free article] [PubMed] [Google Scholar]
- Loewith R, Jacinto E, Wullschleger S, Lorberg A, Crespo JL, Bonenfant D, Oppliger W, Jenoe P, Hall MN. Two TOR complexes, only one of which is rapamycin sensitive, have distinct roles in cell growth control. Mol Cell. 2002;10:457–468. doi: 10.1016/s1097-2765(02)00636-6. [DOI] [PubMed] [Google Scholar]
- Longtine MS, McKenzie A 3rd, Demarini DJ, Shah NG, Wach A, Brachat A, Philippsen P, Pringle JR. Additional modules for versatile and economical PCR-based gene deletion and modification in Saccharomyces cerevisiae. Yeast. 1998;14:953–961. doi: 10.1002/(SICI)1097-0061(199807)14:10<953::AID-YEA293>3.0.CO;2-U. [DOI] [PubMed] [Google Scholar]
- MacGurn JA, Hsu PC, Smolka MB, Emr SD. TORC1 regulates endocytosis via Npr1-mediated phosphoinhibition of a ubiquitin ligase adaptor. Cell. 2012;147:1104–1117. doi: 10.1016/j.cell.2011.09.054. [DOI] [PubMed] [Google Scholar]
- McGovern DP, et al. Genome-wide association identifies multiple ulcerative colitis susceptibility loci. Nat Genet. 2010;42:332–337. doi: 10.1038/ng.549. [DOI] [PMC free article] [PubMed] [Google Scholar]
- Meier KD, Deloche O, Kajiwara K, Funato K, Riezman H. Sphingoid base is required for translation initiation during heat stress in Saccharomyces cerevisiae. Mol Biol Cell. 2006;17:1164–1175. doi: 10.1091/mbc.E05-11-1039. [DOI] [PMC free article] [PubMed] [Google Scholar]
- Merhi A, Andre B. Internal amino acids promote Gap1 permease ubiquitylation via TORC1/Npr1/14-3-3-dependent control of the Bul arrestin-like adaptors. Mol Cell Biol. 2012;32:4510–4522. doi: 10.1128/MCB.00463-12. [DOI] [PMC free article] [PubMed] [Google Scholar]
- Moffatt MF, et al. Genetic variants regulating ORMDL3 expression contribute to the risk of childhood asthma. Nature. 2007;448:470–473. doi: 10.1038/nature06014. [DOI] [PubMed] [Google Scholar]
- Nagiec MM, Baltisberger JA, Wells GB, Lester RL, Dickson RC. The LCB2 gene of Saccharomyces and the related LCB1 gene encode subunits of serine palmitoyltransferase, the initial enzyme in sphingolipid synthesis. Proc Natl Acad Sci USA. 1994;91:7899–7902. doi: 10.1073/pnas.91.17.7899. [DOI] [PMC free article] [PubMed] [Google Scholar]
- O'Donnell AF, Apffel A, Gardner RG, Cyert MS. Alpha-arrestins Aly1 and Aly2 regulate intracellular trafficking in response to nutrient signaling. Mol Biol Cell. 2010;21:3552–3566. doi: 10.1091/mbc.E10-07-0636. [DOI] [PMC free article] [PubMed] [Google Scholar]
- Roberg KJ, Rowley N, Kaiser CA. Physiological regulation of membrane protein sorting late in the secretory pathway of Saccharomyces cerevisiae. J Cell Biol. 1997;137:1469–1482. doi: 10.1083/jcb.137.7.1469. [DOI] [PMC free article] [PubMed] [Google Scholar]
- Roelants FM, Breslow DK, Muir A, Weissman JS, Thorner J. Protein kinase Ypk1 phosphorylates regulatory proteins Orm1 and Orm2 to control sphingolipid homeostasis in Saccharomyces cerevisiae. Proc Natl Acad Sci USA. 2011;108:19222–19227. doi: 10.1073/pnas.1116948108. [DOI] [PMC free article] [PubMed] [Google Scholar]
- Rutti MF, Richard S, Penno A, von Eckardstein A, Hornemann T. An improved method to determine serine palmitoyltransferase activity. J Lipid Res. 2009;50:1237–1244. doi: 10.1194/jlr.D900001-JLR200. [DOI] [PMC free article] [PubMed] [Google Scholar]
- Schmidt A, Beck T, Koller A, Kunz J, Hall MN. The TOR nutrient signalling pathway phosphorylates NPR1 and inhibits turnover of the tryptophan permease. EMBO J. 1998;17:6924–6931. doi: 10.1093/emboj/17.23.6924. [DOI] [PMC free article] [PubMed] [Google Scholar]
- Schorling S, Vallee B, Barz WP, Riezman H, Oesterhelt D. Lag1p and Lac1p are essential for the Acyl-CoA-dependent ceramide synthase reaction in Saccharomyces cerevisiae. Mol Biol Cell. 2001;12:3417–3427. doi: 10.1091/mbc.12.11.3417. [DOI] [PMC free article] [PubMed] [Google Scholar]
- Skrzypek MS, Nagiec MM, Lester RL, Dickson RC. Analysis of phosphorylated sphingolipid long-chain bases reveals potential roles in heat stress and growth control in Saccharomyces. J Bacteriol. 1999;181:1134–1140. doi: 10.1128/jb.181.4.1134-1140.1999. [DOI] [PMC free article] [PubMed] [Google Scholar]
- Soulard A, Cremonesi A, Moes S, Schutz F, Jeno P, Hall MN. The rapamycin-sensitive phosphoproteome reveals that TOR controls protein kinase A toward some but not all substrates. Mol Biol Cell. 2010;21:3475–3486. doi: 10.1091/mbc.E10-03-0182. [DOI] [PMC free article] [PubMed] [Google Scholar]
- Sun Y, Miao Y, Yamane Y, Zhang C, Shokat KM, Takematsu H, Kozutsumi Y, Drubin DG. Orm protein phosphoregulation mediates transient sphingolipid biosynthesis response to heat stress via the Pkh-Ypk and Cdc55-PP2A pathways. Mol Biol Cell. 2012;23:2388–2398. doi: 10.1091/mbc.E12-03-0209. [DOI] [PMC free article] [PubMed] [Google Scholar]
- Vallee B, Riezman H. Lip1p: a novel subunit of acyl-CoA ceramide synthase. EMBO J. 2005;24:730–741. doi: 10.1038/sj.emboj.7600562. [DOI] [PMC free article] [PubMed] [Google Scholar]
- Wedaman KP, Reinke A, Anderson S, Yates J 3rd, McCaffery JM, Powers T. Tor kinases are in distinct membrane-associated protein complexes in Saccharomyces cerevisiae. Mol Biol Cell. 2003;14:1204–1220. doi: 10.1091/mbc.E02-09-0609. [DOI] [PMC free article] [PubMed] [Google Scholar]
- Wullschleger S, Loewith R, Hall MN. TOR signaling in growth and metabolism. Cell. 2006;124:471–484. doi: 10.1016/j.cell.2006.01.016. [DOI] [PubMed] [Google Scholar]
- Zanolari B, Friant S, Funato K, Sutterlin C, Stevenson BJ, Riezman H. Sphingoid base synthesis requirement for endocytosis in Saccharomyces cerevisiae. EMBO J. 2000;19:2824–2833. doi: 10.1093/emboj/19.12.2824. [DOI] [PMC free article] [PubMed] [Google Scholar]
- Zhang X, Skrzypek MS, Lester RL, Dickson RC. Elevation of endogenous sphingolipid long-chain base phosphates kills Saccharomyces cerevisiae cells. Curr Genet. 2001;40:221–233. doi: 10.1007/s00294-001-0259-6. [DOI] [PubMed] [Google Scholar]
Associated Data
This section collects any data citations, data availability statements, or supplementary materials included in this article.