

Abstract
Recent electrophysiological studies on the primate amygdala have advanced our understanding of how individual neurons encode information relevant to emotional processes, but it remains unclear how these neurons are functionally and anatomically organized. To address this, we analyzed cross-correlograms of amygdala spike trains recorded during a task in which monkeys learned to associate novel images with rewarding and aversive outcomes. Using this task, we have recently described two populations of amygdala neurons: one that responds more strongly to images predicting reward (positive value-coding), and another that responds more strongly to images predicting an aversive stimulus (negative value-coding). Here, we report that these neural populations are organized into distinct, but anatomically intermingled, appetitive and aversive functional circuits, which are dynamically modulated as animals used the images to predict outcomes. Furthermore, we report that responses to sensory stimuli are prevalent in the lateral amygdala, and are also prevalent in the medial amygdala for sensory stimuli that are emotionally significant. The circuits identified here could potentially mediate valence-specific emotional behaviors thought to involve the amygdala.
Introduction
The amygdala is an important component of the neural system for fear conditioning, reward processing, and other functions related to emotion (LeDoux, 2000; Baxter and Murray, 2002; McGaugh, 2004; Phelps and LeDoux, 2005; Morrison and Salzman, 2010; Salzman and Fusi, 2010). Electrophysiology studies in the monkey have revealed that single amygdala neurons encode information about rewarding and aversive associations during reinforcement learning. As monkeys learn to associate arbitrary images (the conditioned stimulus, or CS) with liquid rewards and aversive air puffs (the unconditioned stimulus, or US), the responses of amygdala neurons to a given CS often change such that responses are stronger in anticipation of one US compared with the other (Paton et al., 2006; Belova et al., 2007; Belova et al., 2008; Morrison et al., 2011). We operationally define these neurons as encoding value because they respond more strongly to either a CS-reward or CS-air puff association, at the same time as monkeys exhibit approach and avoidance behaviors upon viewing the predictive CSs. Furthermore, amygdala neurons often respond to other task events (e.g., US presentation) in a manner consistent with the notion that the neurons encode “state value” (Belova et al., 2008), a quantity often posited in models of reinforcement learning (Sutton and Barto, 1998; Dayan and Balleine, 2002; Dayan and Niv, 2008). These studies show that the amygdala represents not only information relevant to fear and related negative emotions, but information about rewards and reward-predicting stimuli as well, a finding consistent with other studies on reward processing in the amygdala (Sanghera et al., 1979; Nishijo et al., 1988b; Sugase-Miyamoto and Richmond, 2005; Bermudez and Schultz, 2010a, 2010b).
Although we have obtained increasing knowledge of the response properties of single neurons during emotional behavior, we still lack insight into how these neurons are organized at the level of amygdala circuits. Therefore, first we used cross-correlogram (CCG) analysis to examine the functional connectivity between neurons simultaneously recorded during a trace conditioning task. We sought to understand if functional interactions among amygdala cells were related to their response properties, and whether such interactions were task modulated. We found evidence that neurons are organized into distinct value-coding functional circuits, which are dynamically modulated when monkeys used CSs to predict reinforcement.
Second, we examined the anatomical organization of amygdala circuits—specifically, how the sensory, value-coding, and other response properties of neurons relate to their anatomical locations. Sensory afferents primarily arrive in the lateral nucleus (Stefanacci and Amaral, 2000, 2002), which projects to more medial regions (Pitkänen and Amaral, 1991, 1998), including nuclei involved in mediating behavioral and autonomic responses to emotionally significant stimuli (LeDoux, 2000; Maren, 2005; Balleine and Killcross, 2006; Murray, 2007). Thus, we hypothesized that responses to sensory stimuli would be prevalent in the lateral regions, and that the responses would be less restricted to the lateral regions for emotionally significant stimuli—a hypothesis confirmed for the four stimuli from our experiment. On the other hand, distinct value-coding functional circuits were found to overlap anatomically.
Materials and Methods
General methods.
The general methods of our experiments have been described previously (Paton et al., 2006; Belova et al., 2007, 2008). Experiments were performed with two male (monkeys P and R) and two female (monkeys V and L) rhesus monkeys (Macaca mulatta). All animal procedures conformed to NIH guidelines and were approved by the Institutional Animal Care and Use Committees at the New York State Psychiatric Institute and Columbia University.
Subjects and surgery.
In each monkey, the location of the amygdala was determined in stereotactic coordinates using magnetic resonance imaging (MRI). Craniotomies were made over the right amygdala and recording chambers (Crist Instruments) were placed in a dental acrylic implant over the craniotomies. To verify that the chambers were placed over the amygdala, we performed a postoperative MRI with an electrode positioned in the brain, via a guide tube, and advanced a known distance toward the amygdala. We used these images to ascertain the distance to the amygdala from both the bottom of the recording grid and the tip of the guide tube. We noted gray and white matter transitions along the electrode path to aid in electrode positioning. These images were also used to reconstruct the recording sites (see Fig. 5).
Figure 5.
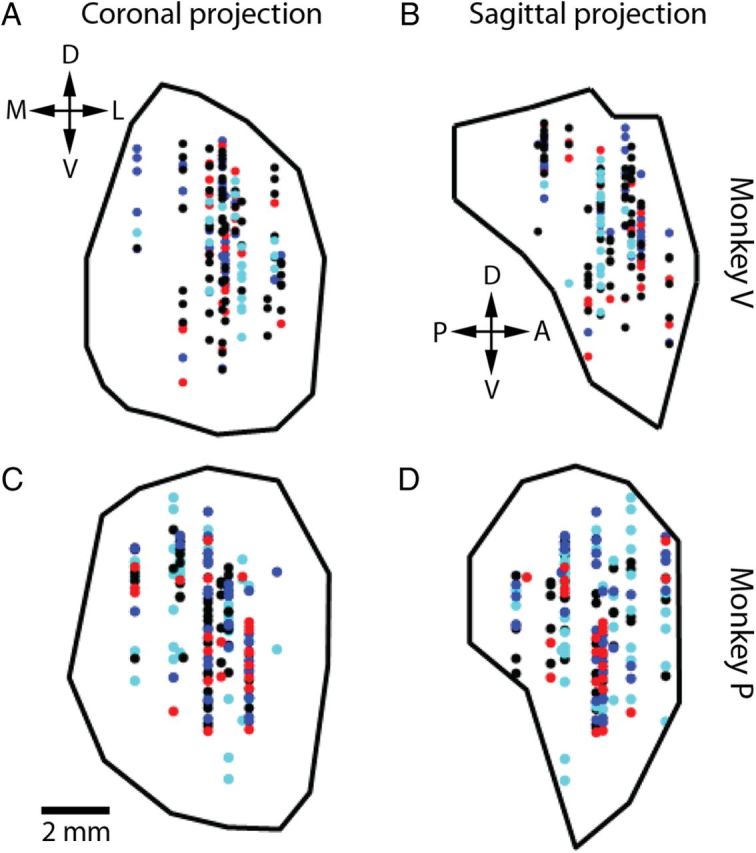
MRI reconstruction of amygdala recording sites for monkeys V and P. A, C, Coronal projections, monkeys V (A) and P (C). B, D, Sagittal projections, monkeys V (B) and P (D). Blue, Positive value-coding cells; red, negative value-coding cells; black, cells not encoding value; cyan, cells not classified for value-coding (recording period did not cover both initial and reversal learning of the trace conditioning task). D, Dorsal; V, ventral; M, medial; L, lateral; P, posterior; A, anterior.
Behavioral task.
During experiments, the monkey sat in a Plexiglas primate chair (Crist Instruments) situated in a sound-attenuating booth. The monkey viewed the visual stimuli on a 21” CRT monitor placed ∼57 cm in front of its eyes. We used the TEMPO (Reflective Computing) package of software for stimulus presentation and collection of behavioral data. Neurons were recorded while monkeys performed a trace conditioning task. During each session, monkeys learned to associate three novel images with three familiar outcomes: large reward (0.2–0.9 ml of liquid), aversive air puff toward the face, and little or no reward (either 0 ml or <0.1 ml of liquid depending on task version). Images were fractal patterns and had no inherent value. They were easily distinguishable from each other and from recently shown images from previous days.
Each trial began when a fixation point appeared at the center of the screen. Monkeys were required to fixate this point for 1000 ms, after which an image was briefly presented (for 300 or 350 ms depending on the monkey), followed by a 1500 ms trace epoch. During the trace epoch, monkeys were free to move their eyes. The trace epoch was followed by US delivery and an intertrial interval chosen randomly from between 2 and 4 s. All trial types were pseudorandomly interleaved. Monkeys licked at the reward spout in anticipation of rewards and closed their eyes (“blinked”) in anticipation of air puffs. After monkeys learned the relationships between the images and the outcomes, the large reward and air puff images were reversed without warning, such that the image that initially predicted large rewards was now associated with air puffs, and the image that initially predicted air puffs was now associated with large rewards. The monkey then learned the new CS–US relationships.
Anticipatory licking and blinking were used to assay the monkey's knowledge of the CS–US associations. The reward tube was placed ∼1–2 cm from the monkey's mouth, and licking time was recorded as the time the monkey's tongue interrupted an infrared beam that passed between the monkey's mouth and the reward tube. We measured blinking using an infrared eye tracker (ASL). The two behaviors were scored independently and simultaneously on every trial. Learning across trials was determined from the trends in licking and blinking in response to each of the three images.
After the trace conditioning task was completed for a given experimental session, the monkey sometimes performed the “random task.” With no behavioral requirements enforced, monkeys were presented randomly with rewards and air puffs, without any images. The interval between successive stimuli was chosen at random from a truncated exponential distribution with a mean of 5–6 s, minimum of 3.5 s, and maximum of 15–20 s. Table 1 lists the number of neurons recorded during the different combinations of tasks.
Table 1.
Number of neurons recorded for each combination of tasks (all monkeys combined)
| Task | Number of neurons |
|---|---|
| Initial learning only | 55 |
| Reversal learning only | 3 |
| Initial and reversal learning only | 335 |
| Initial learning and random only | 22 |
| Reversal learning and random only | 11 |
| Initial learning, reversal learning, and random | 206 |
| Total | 632 |
Electrophysiology.
Standard tungsten microelectrodes (FHC Instruments) were placed in a recording grid at the beginning of each experiment using dura-puncturing guide tubes. The recording grid contained a series of holes separated by 1 mm along each of two orthogonal axes. Therefore, neighboring neural samples were in discrete locations along two of the three cardinal axes. Electrodes were individually controlled (1–4 electrodes/session) using either a motor-controlled hydraulic microdrive (Narishige) or a motorized multielectrode drive (NAN).
Neural signals were amplified, filtered, and digitized using the Plexon system. Spikes were sorted online, and waveforms and spike times were stored for offline verification and further analyses. Spike waveforms from the same unit have been reported to display considerable variability during bursts (Quirk and Wilson, 1999; Stratton et al., 2012); therefore, we were careful to make sure that two units recorded on the same electrode did not result from variable spike waveforms of the same unit. We checked for spike amplitude and shape changes during bursts, and we monitored the temporal correlation between spike trains as well as the ISI distributions. We accepted only units with clearly distinct waveform clusters in principal component space throughout the recording session and with ISI distribution and temporal correlations indicating distinct units.
While we searched for neurons, monkeys either performed a fixation task without any image presentation or were allowed to gaze freely. We studied all neurons that were well isolated during either the initial learning or the reversal learning period of the trace conditioning task. We recorded 216, 194, 136, and 86 neurons from monkeys P, V, L, and R, respectively (632 neurons total). The neurons from the different monkeys occupied an overlapping region of the right amygdala (see Fig. 5). Most of our recorded neurons were likely located in the basal, accessory basal, lateral, and central nuclei, and the intercalated cell masses.
Response analyses.
Neural and behavioral data were processed in MATLAB (MathWorks). The neural response properties we examined are listed in Table 2.
Table 2.
List of parameters
| Parameter name | Continuous/discrete | Description |
|---|---|---|
| Baseline firing rate | C | Average firing rate during the 500 ms before fixation point onset |
| Action potential duration | C | Peak-to-trough duration of the mean action potential waveform |
| Fixation point response | D | Presence/absence of a fixation point response |
| Fixation point response sign | D | Fixation point response being excitatory or inhibitory |
| Fixation point response latency | C | Latency of fixation point response |
| Image onset response | D | Presence/absence of an image onset response |
| Image onset response latency | C | Latency of image response |
| Reward response | D | Presence/absence of a reward response |
| Reward response sign | D | Reward response being excitatory or inhibitory |
| Reward response latency | C | Latency of reward response |
| Reward response duration | C | Duration of reward response |
| Air puff response | D | Presence/absence of an air puff response |
| Air puff response sign | D | Air puff response being excitatory or inhibitory |
| Air Puff Response latency | C | Latency of air puff response |
| Air Puff Response duration | C | Duration of air puff response |
| Value coding | D | Value coding or not |
| Value-coding sign | D | Sign of value-coding (positive or negative) |
| Value-coding latency | C | Onset of value-coding relative to image onset |
| Value-coding duration | C | Duration of value-coding |
| Value-coding epoch | D | Epoch during which the cell is value-coding (visual, trace, both) |
| Reward ROC | C | Maximum ROC value for rewarded trials in the trace versus random tasks |
| Air puff ROC | C | Maximum ROC value for air puff trials in the trace versus random tasks |
| Outcome ROC (trace) | C | Maximum ROC value for rewarded versus air puff trials in the trace task |
| Outcome ROC (random) | C | Maximum ROC value for rewarded versus air puff trials in the random task |
| Neural-behavioral CP difference (Image 1) | C | Neural CP minus behavioral CP for initially positive image |
| Neural-behavioral CP difference (Image 2) | C | Neural CP minus behavioral CP for initially negative image |
C, Continuous parameter; D, discrete parameter; ROC, receiver operating characteristic; CP, change point.
Baseline firing rate was defined as the firing rate over the 500 ms before fixation point onset. Action potential duration was defined as the time between the absolute peak and trough of the spike waveform.
To quantify responses to each of the four stimuli presented during the experiment (fixation point, image, reward, air puff), we compared activity during the 500 ms preceding the presentation of the stimulus to activity after the presentation, as described in the study by Paton et al. (2006). For a given stimulus, we computed up to four response parameters: the presence/absence of a response, the response direction (excitatory or inhibitory), the response latency, and the response duration.
We categorized a cell as positive value-coding if it fired more strongly to positive images than negative images, and negative value-coding if it fired more strongly to negative images than positive ones. We performed this classification using the receiver operating characteristic (ROC) analysis as described in Belova et al. (2008). Furthermore, by comparing the responses of a cell before and after reinforcement contingency reversal, separately for the visual epoch (the 300 or 350 ms of CS presentation) and for the trace epoch (the 1500 ms between CS offset and US delivery) of the task, we determined if the cell encoded value in either epoch. Eight cells encoded value in both epochs and were excluded from analyses comparing the visual epoch and trace epoch value-coding populations. We characterized the onset and duration of value-coding as the onset and duration of the period during which the peristimulus time histograms (PSTHs) of reward and air puff trials had non-overlapping 95% confidence intervals.
To examine possible response modulations by expectation of reinforcement, we quantified the differences in neural response to the USs during the conditioning task and the random task, using ROC analysis as described in the study by Belova et al. (2007). Depending on during which task(s) a cell was recorded, responses to USs were characterized by up to four ROC values, derived from the following comparisons: reward responses in the trace conditioning versus random task; air puff responses in the trace conditioning versus random task; reward versus air puff responses in the trace conditioning task; and reward versus air puff responses in the random task.
To examine the relative timing of changes in neural response to images after CS–US contingency reversal, we used a change point test (Gallistel et al., 2004; Paton et al., 2006) to determine when behavior and neural responses began to change after the reversal. For each neuron and each image, we calculated the difference between the neural change point and the behavioral change point.
CCG analysis.
CCG analysis was performed for a total of 518 pairs of simultaneously recorded neurons (Perkel et al., 1967). Note that when more than two neurons were recorded simultaneously, a given neuron belonged to more than one pair. For each neuron pair, the CCG was computed for a window extending ±100 ms around the reference spike at time 0, with 1 ms time bins. The initial four trials and the four trials following reinforcement contingency reversal were removed before calculating CCG due to non-stationarity of the response over those learning trials. To control for covariation of the firing rates of the neuron pair due to shared stimulation or shared modulation in excitability, 500 shuffled CCGs were computed after shuffling the trials of one neuron with respect to the other. Trial shuffling was restricted such that trials of one CS × US condition were only shuffled with other trials of the same condition, because neuronal responses were generally stationary across trials of the same condition, but not always stationary across trials of different conditions.
Each actual and shuffled CCG was normalized by subtracting from each bin the mean count over all bins of that CCG. Then for each individual time bin, the shuffled CCG counts in that bin constituted a null distribution, and the actual CCG count in that bin was considered significant if it differed from the mean of the null distribution by three SDs or more, and highly significant if four SDs or more. We labeled an interaction as significant if, within ±10 ms around time 0, the actual CCG counts in three out of four consecutive bins exceeded the significant threshold, or the counts in two consecutive bins exceeded the highly significant threshold, in the same direction. For neuron pairs recorded from the same electrode, the center three bins (3 ms) were ignored, because spikes from different units triggered within ∼1 ms of one another often had interfering waveforms and were not consistently sorted. All significant interactions were classified as one of four types: common input, if there was a peak extending over the zero time bin; excitation, if there was a peak on only one side of the zero time bin; inhibition, if there was a trough on only one side of the zero time bin; mutual excitation–inhibition, if there were a peak on one side of the zero time bin and a trough on the other side.
Modulation of neuronal interactions.
We examined the modulation of neuronal interactions using the joint peristimulus time histogram (JPSTH) analysis (Aertsen et al., 1989). For every pair of neurons showing significant interaction on the CCG, we constructed JPSTHs, with 1 ms time bins, triggered on each of the four stimuli presented during the trace conditioning task: the fixation point, the images, reward, and air puff. To eliminate the contribution to a JPSTH from covariation in the individual firing rates of the two neurons, a predictor, computed as the outer product of the PSTHs of the two neurons, was subtracted from the JPSTH. This predictor is equivalent to an average over shift predictors of all possible orders (Palm et al., 1988). Thus, peaks/troughs present in the corrected JPSTH are those that cannot be accounted for by stimulus-induced increase/decrease of the firing rates of the two neurons.
To quantify and more easily visualize the modulation of these interactions, for each JPSTH we plotted counts from relevant bins as follows. Here, we refer to time relative to the stimulus as peristimulus time, and time relative to the spikes of the reference neuron of the JPSTH as perispike time, noting that the perispike time bins of the JPSTH are the time bins of the CCG. For each JPSTH, at each millisecond of peristimulus time, we summed the counts in those perispike time bins that were significant in the CCG; each such time plot was then individually peak-normalized (examples shown in Fig. 3). Thus, this plot of JPSTH counts is a measure of the modulation over time of the significant interaction found in the CCG. To determine whether a stimulus modulated an interaction, the JPSTH counts during the 500 ms before and the 1000 ms after stimulus onset were compared using the rank sum test. For pairs of cells showing mutual excitation–inhibition, analyses were performed separately for the excitation and the inhibition.
Figure 3.

A pair of value-coding neurons showing functional interaction modulated by task events. A, B, PSTHs aligned on CS onset for positive and negative trials plotted for two positive value-coding cells. Vertical dashed lines indicate fixation point onset (∼−1.2 s, averaged over trials), CS onset (0 s), and US onset (1.85 s). C, The CCG shows that the two cells receive common input. Significant bins are marked with asterisks above the histograms. D, E, Normalized JPSTH counts from the significant bins of the CCG in C, plotted against the time in the trial at which the counts were accumulated, for positive (D) and negative (E) trials. Vertical dashed lines are as in A and B. If the functional interaction was not modulated during the trial, then the JPSTH counts would be distributed evenly throughout the trial, but this is not the case here: the interaction is significantly enhanced by fixation point and suppressed by CS, reward, and air puff. Note that the normalized JPSTH counts are corrected against the JPSTH predictor, and thus measures interactions that cannot be accounted for by the covariation in the individual firing rates of the two neurons (see Materials and Methods).
Correlation between response properties and anatomy.
We examined the correlations between response properties of our recorded cells and their anatomical locations. In monkeys P and V, recordings were made from 16 and 22 grid holes, respectively, with the horizontal plane extensively sampled; in contrast, in monkeys L and R, recordings were made from only 5 and 7 grid holes, respectively. Thus, the amygdalae of monkeys L and R were not extensively sampled in the medial–lateral and anterior–posterior dimensions. Therefore, anatomical correlation was examined in monkeys P and V only.
The parameters with which we characterized neuronal responses included both continuous and discrete variables (Table 2). Many parameters did not follow normal distributions and both non-parametric and parametric tests were used to examine anatomical correlations. For each parameter, correlations with position along each of the three cardinal dimensions were tested with Kendall tau test (for continuous parameters) or rank sum test (for discrete parameters); in addition, multiple linear regression (for continuous parameters) or multiple logistic regression (for discrete parameters) was performed for each parameter, with positions along the three dimensions as independent variables.
Controlling for type I errors in multiple comparisons.
To control for type I errors in our tests for correlation between the large number of neural response parameters and anatomical locations, we calculated the positive false discovery rate (pFDR), a method robust to dependence among tests and with more power than corrections that control for the family-wise error rate (Storey, 2002, 2003). The pFDR for a given rejection criterion is the expected proportion of falsely rejected hypotheses among all rejected hypotheses, given that at least one hypothesis is rejected. For each monkey, each series of tests (for example, rank sum tests for all discrete parameters for all three dimensions) constituted a family, and a q value was computed for each p value within the family of tests. The q value is the pFDR analog of the p value: the minimal pFDR over all rejection regions containing the test statistic with the given p value. For each result we cite both p and q values. For all other tests in this study that involved multiple comparisons, small numbers of hypotheses were being tested together, and we used the more conservative Bonferroni correction to control for type I errors. In these instances we cite the p value and state the Bonferroni-corrected α that gave a family-wise error rate of 0.05.
Results
The trace conditioning task used in this study engaged multiple sensory systems and cognitive functions. During the task, the monkey learned to associate novel, arbitrary images with reinforcers: liquid reward, air puff, or no reinforcer. Amygdala neurons recorded during one or more periods of the task (Table 1) often responded to sensory stimuli that could include visual (image CS), somatosensory (air puff and liquid reward), taste (liquid reward), and auditory (sound of the air puff) components. Some neurons often changed their responses to a CS when reinforcement contingencies reversed, and the timing of these changes in activity was correlated with monkeys' behavioral learning (Paton et al., 2006). We refer to these neurons as value-coding neurons, because they characteristically respond more strongly to a CS-predicting reward (positive value-coding neurons) or air-puff (negative value-coding neurons), both before and after the reversal in reinforcement contingencies. Out of a total of 632 recorded neurons, 541 were recorded during both the initial and reversal learning periods of the trace conditioning task, which allowed value-coding classification; of these cells, 255 (47%) were value-coding, with 128 being positive value-coding and 127 being negative value-coding. Figure 1 depicts several examples of value-coding neurons. The response patterns of these neurons differed in at least three ways: (1) the sign of value-coding (positive vs negative value-coding), (2) the temporal pattern of value-coding (encoding value during the visual epoch or the trace epoch), and (3) whether CS presentation elicited an increase or decrease in firing. During the interval between CS and US onset, some cells fire above baseline on both trial types (87 positive cells, example cell in Fig. 1A; D, 23 negative), some fire below baseline on both trial types (Fig. 1B,17 positive; E, 73 negative), while others fire either above or below baseline depending on trial type (Fig. 1C, 24 positive; F, 31 negative). This diversity of response profiles motivated us to investigate the organization of amygdala neurons in relation to their physiological properties. In the remainder of the Results, we first characterize the interactions between amygdala neurons using CCG analysis and a JPSTH-based analysis, addressing two main questions: (1) whether there exist relationships between neurons' response properties and their functional interactions, and (2) how functional interactions between neurons are modulated by events occurring during the task. Next we examine how the value-coding, sensory, and other response properties of neurons relate to their anatomical locations within the amygdala.
Figure 1.

A variety of amygdala value-coding response patterns. PSTHs aligned on CS onset from three positive value-coding cells (A–C) and three negative value-coding cells (D–F). Blue and red lines show positive and negative trials, respectively; solid and dashed lines show, respectively, trials from before and after reversal of reinforcement contingencies. Vertical dashed lines indicate fixation point onset (∼−1.2 s, averaged over trials), CS onset (0 s), and US onset (1.85 s). Horizontal dashed line indicates baseline level of activity. These cells encode “value” in that their responses to the CSs reflect whether the associated US is positive or negative, and do not reflect the identity of the CSs.
Functional interactions between amygdala neurons
Out of a total of 518 pairs of simultaneously recorded amygdala cells, 51 pairs (9.8%) showed significant interaction on the CCG. The 51 interacting pairs were classified into four categories (see Materials and Methods): common input (n = 27), excitation (n = 12), inhibition (n = 4), and mutual excitation–inhibition (n = 8). Figure 2A–D show CCGs between four pairs of neurons that illustrate these four categories. We note that these are categories of effective connectivity, each of which could result from different combinations of anatomical connectivity and dynamical properties of the circuits involved. It is possible that among the neuron pairs we examined, some did functionally interact but failed to produce significant CCG counts because of relatively low spike counts and small number of trials.
Figure 2.

CCG analysis reveals functional connectivity between neurons within the amygdala. A–D, Example CCGs between four pairs of neurons illustrating the four types of interactions observed: common input (A), excitation (B), inhibition (C), and mutual excitation–inhibition (D). The deep troughs within ±1 ms in B–D were due to the respective cell pairs being each recorded on the same electrode (simultaneous spikes from two units cannot be detected on the same electrode). E, Interacting pairs of cells (n = 51) are located closer on the ventral–dorsal axis than non-interacting pairs (n = 467; p < 10−5, rank sum test). F, Pairs with putative direct connections (excitation, inhibition, and mutual excitation–inhibition; n = 24) are located closer on the ventral–dorsal axis than pairs with putative common input (n = 27; p < 10−3, rank sum test).
In each of our recording sessions, all electrodes were placed in a single hole of the recording grid (see Materials and Methods), with ∼320 μm in the medial–lateral/anterior–posterior dimensions between any two electrodes. As a result, the two cells of each simultaneously recorded cell pair had approximately the same medial–lateral and anterior–posterior positions, while their dorsal–ventral positions could differ substantially. We found that interacting pairs of cells were located closer on the dorsal–ventral axis than non-interacting pairs (Fig. 2E; p < 10−5, rank sum test). Pairs with putative direct connections (excitation, inhibition, and mutual excitation–inhibition) were also located closer on the dorsal–ventral axis than pairs with putative common input (Fig. 2F; p < 10−3, rank sum test).
Task-related modulation of neuronal interactions
Functional interactions between neurons are not simply a static property of neural circuits; they can be dynamically modulated by task-related variables and events (Espinosa and Gerstein, 1988; Ahissar et al., 1992a, 1992b; Vaadia et al., 1995; Paz et al., 2006; Fujisawa et al., 2008; Takeuchi et al., 2011). To determine the extent to which functional interactions are task-modulated in the circuits we have studied, we performed JPSTH analysis for each pair of cells that showed significant CCG interactions as established in the last section. JPSTH can be thought of as a series of CCGs over the time course of the trial, revealing the modulation of functional interactions over the course of the trial and by task events. This modulation of effective connectivity might reflect the action of neuromodulators or the synaptic dynamics of the network in which the interacting pair is embedded (Aertsen et al., 1989; Haider and McCormick, 2009).
Figure 3 shows an example of an interaction between two positive value-coding cells. As can be seen from their PSTHs (Fig. 3A,B), these two cells have different firing properties (firing rate, response patterns to stimuli, etc.), but both fire at higher rates in response to a reward-predicting CS (solid traces) than to an air puff-predicting CS (dashed traces). The CCG suggests that the cells receive common input (Fig. 3C). Figure 3, D and E, show JPSTH counts in the significant CCG time bins, plotted over time, corrected against the JPSTH predictor, and peak-normalized. Thus, the normalized JPSTH counts indicate interactions that cannot be accounted for by the covariation in the individual firing rates of the two neurons (see Materials and Methods). The interaction is significantly enhanced by the fixation point and suppressed by CSs, rewards, and air puffs (p < 0.05, rank sum test for counts in the 0.5 s before and 1 s after the stimulus, for each stimulus). Out of 51 pairs of cells with significant CCG interactions, we found that the interactions of 49 pairs (96%) were modulated by at least one of the stimuli (fixation point, CS, reward, air puff) presented during the task.
Using an appetitive trace-conditioning task, Paz et al. (2006) found that CCG interactions were modulated by reward in the basolateral amygdala of cats. Our paradigm involved a larger set of stimuli. Out of 59 interactions (the two interactions of mutual excitation–inhibition pairs—the excitation and the inhibition—were often differentially modulated and were counted as two interactions), 55.9%, 59.3%, 42.4%, and 37.3% of the interactions were modulated by fixation point, image CS, reward, and air puff, respectively; 62.7% of the interactions were modulated by more than one stimulus. Interactions were significantly more likely to be modulated by cues (fixation point or image) than by reinforcers (reward or air puff; p = 0.0157, likelihood ratio test). Overall, these results indicate that engagement with task events modulates functional coupling between cells within the amygdala.
Next, we wanted to examine whether certain patterns of stimuli modulation occurred more often than would be expected by chance. For example, do interactions between neurons tend to be both enhanced by the fixation point and suppressed by the CS, as exhibited by the pair of cells in Figure 3? There are six pairs of stimuli (fixation point and CS, fixation point and reward, etc.) and each interaction is affected in one of three ways by a stimulus (suppressed, enhanced, or not modulated). We used the χ2 test to assess the dependence between modulations by each pair of stimuli—for example, whether enhancement by the fixation point and suppression by the CS of the same interaction occurred more often than expected by chance. No significant dependence was found for any pair of stimuli (p = 0.012 for fixation point and air puff, p > 0.2 for all other pairs, α = 0.0083). This suggests a heterogeneous picture of interactions and modulations in amygdala circuits, without stereotypical task-modulation patterns across interactions, even within the context of a relatively stereotyped task that monkeys performed many times.
Value-coding functional circuits
We next sought to determine if the value-coding properties of neurons were related to the functional interactions we observed. We first examined the frequencies of functionally interacting pairs of neurons with different value-coding properties. We found that pairs of value-coding neurons with the same value-coding sign are significantly more likely to interact than pairs of neurons with opposite signs (Fig. 4A; p = 0.0187, Fisher's exact test). The value-coding signs of these same-sign interacting pairs were not biased toward either the positive or negative sign (p = 0.75, χ2 test), indicating that there are both positive and negative value-processing circuits. These positive and negative circuits are not completely segregated, as neurons with opposite value-coding signs do interact (3 out of 48 opposite-sign pairs). Overall, however, it appears that a key defining characteristic of individual amygdala neurons—the sign of value-coding—also defines a key organizing principle of amygdala circuits. This organization potentially underlies the differential learning rates of positive and negative value-coding cells in reversal learning (Morrison et al., 2011), an observation likely resulting from circuit-level mechanisms.
Figure 4.
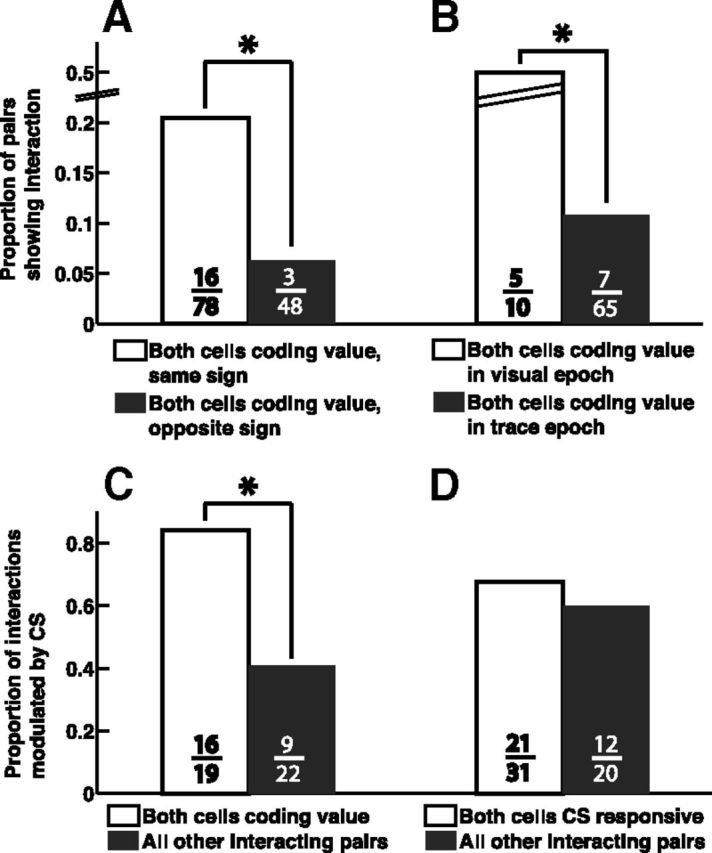
Value-coding functional circuits within the amygdala. A, More functional interactions were found among pairs of value-coding neurons that had the same value-coding sign than among pairs with opposite signs (p = 0.0187, Fisher's exact test). B, More interactions were found among pairs that both encoded value in the visual stimulus epoch than among pairs both coding value in the trace epoch (p = 0.002, χ2 test). C, Interactions between pairs of value-coding cells were more likely to be modulated by CSs (p = 0.005, Fisher's exact test with α = 0.0125). D, Interactions between pairs of CS-responsive cells were not more likely to be modulated by CSs than other pairs (p = 0.57, χ2 test). The numbers on each bar indicate the number of pairs making up the corresponding proportion.
In our dataset, 58 value-coding cells encoded value during the visual epoch (the 300 or 350 ms of CS presentation), 176 cells encoded value during the trace epoch (the 1500 ms between CS offset and US delivery), and 8 cells encoded value during both epochs. Does the temporal patterns of value-coding relate to interactions in value-coding circuits? We found that pairs of visual epoch value-coding cells are significantly more likely to interact than pairs of trace epoch value-coding cells (Fig. 4B; p = 0.0016, χ2 test; the 8 cells encoding value in both epochs were excluded from this analysis). This extensive connectivity among visual epoch cells may reflect the circuitry needed for associating arbitrary visual CSs with USs, a function in which visual epoch cells may be preferentially involved.
When comparing interacting pairs of same-sign value-coding neurons with opposite-sign ones, we found no significant difference between the relative proportions of interacting pairs with putative common input and putative direct connections (p = 0.32, Fisher's exact test). This was also true when we compared interacting pairs of visual epoch value-coding neurons with trace epoch ones (p = 0.27, Fisher's exact test), although we note that sample sizes were small in both cases (n = 19 for same-sign vs opposite-sign, n = 12 for visual epoch vs trace epoch).
In this study, we found three factors to be predictive of whether a pair of amygdala neurons functionally interact: interaction is more likely if the cells encode value with the same sign, encode value in the visual epoch, or are located close in space. We performed several analyses to control for the possibility that one or more of the three factors are confounds. First, we tested the three variables pairwise to determine if they are dependent. Cells of same sign value-coding pairs were not located closer to each other than cells of opposite sign pairs (p = 0.66, rank sum test); neither were cells of visual epoch value-coding pairs closer than cells of trace epoch pairs (p = 0.50, rank sum test); whether a pair of cells encodes value with the same or opposite sign was independent of whether they both encode value in the visual or trace epoch (p = 0.26, Fisher's exact test). Furthermore, logistic regression, with the three factors as independent variables and the presence or absence of functional interaction as the dependent variable, showed that all three variables are independently predictive of functional interaction (p < 0.0045 for each of the three regression coefficients, Wald test, α = 0.017).
We also examined the frequencies of stimulus-modulated interactions among value-coding cells and other cells. Interactions between value-coding cells were more likely to be modulated by CSs than interactions between pairs of cells that were not both value-coding (Fig. 4C; p = 0.005, χ2 test with α = 0.0125); stimuli other than the CSs did not preferentially modulate value-coding pairs or other pairs (p > 0.23 for fixation point and air puff, p = 0.045 for reward, χ2 test with α = 0.0125). Many value-coding cells are CS-responsive, so naively one might attribute the CS modulation of their interactions to their being CS-responsive. However, interactions between pairs of cells that are both responsive to CSs (but may or may not be value-coding) are not more likely to be modulated by CSs (Fig. 4D; p = 0.57, χ2 test). This dissociation between responsiveness and modulation of functional connectivity emphasizes the specificity, of CS modulation of interactions, to value-coding circuits. This highlights the involvement of amygdala value-coding circuits in processing stimuli that are associated with motivationally significant outcomes, and potentially in mediating the process of linking affective significance to CSs.
Finally, we did not find any significant relationships between the value-coding sign (positive vs negative) of neurons and their baseline firing rate (p > 0.5 for three monkeys, p = 0.07 for one monkey, rank sum test). Furthermore, positive and negative cells had overlapping spike width distributions. We note that in the cat amygdala, spike width varies largely depending on the position of the electrode with respect to the cell, and baseline firing rate and spike width were found to be not sufficient for classification of cells into projection neurons and interneurons (Likhtik et al., 2006).
Anatomical distribution of response properties
The CCG and JPTSH analyses revealed new details concerning functional coupling of neurons in the amygdala. We next sought to determine whether there exists anatomical organization that relates to the physiological properties of the circuits we have identified, by examining the correlations between the response properties of cells and their anatomical locations. Each neuron in our dataset was recorded during one or more periods of the trace conditioning task and the random task (Table 1), and each neuron was characterized by up to 26 parameters (Table 2). For each parameter, correlations with position along each of the three cardinal dimensions were tested with Kendall tau test (for continuous parameters) or rank sum test (for discrete parameters); in addition, multiple linear regression (for continuous parameters) or multiple logistic regression (for discrete parameters) was performed for each parameter, with positions along the three dimensions as independent variables. Because our recordings did not extensively sample the amygdalae of monkeys L and R, anatomical correlations were only examined in monkeys P and V (see Materials and Methods). Reconstructions of the recording sites in the amygdalae of monkeys P and V are shown in Figure 5.
Thus far, we have shown that value-coding cells form positive and negative functional circuits. On the other hand, we found that positive, negative, and non-value-coding cells are anatomically colocalized and distributed throughout the amygdala in both monkeys (Figs. 5, 6). Anatomical position was not found to consistently predict whether a cell encodes value (p > 0.16 for each dimension in each monkey, except p = 0.013, q = 0.042 for anterior–posterior position in monkey P, rank sum test; also, p > 0.34 for each dimension in each monkey, Wald test for the logistic regression coefficients, except p = 0.025, q = 0.14 for anterior–posterior position in monkey V, p = 0.037, q = 0.16 for anterior–posterior position in monkey P, but the correlations are in opposite directions for the two monkeys), or whether a value-coding cell is positive or negative (Fig. 6; p > 0.12 for each dimension in each monkey, rank sum test; also, p > 0.12 for each dimension in each monkey, Wald test for the logistic regression coefficients), suggesting that the distinct positive and negative functional circuits we found are not anatomically restricted to separate regions of the amygdala. However, cells encoding value in the visual epoch and cells encoding value in the trace epoch show some degree of segregation, especially along the medial–lateral axis, with visual epoch value-coding cells located more laterally (Fig. 6; see figure for statistics). This localization of visual epoch value-coding cells to the lateral regions is perhaps a manifestation of a larger anatomical trend we observed concerning visual responses (see below).
Figure 6.

Positive and negative value-coding cells are distributed throughout the amygdala, while visual epoch and trace epoch value-coding cells are more anatomically segregated. A–F, Cumulative distribution functions of the position of positive value-coding (blue), negative value-coding (red), visual epoch value-coding (green), and trace epoch value-coding (magenta) cells, in the medial–lateral (A, B), anterior–posterior (C, D), and ventral–dorsal (E, F) dimensions, for monkeys P (A, C, E) and V (B, D, F). Arrowheads indicate the median locations of the distributions. p values from rank sum test and q values are indicated for all results with p < 0.05 (marked by asterisks). Anatomical coordinates are normalized separately in each monkey and each spatial dimension such that 0 in each monkey and dimension is the location of the most medial/anterior/ventral cell recorded in that monkey.
Regarding the localization of cells responsive to different sensory stimuli, we hypothesized that they would be prevalent in the lateral amygdala, given anatomical evidence that sensory information of all modalities primarily arrives in the lateral nucleus (Pitkänen and Amaral, 1998; Stefanacci and Amaral, 2000, 2002). Furthermore, we expected emotionally significant sensory stimuli to additionally evoke responses in the medial regions, as the central and medial nuclei are involved in mediating behavioral and autonomic responses to these emotional stimuli (LeDoux, 2000; Maren, 2005; Balleine and Killcross, 2006; Murray, 2007).
Our task involved four stimuli: the fixation point, a visual stimulus with comparatively little emotional significance; the images that served as CSs, visual stimuli that have acquired some emotional significance due to their association with the USs; the liquid reward, a multimodal stimulus emotionally highly significant to the animal; and the similarly significant air puff. The localization of responses to these four stimuli confirmed our hypothesis. Responsiveness to the fixation point was highly significantly correlated with medial–lateral location in both monkeys, with more fixation point responsive cells at more lateral locations (Fig. 7A,B; see figure for rank sum test statistics; also p < 10−3, q < 0.015 for each monkey, Wald test for the logistic regression coefficient for medial–lateral position). Weaker correlation in the same direction was also observed between CS image responsiveness and medial–lateral location in both monkeys (Fig. 7C,D; see figure for rank sum test statistics; also p = 0.032, q = 0.12 for monkey V, p = 0.24 for monkey P, Wald test for the logistic regression coefficient for medial-lateral position). Furthermore, although short image response latencies (∼100 ms) were observed throughout the medial–lateral extent, cells in the lateral regions had shorter image response latencies (p = 0.012, q = 0.041 for monkey P; p = 0.007, q = 0.026 for monkey V; Kendall tau test). On the other hand, response to reward (Fig. 7E,F) or air puff (Fig. 7G,H) are not correlated with medial–lateral position (p > 0.19 for each stimulus and monkey, rank sum test; also, p > 0.15 for each stimulus and monkey, Wald test for the logistic regression coefficient for medial–lateral position).
Figure 7.
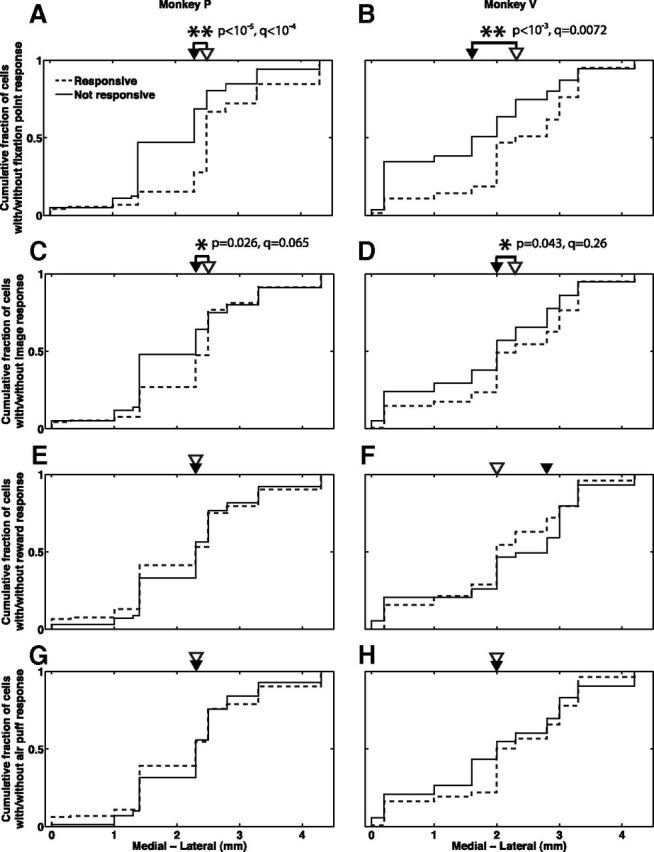
Responses to emotionally less significant stimuli are more prevalent in the lateral regions, while responses to emotionally more significant stimuli are prevalent throughout the medial-lateral extent. A, B, Cumulative distribution functions of the medial–lateral location of neurons responsive (dashed lines) and not responsive (solid lines) to the fixation point, for monkeys P (A) and V (B). Empty and solid arrowheads indicate the median locations of the responsive and not responsive distributions, respectively. C, D, Same as A, B for response to the visual CSs. E, F, Same as A, B for response to the reward. G, H, Same as A, B for response to the air puff. p values from rank sum test and q values are indicated for all results with p < 0.05 (marked by asterisks). Anatomical coordinates are normalized such that 0 in each monkey is the location of the most medial cell recorded in that monkey.
We also observed an anatomical trend with regard to baseline firing rate. Multiple regression shows that baseline firing rates were higher in the dorsal, posterior, and medial regions of the amygdala in both monkeys (p < 10−14, q < 10−13 for monkey P; p < 10−6, q < 10−5 for monkey V; F test). When each dimension was analyzed independently, significant correlation was observed for the dorsal–ventral axis in both monkeys (p < 10−11, q < 10−9 for monkey P; p = 0.01, q = 0.029 for monkey V; Kendall tau test). This is in agreement with the observation in rabbits and primates of high-firing neurons in the centromedial nuclei (Pascoe and Kapp, 1985; Mosher et al., 2010), perhaps suggesting the existence of a population of inhibitory interneurons there, as they tend to have higher firing rates than excitatory projection neurons.
No significant anatomical correlation consistent across monkeys was found for any other parameters, indicating that most of the response properties we studied do not show clear anatomical organization.
Discussion
Circuit-level studies, in the context of fear conditioning in rodents, have revealed that the rodent amygdala contains highly organized functional circuits that mediate the acquisition, expression, and extinction of fear memory (Paré et al., 2004; Ehrlich et al., 2009; Ciocchi et al., 2010; Haubensak et al., 2010). On the other hand, although it has long been known that the primate amygdala participates in appetitive as well as aversive behavior, understanding of the circuits mediating these behaviors has been lacking (Murray, 2007). Here, we report that in the primate amygdala, value-coding cells that preferentially respond to rewarding and aversive CSs form distinct circuits, the interactions of which are dynamically modulated as the animal uses CSs to predict rewarding and aversive outcomes.
Value-coding circuits
Previously we have established that information about rewarding and aversive stimuli converge at the level of individual amygdala cells: positive and negative value-coding cells, while “preferring” CSs and/or USs of one valence, often respond to stimuli of the other valence as well (Belova et al., 2008), a phenomenon also seen in orbitofrontal cortex (Morrison and Salzman, 2009). This raises a fundamental question about the organization of amygdala value-coding circuits: do the positive and negative value-coding cells form a single integrated value-coding circuit, or do they form distinct circuits? In this study, we provide evidence that value-coding neurons in the amygdala indeed form distinct, yet interconnected, positive and negative circuits, which produce outputs that can potentially guide relevant approach and avoidance behaviors. Consistent with the existence of distinct appetitive and aversive circuits, we recently showed that during reversal learning, positive and negative value-coding cells in the amygdala change their responses at different rates upon changes in CS–US contingencies, a finding that also applied to the orbitofrontal cortex (Morrison et al., 2011).
Functional interactions in the context of a similar conditioning and reversal learning task have previously been examined in the rodent amygdala, where separate CCGs for different phases of learning revealed changes in functional interactions over the course of learning (Schoenbaum et al., 2000). In the current study, relatively low spike counts and small numbers of trials for many neuron pairs prevented similar approaches of analyzing separate CCGs for pre-reversal/post-reversal trials or positive/negative reinforcement trials, which may yield interesting insights in future monkey amygdala studies with longer recording durations.
By what mechanisms are task-related modulations of amygdala circuits accomplished? One possibility is that they are mediated by neuromodulators. The monkey amygdala receives noradrenergic input from the locus coeruleus (Bowden et al., 1978) and cholinergic input from the nucleus basalis of Meynert (Jones et al., 1976; Mesulam et al., 1983). Locus coeruleus neurons exhibit responses that correlate with attention and arousal, and selective responses to visual cues in a discrimination task (Aston-Jones et al., 1994; Rajkowski et al., 1994); meanwhile, the nucleus basalis is also involved in attention and responds to predictive visual cue and liquid reward (Richardson and DeLong, 1986). Although the present study does not include a psychophysical measure of arousal or attention, it is reasonable to speculate that the cues and USs in our task modulated the attentional state of the animal. Thus, noradrenaline and acetylcholine could potentially mediate attentional modulation of amygdala value-coding circuits.
In addition, the amygdala is innervated by midbrain dopamine neurons (Cho and Fudge, 2010), which respond to CSs, rewards, and air puffs—to which they respond differentially at different stages of learning—apparently encoding “reward prediction error” (Schultz, 1998; Matsumoto and Hikosaka, 2009). It is possible that modulation of value-coding networks by dopamine contributes to learning in the amygdala. In the current study, we found that more amygdala interactions were modulated by cues than by USs. While this may result from the circuit dynamics within amygdala, the fact that we did not observe more amygdala cells responding to cues than to USs (388 cues responsive cells, 426 US responsive, 632 total) make this possibility less likely. Alternatively, preferential modulation of amygdala interactions by cues might reflect modulation by dopaminergic input; consistent with this idea, after learning, the reward prediction error encoded by dopamine neurons occurs at the presentation of predictive cues, not at the time of USs.
Finally, responses similar to the value-coding activity in the primate amygdala have been observed in the rodent amygdala during a variety of tasks involving both appetitive and aversive conditioning (Schoenbaum et al., 1998; Ambroggi et al., 2008; Herry et al., 2008; Tye et al., 2008; Shabel and Janak, 2009; Ciocchi et al., 2010; Haubensak et al., 2010). Given the remarkable similarity in the responses to CSs of different modalities between rodent and primate amygdala cells, it would be interesting to examine how amygdala value-coding neurons identified in the monkey map onto well-characterized neurons in the rodent amygdala. For example, it is possible that the “extinction neurons” identified in the context of fear conditioning in rodents (Herry et al., 2008) are homologous to a distinct subset of positive value-coding neurons in primates. Testing such a hypothesis will require further investigations in both primates and rodents using similar behavioral paradigms.
Anatomical organization of response properties
We have shown that positive and negative value-coding cells are distributed throughout the primate amygdala and anatomically intermingled. Interestingly, cells in the basal and central nuclei of the mouse amygdala that exhibit value-coding-like responses also appear to be intermingled (Herry et al., 2008; Haubensak et al., 2010).
We observed that visual responses to the fixation point and the CSs are more prevalent and faster in the lateral regions of the amygdala, while responses to liquid reward and air puff (multimodal stimuli involving taste, somatosensation, and audition) are more evenly distributed throughout the medial–lateral extent, in agreement with the localization of visual, auditory, and “ingestion” responses reported by Nishijo et al. (1988a). Given current knowledge of the anatomy of sensory inputs and the likely mechanisms for CS–US associations in the amygdala, we interpret the differential localization of responses to the four stimuli in our experiment as reflecting the different levels of emotional significance associated with the stimuli. The least emotionally significant stimulus, the fixation point, evokes responses largely from the lateral amygdala, the site of sensory afferent into the amygdala (Pitkänen and Amaral, 1998; Stefanacci and Amaral, 2000, 2002). Responses to the emotionally significant CSs are less restricted to the lateral regions, and responses to the even more significant USs are equally prevalent in both lateral and medial regions—the CS and US likely recruit cells in the medial and central nuclei that mediate appropriate behaviors and autonomic responses, in addition to eliciting sensory responses from the lateral nucleus. There is controversy in the field regarding the specific roles of amygdala nuclei in associating CSs with USs: according to the “serial model,” CS and US information converge in the basolateral nuclei, which activates the centromedial nuclei to mediate responses (LeDoux, 2000; Maren, 2005); according to the “parallel model,” the basolateral and centromedial nuclei independently mediate different aspects of reinforcement learning and drive different components of the animal's response (Balleine and Killcross, 2006; Murray, 2007). Our anatomical findings are compatible with both models, and additional experiments are needed to examine this question at the neurophysiological level.
Overall, we found that many response properties are distributed throughout the amygdala and do not demonstrate clear anatomical organization. This is in agreement with Mosher et al. (2010), who found that the monkey basolateral and centromedial nuclei show large overlaps in response properties. Together, these findings suggest distributed processing of information in the primate amygdala.
Conclusion
Given the complexity of amygdala neural responses and of their potentially important role in emotional and motivated behavior, it is crucial to understand amygdala function on the circuit level. Using classic techniques, the present study represents the beginning of an effort toward understanding the value-coding circuitry of the primate amygdala. Here, we provided evidence that a key defining characteristic of individual amygdala neurons—the sign of value-coding—also defines a key organizing principle of amygdala circuits. The appetitive and aversive circuits identified here were dynamically modulated during the performance of a conditioning task, indicating the direct relevance of these circuits to behavior. As new techniques developed in rodent preparations become adapted for use in the monkey, more detailed analysis of the identity and function of the circuits we have described will help to decipher the complex cognitive and emotional functions of the amygdala.
Footnotes
This work was supported by grants from the National Institute of Drug Abuse (NIDA) (R01 DA020656), the Sloan, James S. McDonnell, and Gatsby foundations, and by a Charles E. Culpeper Scholarship award from Goldman Philanthropic Partnerships to C.D.S. W.Z. and D.M.S. received support from an institutional training grant from NINDS (5T32 HD07430). S.E.M. received support from a National Science Foundation graduate fellowship and from an individual NIMH National Research Service Award (F31 MH081620). We thank B. Lau, C. Peck, P. Kaifosh, and members of the Salzman Laboratory for help with data analysis.
The authors declare no competing financial interests.
References
- Aertsen AM, Gerstein GL, Habib MK, Palm G. Dynamics of neuronal firing correlation: modulation of “effective connectivity.”. J Neurophysiol. 1989;61:900–917. doi: 10.1152/jn.1989.61.5.900. [DOI] [PubMed] [Google Scholar]
- Ahissar M, Ahissar E, Bergman H, Vaadia E. Encoding of sound-source location and movement: activity of single neurons and interactions between adjacent neurons in the monkey auditory cortex. J Neurophysiol. 1992a;67:203–215. doi: 10.1152/jn.1992.67.1.203. [DOI] [PubMed] [Google Scholar]
- Ahissar E, Vaadia E, Ahissar M, Bergman H, Arieli A, Abeles M. Dependence of cortical plasticity on correlated activity of single neurons and on behavioral context. Science. 1992b;257:1412–1415. doi: 10.1126/science.1529342. [DOI] [PubMed] [Google Scholar]
- Ambroggi F, Ishikawa A, Fields HL, Nicola SM. Basolateral amygdala neurons facilitate reward-seeking behavior by exciting nucleus accumbens neurons. Neuron. 2008;59:648–661. doi: 10.1016/j.neuron.2008.07.004. [DOI] [PMC free article] [PubMed] [Google Scholar]
- Aston-Jones G, Rajkowski J, Kubiak P, Alexinsky T. Locus coeruleus neurons in monkey are selectively activated by attended cues in a vigilance task. J Neurosci. 1994;14:4467–4480. doi: 10.1523/JNEUROSCI.14-07-04467.1994. [DOI] [PMC free article] [PubMed] [Google Scholar]
- Balleine BW, Killcross S. Parallel incentive processing: an integrated view of amygdala function. Trends Neurosci. 2006;29:272–279. doi: 10.1016/j.tins.2006.03.002. [DOI] [PubMed] [Google Scholar]
- Baxter MG, Murray EA. The amygdala and reward. Nat Rev Neurosci. 2002;3:563–573. doi: 10.1038/nrn875. [DOI] [PubMed] [Google Scholar]
- Belova MA, Paton JJ, Morrison SE, Salzman CD. Expectation modulates neural responses to pleasant and aversive stimuli in primate amygdala. Neuron. 2007;55:970–984. doi: 10.1016/j.neuron.2007.08.004. [DOI] [PMC free article] [PubMed] [Google Scholar]
- Belova MA, Paton JJ, Salzman CD. Moment-to-moment tracking of state value in the amygdala. J Neurosci. 2008;28:10023–10030. doi: 10.1523/JNEUROSCI.1400-08.2008. [DOI] [PMC free article] [PubMed] [Google Scholar]
- Bermudez MA, Schultz W. Responses of amygdala neurons to positive reward-predicting stimuli depend on background reward (contingency) rather than stimulus-reward pairing (contiguity) J Neurophysiol. 2010a;103:1158–1170. doi: 10.1152/jn.00933.2009. [DOI] [PMC free article] [PubMed] [Google Scholar]
- Bermudez MA, Schultz W. Reward magnitude coding in primate amygdala neurons. J Neurophysiol. 2010b;104:3424–3432. doi: 10.1152/jn.00540.2010. [DOI] [PMC free article] [PubMed] [Google Scholar]
- Bowden DM, German DC, Poynter WD. An autoradiographic, semistereotaxic mapping of major projections from locus coeruleus and adjacent nuclei in Macaca mulatta. Brain Res. 1978;145:257–276. doi: 10.1016/0006-8993(78)90861-2. [DOI] [PubMed] [Google Scholar]
- Cho YT, Fudge JL. Heterogeneous dopamine populations project to specific subregions of the primate amygdala. Neuroscience. 2010;165:1501–1518. doi: 10.1016/j.neuroscience.2009.11.004. [DOI] [PMC free article] [PubMed] [Google Scholar]
- Ciocchi S, Herry C, Grenier F, Wolff SB, Letzkus JJ, Vlachos I, Ehrlich I, Sprengel R, Deisseroth K, Stadler MB, Müller C, Lüthi A. Encoding of conditioned fear in central amygdala inhibitory circuits. Nature. 2010;468:277–282. doi: 10.1038/nature09559. [DOI] [PubMed] [Google Scholar]
- Dayan P, Balleine BW. Reward, motivation, and reinforcement learning. Neuron. 2002;36:285–298. doi: 10.1016/s0896-6273(02)00963-7. [DOI] [PubMed] [Google Scholar]
- Dayan P, Niv Y. Reinforcement learning: the good, the bad and the ugly. Curr Opin Neurobiol. 2008;18:185–196. doi: 10.1016/j.conb.2008.08.003. [DOI] [PubMed] [Google Scholar]
- Ehrlich I, Humeau Y, Grenier F, Ciocchi S, Herry C, Lüthi A. Amygdala inhibitory circuits and the control of fear memory. Neuron. 2009;62:757–771. doi: 10.1016/j.neuron.2009.05.026. [DOI] [PubMed] [Google Scholar]
- Espinosa IE, Gerstein GL. Cortical auditory neuron interactions during presentation of 3-tone sequences: effective connectivity. Brain Res. 1988;450:39–50. doi: 10.1016/0006-8993(88)91542-9. [DOI] [PubMed] [Google Scholar]
- Fujisawa S, Amarasingham A, Harrison MT, Buzsáki G. Behavior-dependent short-term assembly dynamics in the medial prefrontal cortex. Nat Neurosci. 2008;11:823–833. doi: 10.1038/nn.2134. [DOI] [PMC free article] [PubMed] [Google Scholar]
- Gallistel CR, Fairhurst S, Balsam P. The learning curve: implications of a quantitative analysis. Proc Natl Acad Sci U S A. 2004;101:13124–13131. doi: 10.1073/pnas.0404965101. [DOI] [PMC free article] [PubMed] [Google Scholar]
- Haider B, McCormick DA. Rapid neocortical dynamics: cellular and network mechanisms. Neuron. 2009;62:171–189. doi: 10.1016/j.neuron.2009.04.008. [DOI] [PMC free article] [PubMed] [Google Scholar]
- Haubensak W, Kunwar PS, Cai H, Ciocchi S, Wall NR, Ponnusamy R, Biag J, Dong HW, Deisseroth K, Callaway EM, Fanselow MS, Lüthi A, Anderson DJ. Genetic dissection of an amygdala microcircuit that gates conditioned fear. Nature. 2010;468:270–276. doi: 10.1038/nature09553. [DOI] [PMC free article] [PubMed] [Google Scholar]
- Herry C, Ciocchi S, Senn V, Demmou L, Müller C, Lüthi A. Switching on and off fear by distinct neuronal circuits. Nature. 2008;454:600–606. doi: 10.1038/nature07166. [DOI] [PubMed] [Google Scholar]
- Jones EG, Burton H, Saper CB, Swanson LW. Midbrain, diencephalic and cortical relationships of the basal nucleus of Meynert and associated structures in primates. J Comp Neurol. 1976;167:385–419. doi: 10.1002/cne.901670402. [DOI] [PubMed] [Google Scholar]
- LeDoux JE. Emotion circuits in the brain. Annu Rev Neurosci. 2000;23:155–184. doi: 10.1146/annurev.neuro.23.1.155. [DOI] [PubMed] [Google Scholar]
- Likhtik E, Pelletier JG, Popescu AT, Paré D. Identification of basolateral amygdala projection cells and interneurons using extracellular recordings. J Neurophysiol. 2006;96:3257–3265. doi: 10.1152/jn.00577.2006. [DOI] [PubMed] [Google Scholar]
- Maren S. Building and burying fear memories in the brain. Neuroscientist. 2005;11:89–99. doi: 10.1177/1073858404269232. [DOI] [PubMed] [Google Scholar]
- Matsumoto M, Hikosaka O. Two types of dopamine neuron distinctly convey positive and negative motivational signals. Nature. 2009;459:837–841. doi: 10.1038/nature08028. [DOI] [PMC free article] [PubMed] [Google Scholar]
- McGaugh JL. The amygdala modulates the consolidation of memories of emotionally arousing experiences. Annu Rev Neurosci. 2004;27:1–28. doi: 10.1146/annurev.neuro.27.070203.144157. [DOI] [PubMed] [Google Scholar]
- Mesulam MM, Mufson EJ, Levey AI, Wainer BH. Cholinergic innervation of cortex by the basal forebrain: cytochemistry and cortical connections of the septal area, diagonal band nuclei, nucleus basalis (substantia innominata), and hypothalamus in the rhesus monkey. J Comp Neurol. 1983;214:170–197. doi: 10.1002/cne.902140206. [DOI] [PubMed] [Google Scholar]
- Morrison SE, Salzman CD. The convergence of information about rewarding and aversive stimuli in single neurons. J Neurosci. 2009;29:11471–11483. doi: 10.1523/JNEUROSCI.1815-09.2009. [DOI] [PMC free article] [PubMed] [Google Scholar]
- Morrison SE, Salzman CD. Re-valuing the amygdala. Curr Opin Neurobiol. 2010;20:221–230. doi: 10.1016/j.conb.2010.02.007. [DOI] [PMC free article] [PubMed] [Google Scholar]
- Morrison SE, Saez A, Lau B, Salzman CD. Different time courses for learning-related changes in amygdala and orbitofrontal cortex. Neuron. 2011;71:1127–1140. doi: 10.1016/j.neuron.2011.07.016. [DOI] [PMC free article] [PubMed] [Google Scholar]
- Mosher CP, Zimmerman PE, Gothard KM. Response characteristics of basolateral and centromedial neurons in the primate amygdala. J Neurosci. 2010;30:16197–16207. doi: 10.1523/JNEUROSCI.3225-10.2010. [DOI] [PMC free article] [PubMed] [Google Scholar]
- Murray EA. The amygdala, reward and emotion. Trends Cogn Sci. 2007;11:489–497. doi: 10.1016/j.tics.2007.08.013. [DOI] [PubMed] [Google Scholar]
- Nishijo H, Ono T, Nishino H. Topographic distribution of modality-specific amygdalar neurons in alert monkey. J Neurosci. 1988a;8:3556–3569. doi: 10.1523/JNEUROSCI.08-10-03556.1988. [DOI] [PMC free article] [PubMed] [Google Scholar]
- Nishijo H, Ono T, Nishino H. Single neuron responses in amygdala of alert monkey during complex sensory stimulation with affective significance. J Neurosci. 1988b;8:3570–3583. doi: 10.1523/JNEUROSCI.08-10-03570.1988. [DOI] [PMC free article] [PubMed] [Google Scholar]
- Palm G, Aertsen AM, Gerstein GL. On the significance of correlations among neuronal spike trains. Biol Cybern. 1988;59:1–11. doi: 10.1007/BF00336885. [DOI] [PubMed] [Google Scholar]
- Paré D, Quirk GJ, Ledoux JE. New vistas on amygdala networks in conditioned fear. J Neurophysiol. 2004;92:1–9. doi: 10.1152/jn.00153.2004. [DOI] [PubMed] [Google Scholar]
- Pascoe JP, Kapp BS. Electrophysiological characteristics of amygdaloid central nucleus neurons during Pavlovian fear conditioning in the rabbit. Behav Brain Res. 1985;16:117–133. doi: 10.1016/0166-4328(85)90087-7. [DOI] [PubMed] [Google Scholar]
- Paton JJ, Belova MA, Morrison SE, Salzman CD. The primate amygdala represents the positive and negative value of visual stimuli during learning. Nature. 2006;439:865–870. doi: 10.1038/nature04490. [DOI] [PMC free article] [PubMed] [Google Scholar]
- Paz R, Pelletier JG, Bauer EP, Paré D. Emotional enhancement of memory via amygdala-driven facilitation of rhinal interactions. Nat Neurosci. 2006;9:1321–1329. doi: 10.1038/nn1771. [DOI] [PubMed] [Google Scholar]
- Perkel DH, Gerstein GL, Moore GP. Neuronal spike trains and stochastic point processes. II. Simultaneous spike trains. Biophys J. 1967;7:419–440. doi: 10.1016/S0006-3495(67)86597-4. [DOI] [PMC free article] [PubMed] [Google Scholar]
- Phelps EA, LeDoux JE. Contributions of the amygdala to emotion processing: from animal models to human behavior. Neuron. 2005;48:175–187. doi: 10.1016/j.neuron.2005.09.025. [DOI] [PubMed] [Google Scholar]
- Pitkänen A, Amaral DG. Demonstration of projections from the lateral nucleus to the basal nucleus of the amygdala: a PHA-L study in the monkey. Exp Brain Res. 1991;83:465–470. doi: 10.1007/BF00229822. [DOI] [PubMed] [Google Scholar]
- Pitkänen A, Amaral DG. Organization of the intrinsic connections of the monkey amygdaloid complex: projections originating in the lateral nucleus. J Comp Neurol. 1998;398:431–458. doi: 10.1002/(sici)1096-9861(19980831)398:3<431::aid-cne9>3.0.co;2-0. [DOI] [PubMed] [Google Scholar]
- Quirk MC, Wilson MA. Interaction between spike waveform classification and temporal sequence detection. J Neurosci Methods. 1999;94:41–52. doi: 10.1016/s0165-0270(99)00124-7. [DOI] [PubMed] [Google Scholar]
- Rajkowski J, Kubiak P, Aston-Jones G. Locus coeruleus activity in monkey: phasic and tonic changes are associated with altered vigilance. Brain Res Bull. 1994;35:607–616. doi: 10.1016/0361-9230(94)90175-9. [DOI] [PubMed] [Google Scholar]
- Richardson RT, DeLong MR. Nucleus basalis of Meynert neuronal activity during a delayed response task in monkey. Brain Res. 1986;399:364–368. doi: 10.1016/0006-8993(86)91529-5. [DOI] [PubMed] [Google Scholar]
- Salzman CD, Fusi S. Emotion, cognition, and mental state representation in amygdala and prefrontal cortex. Annu Rev Neurosci. 2010;33:173–202. doi: 10.1146/annurev.neuro.051508.135256. [DOI] [PMC free article] [PubMed] [Google Scholar]
- Sanghera MK, Rolls ET, Roper-Hall A. Visual responses of neurons in the dorsolateral amygdala of the alert monkey. Exp Neurol. 1979;63:610–626. doi: 10.1016/0014-4886(79)90175-4. [DOI] [PubMed] [Google Scholar]
- Schoenbaum G, Chiba AA, Gallagher M. Orbitofrontal cortex and basolateral amygdala encode expected outcomes during learning. Nat Neurosci. 1998;1:155–159. doi: 10.1038/407. [DOI] [PubMed] [Google Scholar]
- Schoenbaum G, Chiba AA, Gallagher M. Changes in functional connectivity in orbitofrontal cortex and basolateral amygdala during learning and reversal training. J Neurosci. 2000;20:5179–5189. doi: 10.1523/JNEUROSCI.20-13-05179.2000. [DOI] [PMC free article] [PubMed] [Google Scholar]
- Schultz W. Predictive reward signal of dopamine neurons. J Neurophysiol. 1998;80:1–27. doi: 10.1152/jn.1998.80.1.1. [DOI] [PubMed] [Google Scholar]
- Shabel SJ, Janak PH. Substantial similarity in amygdala neuronal activity during conditioned appetitive and aversive emotional arousal. Proc Natl Acad Sci U S A. 2009;106:15031–15036. doi: 10.1073/pnas.0905580106. [DOI] [PMC free article] [PubMed] [Google Scholar]
- Stefanacci L, Amaral DG. Topographic organization of cortical inputs to the lateral nucleus of the macaque monkey amygdala: a retrograde tracing study. J Comp Neurol. 2000;421:52–79. doi: 10.1002/(sici)1096-9861(20000522)421:1<52::aid-cne4>3.0.co;2-o. [DOI] [PubMed] [Google Scholar]
- Stefanacci L, Amaral DG. Some observations on cortical inputs to the macaque monkey amygdala: an anterograde tracing study. J Comp Neurol. 2002;451:301–323. doi: 10.1002/cne.10339. [DOI] [PubMed] [Google Scholar]
- Storey JD. A direct approach to false discovery rates. J Roy Stat Soc B. 2002;64:479–498. [Google Scholar]
- Storey JD. The positive false discovery rate: a bayesian interpretation and the q-value. Ann Stat. 2003;31:2013–2035. [Google Scholar]
- Stratton P, Cheung A, Wiles J, Kiyatkin E, Sah P, Windels F. Action potential waveform variability limits multi-unit separation in freely behaving rats. PLoS One. 2012;7:e38482. doi: 10.1371/journal.pone.0038482. [DOI] [PMC free article] [PubMed] [Google Scholar]
- Sugase-Miyamoto Y, Richmond BJ. Neuronal signals in the monkey basolateral amygdala during reward schedules. J Neurosci. 2005;25:11071–11083. doi: 10.1523/JNEUROSCI.1796-05.2005. [DOI] [PMC free article] [PubMed] [Google Scholar]
- Sutton R, Barto A. Reinforcement learning. Cambridge, MA: MIT; 1998. [Google Scholar]
- Takeuchi D, Hirabayashi T, Tamura K, Miyashita Y. Reversal of interlaminar signal between sensory and memory processing in monkey temporal cortex. Science. 2011;331:1443–1447. doi: 10.1126/science.1199967. [DOI] [PubMed] [Google Scholar]
- Tye KM, Stuber GD, de Ridder B, Bonci A, Janak PH. Rapid strengthening of thalamo-amygdala synapses mediates cue-reward learning. Nature. 2008;453:1253–1257. doi: 10.1038/nature06963. [DOI] [PMC free article] [PubMed] [Google Scholar]
- Vaadia E, Haalman I, Abeles M, Bergman H, Prut Y, Slovin H, Aertsen A. Dynamics of neuronal interactions in monkey cortex in relation to behavioural events. Nature. 1995;373:515–518. doi: 10.1038/373515a0. [DOI] [PubMed] [Google Scholar]