

SUMMARY
A stimulus predicting reinforcement can trigger emotional responses, such as arousal, as well as cognitive ones, such as increasing attention towards that stimulus. Neuroscientists have long appreciated that the amygdala mediates spatially non-specific emotional responses, but it remains unclear whether the amygdala links motivational and spatial representations. To test whether amygdala neurons encode spatial and motivational information, we presented reward-predictive cues in different spatial configurations while assessing whether these cues influenced spatial attention. Cue configuration and predicted reward magnitude modulated amygdala neural activity in a coordinated fashion. Moreover, fluctuations in activity were correlated with trial-to-trial variability in spatial attention. Thus the amygdala integrates spatial and motivational information, which may influence the spatial allocation of cognitive resources. These results suggest that amygdala dysfunction may contribute to deficits in cognitive processes normally coordinated with emotional responses, such as directing attention towards the location of emotionally-relevant stimuli.
INTRODUCTION
Many aspects of emotional responses to stimuli are not spatially directed, such as freezing, autonomic reactivity, or even hormonal responses. However, stimuli that promote or threaten survival can also attract cognitive and behavioral resources, partly by prioritizing stimuli associated with highly positive or negative outcomes1. For example, humans find negative images faster than emotionally neutral images2, and more readily detect arousing words3. Attention can also spread to neutral stimuli nearby arousing ones4,5, and to locations directed by emotionally relevant cues such as gaze direction6 or learned associations with monetary outcomes7.
The neural mechanisms linking our emotional world to spatial cognition remain poorly understood. The amygdala is important for learning, updating and maintaining the value of sensory events and mediates many aspects of non-spatial emotional responses8. Prior work implicates the amygdala in encoding the motivational significance, or value, of stimuli9,10, but has not explored whether the amygdala is important for determining the spatial location of motivationally significant stimuli. Indeed, the amygdala is heavily interconnected with the orbitofrontal cortex (OFC), where neurons lack spatial selectivity11, suggesting that information processed at the level of the amygdala may be largely non-spatial. However, data from patients with isolated amygdala damage raises the possibility that this structure influences behavioral responses in a manner suggesting at least an indirect role in spatial processing8. For example, examinations of SM, a woman with bilateral amygdala lesions, show that she is impaired at recognizing fear from facial expressions due to a failure to look at the eyes12. Remarkably, this impairment disappears when she is instructed to fixate the eyes, suggesting that her impairment results from a failure to direct gaze and attention towards emotionally relevant parts of faces, a process that requires linking emotional recognition with spatial processing.
The amygdala could be involved in directing cognitive and behavioral resources towards stimuli in at least two ways. First, the amygdala may induce a vigilant or aroused state13, perhaps enhancing processing globally but leaving the representation of spatial information to other brain structures. Alternatively, the amygdala may register both the motivational significance and location of stimuli, allowing it to influence cognitive and behavioral functions in space. To distinguish between these possibilities, we trained monkeys to perform a task where we presented reward-predictive visual cues in different spatial configurations. We found that during task performance individual amygdala neurons encoded both the motivational significance of visual stimuli as well as their spatial configuration. Furthermore, neuronal activity was correlated with the trial-by-trial allocation of attention, suggesting that the representation of value and space in the amygdala could influence the direction of spatial attention towards motivationally relevant stimuli.
RESULTS
Stimulus-outcome associations guide spatial attention
To evaluate how the spatial configuration of reward-predictive visual cues influences the allocation of cognitive resources, we trained each of three monkeys to perform one of two tasks (Fig. 1a). The basic structure of both tasks was the same in that cues associated with different amounts of reward briefly appeared near spatial locations where monkeys subsequently performed a perceptual task. In both tasks, monkeys initiated trials by fixating a central point and then held fixation during the brief presentation of two visual cues (appearing in opposite hemifields) and a subsequent delay. The delay terminated at a random time when a target stimulus appeared near one of the two cue locations. The monkey then reported the location of the target (task A; monkeys O & L) or the orientation of the patch revealed to be the target (task B; monkey C).
Figure 1.
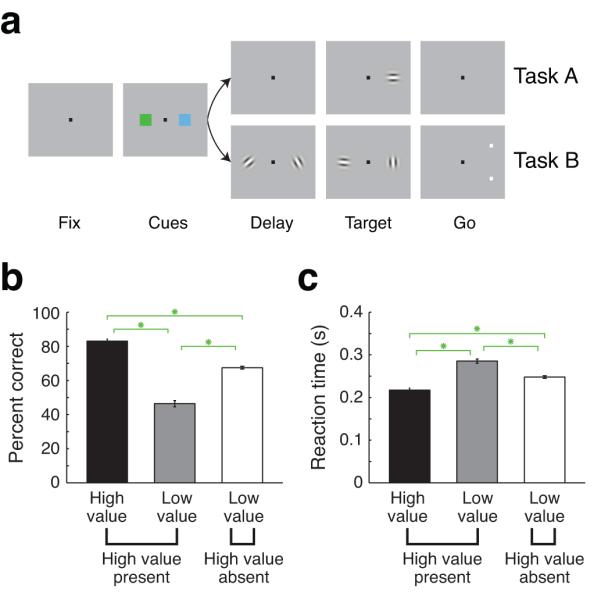
Motivational cues bias spatial attention. (a) Sequence of events in the two attention tasks. After monkeys achieved central fixation, two cues appeared at either side of the fixation point for 300 (task A) or 350 ms (task B). In task A (top), the cues were followed by a delay where no peripheral stimuli were present. The brief appearance of a near-threshold oriented patch (50 ms) at one of the two locations served as the target and the monkey correctly detected it by saccading to its location. In task B (bottom), two randomly oriented patches appeared on either side of the fixation point 250 ms after the cues were extinguished. At a random time, both patches changed orientation simultaneously (in independent directions). A pair of choice targets was subsequently presented at one location, indicating which oriented patch was the target, and the monkey judged whether the target at the indicated location was more vertical or horizontal. (b) Performance on high value present trials for targets appearing near the high value cue (black bar) and targets appearing near the low value cue (grey bar) and on high value absent trials (white bar). Performance was calculated as: 100 × [# of correct trials / # of trials where target appeared]. (c) Reaction times in the same format as (b). (b,c) Asterisks indicate significant differences between conditions (Paired Wilcoxon, P < 10−15) and error bars indicate the standard error across sessions (n = 126).
Each visual cue indicated how much liquid reward the monkey would receive for correct performance when the target appeared nearest the location of that cue; cues predicted either a high value or a low value outcome and were chosen from one of two cue sets in order to distinguish between effects related to the cue-outcome associations and those related to the physical characteristics of the cues. On each trial, we presented either two low value cues (high value absent) or one high value cue and one low value cue (high value present; spatial configuration randomized with equal probability). We used performance and reaction time to assay the effects of the cues on behavior14. Since the target location was chosen randomly on each trial, we tabulated performance and reaction time at each location to determine how monkeys used cue-outcome associations to allocate cognitive resources. When the target appeared near the high value cue on high value present trials, monkeys exhibited improved performance (Fig. 1b; 83% vs. 46%, Paired Wilcoxon, P < 10−15) and faster reaction times (Fig. 1c; 218 ms vs. 285 ms, Paired Wilcoxon, P < 10−15). On high value absent trials, performance improved and reaction times quickened relative to when the target appeared near the low value cue location on high value present trials (Fig. 1b,c; Paired Wilcoxon, P < 10−15). Attention was roughly split between the two locations on high value absent trials (69%/66% hit rate for targets ipsilateral/contralateral to the recording location). Behavioral effects were true in both tasks (Supplementary Fig. 1).
Amygdala neural activity reflects value & space
To determine if the amygdala represents spatial as well as motivational information, we recorded from 359 neurons in the amygdalae of three monkeys performing the two tasks (monkey O: 146, left amygdala; monkey L: 59, left amygdala; monkey C: 154, right amygdala; Fig. 2). Of these, 326 (91%) neurons were responsive during the task (see Methods), and we restricted all further analyses to this data set.
Figure 2.
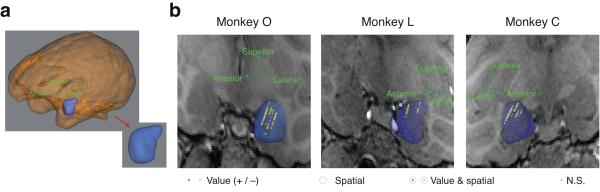
MRI reconstruction of recording locations. (a) 3D reconstruction of the whole brain and the amygdala for Monkey O. (b) 3D reconstructions of the amygdala recorded from in each monkey overlaid on a single coronal MRI slice from that monkey. Each coronal slice has been tilted to enable visualization of all electrode tracks. Arrows provide the orientation of the slice after tilting. Each data point represents the location of one neuron recorded during the task and the selectivity of that neuron (see legend; green, REW+ cell; yellow, REW− cell).
We found that amygdala neural responses frequently encoded information about the both the value and spatial configuration of the cues (Fig. 3a). The activity of each example neuron is significantly dependent on the location of the high value cue. Notably, the activity of these neurons is also modulated by the overall expected value of the cues. Consistent with prior studies9,10, some neurons responded most strongly on trials where no high value cues appeared (left example panels, “REW−“ neurons) and other neurons responded most strongly when a high value cue appeared (right example panels, “REW+” neurons).
Figure 3.

Amygdala neurons encode the value and spatial configuration of cues. (a) Peristimulus time histograms showing average firing rate plotted as a function of time relative to cue onset for four amygdala neurons (30 ms bins shifted by 2 ms; shading indicates standard error). Value selectivity indices and spatial selectivity indices (d’) were significantly (bootstrap, P < 0.05) less than zero (REW−; left) or greater than zero (REW+; right) for each example neuron. (b) Scatterplot of spatial selectivity vs. value selectivity indices for each individual neuron (n = 326). Value selectivity indices greater than zero indicate higher activity when a high value cue was present, and indices less than zero indicate higher activity when the high value cue was absent. Spatial selectivity indices greater than zero indicate higher activity when the high value cue was contralateral; values less than zero indicate higher activity when the high value cue was ipsilateral. Symbol style indicates the significance of selectivity for each neuron (see legend, same conventions as Fig. 2b); black line represents the weighted least squares regression fit (β = 0.53, P < 10−6). One neuron with a value selectivity index greater than 3.5 is excluded from this plot and from the plots in Figure 7A. Numbers indicate data points corresponding to the example neurons in (a).
The neurons depicted in Figure 3a are representative of the population we recorded in two ways (see also Supplementary Fig. 2). First, both expected reward and spatial configuration frequently had strong effects on neural responses. Second, there was a systematic relationship between value selectivity and spatial configuration selectivity. Neurons that signaled the presence of a high value cue with an increase (decrease) in firing also tended to fire more (less) when the high value cue was contralateral. We quantified these data by estimating selectivity indices (d’) for each neuron based on the firing rates 100 to 800 ms after cue onset. To calculate a spatial configuration selectivity index, we compared trials when the high value cue appeared contralaterally to when it appeared ipsilaterally. Surprisingly, 45% (148/326) of neurons were significantly modulated by spatial configuration (bootstrap, P < 0.05), of which 84 responded most and 64 responded least when the high value cue was contralateral.
To calculate a value selectivity index, we analyzed the same time window as for the spatial selectivity index but now compared trials in which a high value cue appeared to trials when a high value cue did not appear. We identified many neurons that significantly increased (REW+ neurons, n = 122) or decreased (REW− neurons, n = 71) activity when the overall value increased (bootstrap, P < 0.05).
If amygdala neurons indiscriminately combine spatial and value selectivity, these two measures would not be associated. This would be consistent with, for example, amygdala neurons combining value-related and space-related information in a random manner. Contrary to this hypothesis, we found a strong positive relationship between value and spatial selectivity indices (Fig. 3b; weighted least squares regression and bootstrap, β = 0.53, P < 10−6). This correlation was significant for the data from each task considered separately (P < 10−4; Supplementary Fig. 3). Thus, individual amygdala neurons selectively combined information about space and value to signal the location of reward-predictive stimuli with both negative and positive excursions in firing rate. REW+ neurons signal the presence of a more valuable cue in contralateral visual space with increases in firing rate, whereas REW− neurons do the same with decreases in firing rate.
Value information timing depends on spatial configuration
The combined representation of space and value in the amygdala indicates that individual neurons encode information about the location of a high value cue while also registering the value of both contralateral and ipsilateral stimuli. It is possible that the spatial configuration selectivity we observe could result from weaker visual inputs representing the ipsilateral visual field, which may also carry value information or interact with value information arriving to the amygdala from other brain areas. To gain insight into these possibilities, we examined the latency with which amygdala neurons encode value in each visual hemifield.
First, we characterized how the location of a highly valued cue affects the latency that neurons began to encode reward value. We determined when each neuron signaled the presence of a contralateral or ipsilateral high value cue by comparing trials in which no high value cue appeared to trials in which a high value cue appeared ipsilaterally or contralaterally. For example, inspecting Figure 3a reveals that neural responses to a high value cue diverges more quickly when it appears contralaterally (the cyan and black curves separate earlier than the magenta and black curves). We quantified these latencies for each neuron (see Methods) and found that the value latency for contralateral high value cues was shorter than that for ipsilateral high value cues for 97 (83%) of the 117 neurons for which we could estimate both latencies (Fig. 4a). The mean contralateral and ipsilateral value latencies were 177 and 240 ms, which differed significantly (Wilcoxon, P < 10−11); this effect did not differ between REW− and REW+ neurons (Wilcoxon, P = 0.73) and was present in both tasks (Supplementary Fig. 4a,b). Normalizing and averaging activity across all value-modulated neurons (n = 193; Fig. 4b) revealed that the population signaled the presence of a contralateral high value cue 44 ms earlier than an ipsilateral high value cue (119 ms compared to 163 ms; bootstrap, P = 0.001). Thus, while amygdala neural activity is modulated by the value of both contralateral and ipsilateral stimuli, this modulation starts at different times, suggesting the possibility of different neural sources for contralateral and ipsilateral value information.
Figure 4.

Latency of value discrimination by amygdala neurons depends upon cue spatial configuration. (a) Timecourse of signals discriminating the value of cues. Color indicates the degree of differential firing on high value contralateral versus high value absent trials (top, cyan) and on high value ipsilateral versus high value absent trials (bottom, magenta). For each neuron and within each comparison, firing rate differences within each condition were normalized by their maximum (unsigned) deviation from zero. Only cells with a measurable latency for each comparison were included; green circles indicate latency estimates (2 contralateral and 9 ipsilateral value latencies fall outside the plot). (b) Timing of value discrimination for the population of value selective neurons (n = 193). Average firing rate differences (shading indicates standard error) are plotted along with population value latencies for each comparison. For each neuron, we took the average of the two firing rate difference curves, found the signed peak deviation from zero (to enable averaging across REW− and REW+ neurons), and normalized the curve for each comparison by this value. This normalization maintains the difference in magnitude between the two comparisons.
If the value latency differences we observed could be explained by delays already present in the feed-forward inputs to the amygdala, we would expect a corresponding delay in the arrival of basic visual information from the ipsilateral visual field (Fig. 5a, same source). Alternatively, ipsilateral value information may be even more delayed than basic ipsilateral visual information, indicating that ipsilateral value information is not simply inherited from a delayed feed-forward signal (Fig. 5a, different sources). To address this possibility, we recorded the activity of amygdala neurons during a fixation task (Fig. 5b) where a single peripheral stimulus appeared either contralaterally or ipsilaterally (7° eccentricity). The fixation task allowed us to determine how visual onset latencies were influenced by spatial location, since a single stimulus, rather than two cues, appeared on every trial. Visual onset latencies for the population of visually-responsive neurons (n = 32/141, significant response modulation following presentation of contralateral and ipsilateral stimuli) did not differ significantly across spatial locations (Fig. 5c; bootstrap, P = 0.73), nor did they differ for those neurons with a measurable latency at both stimulus locations (n = 19, Paired Wilcoxon, P = 0.8). A direct comparison of individual value latency delays in the operant tasks (n = 117) with individual visual onset latency delays in the fixation task (n = 19) confirmed that the delay in value latencies was larger than that of visual onset latencies (Fig. 5d; Wilcoxon, P = 0.0008; this was true for both tasks, Supplementary Fig. 4c,d). For the 68 neurons recorded in both the fixation and one of the operant tasks (when visual onset latencies and value latencies could be computed for each neuron), the delay in value in ipsilateral value latencies was significantly longer than the delay in ipsilateral visual latencies (n = 11/68; μ = 63 ms, Paired Wilcoxon, P = 0.03). Despite the dissociation of latencies between the tasks, we did find that spatial location selectivity in the fixation task was a strong predictor of spatial configuration selectivity in the attention task (Supplementary Fig. 5). Thus, amygdala neurons integrated value information across the visual field, albeit more slowly than expected if this information was simply due to timing differences in feed-forward inputs.
Figure 5.

Latency of visual information is insensitive to spatial location. (a) Hypothetical latencies assuming that the delay in ipsilateral value information is already present in the feed-forward signal (delay derives from the same source) and that ipsilateral visual information and value information come from different sources (delay derives from different sources). Visual onset latencies and value latencies are plotted as a function of time relative to cue onset. (b) Fixation task. Monkeys were rewarded for maintaining fixation during the 350 ms cue presentation and for 1000 ms thereafter; the reward magnitude was not dependent on the stimulus location. (c) Population visual onset latencies in the fixation task for contralateral and ipsilateral stimuli. Firing rates were normalized in the same manner as in Figure 4B (shading indicates standard error). (d) Mean latencies for the set of cells where the contralateral and ipsilateral visual onset latencies (n = 19) and/or the contralateral and ipsilateral value latencies (n = 116) could be estimated. Latencies are plotted as in (a); horizontal bars indicate the standard error for the distribution of single cell latencies.
Task-related signals have distinct timecourses
If the conjoint spatial and value selectivity we observed is relevant for influencing behavior, it should be present not only during the presentation of the cues, but also when the monkey makes a discrimination, i.e. when the target appears. We examined this by determining how different signal properties evolved during a trial. For each neuron, we estimated the influence of the experimentally manipulated factors on neural firing rates using a multiple regression carried out in a sliding window relative to cue onset (Fig. 6a). In each window, we determined how three factors influenced neural activity: (1) the presence of a high value cue irrespective of space (spatially non-specific value), (2) the presence of a high value cue contralaterally (spatially specific value), and (3) the use of the different cue sets (stimulus identity).
Figure 6.
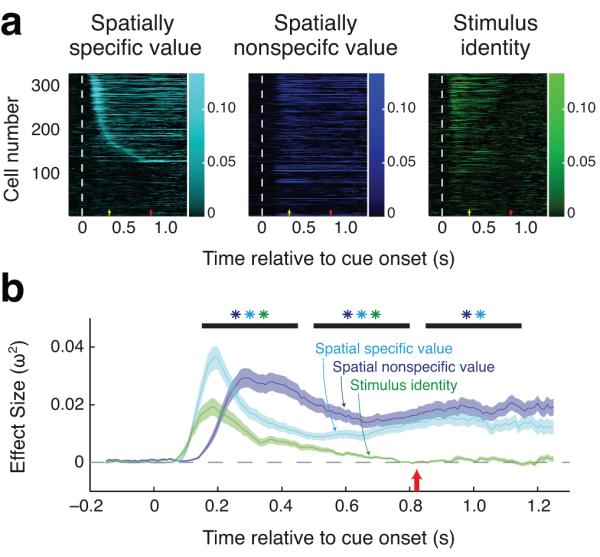
The encoding of space, value and stimulus identity by amygdala neurons evolves according to task demands. (a) Timecourse of amygdala signals representing spatially specific and non-specific value, as well as stimulus identity, for individual value-selective neurons (n = 193). Color indicates effect size for each factor (ω2 ) for individual neurons at times relative to cue onset (100 ms bins shifted by 10 ms). Neurons were sorted according to the onset of spatially-specific value coding, and this ordering was the same in all three plots. White dashed line indicates the time of cue onset; yellow and red arrows indicate the average time of cue offset and first target onset, respectively. (b) Timecourse of signals averaged over the population. Curves depict the mean and standard error (shaded region) of effect size (ω2 ) measures across the population. Black bars indicate the time bins used for statistical analysis, and asterisks indicate that the distribution of ω2 for that time bin was significantly greater than during the baseline period (P < 0.05). Red arrow indicates the average time of first target onset.
We focused our analysis on the time periods around cue presentation (cue period, 150–450 ms) and in the portions of the delay before (pre-target delay, 500–800 ms) and after (post-target delay, 850–1150 ms) the earliest possible time of target onset (Fig. 6b). For both the cue period and pre-target delay, there was a significant influence of all three factors on firing rates (compared to 300 ms prior to cue onset; bootstrap, P < 0.005). During the post-target delay, a different pattern emerged; while spatially specific and nonspecific value signals were maintained (P < 10−4), the encoding of stimulus identity disappeared (P = 0.17). This pattern was present in both tasks (Supplementary Fig. 6). This analysis reveals that both spatially specific and spatially non-specific value signals are sustained into the time period when the target could appear, and could influence how the monkey performs the visual tasks.
Activity correlates with fluctuations in spatial attention
Attention waxes and wanes from trial to trial throughout an experimental session and this presumably underlies some of the variability in behavioral measures such as performance and reaction time across trials15. If the combined representation of space and value in the amygdala influences the online guidance of spatial attention, trial-to-trial measures of amygdala activity and attentional allocation should co-vary. For example, consider a neuron that responds more when the high value cue is contralateral (REW+ neuron). Individual trials in which this neuron responds more than average should coincide with those trials in which the animal performs faster than average contralateral saccades (a classic measure of attention). This pattern of activity would result in a negative correlation between neural activity and reaction times to the contralateral field. Moreover, a positive correlation for ipsilateral saccades (increased activity coinciding with slower saccades away from the contralateral side) would support a role in spatial attention. By contrast, correlations that are the same sign (both negative) for ipsilateral and contralateral saccades would suggest a role in non-spatial attention like alerting or vigilance that could be modulated by changes in arousal level13,15.
We examined the trial-by-trial relationship between saccadic reaction times and amygdala activity around target onset (900 ms before to 100 ms after), focusing on contralateral and ipsilateral saccade data separately. To determine whether the magnitude of correlations depended on the value and/or spatial configuration of cues, we analyzed each trial type separately, yielding a total of 6 conditions (3 trial types × 2 saccade directions). Finally, just as the sign of value selectivity predicted that of spatial configuration selectivity, we expected it would also predict the sign of the correlations between firing rate and reaction time. Therefore, we used a linear regression to characterize the relationship between neurons’ value selectivity (d’) and their trial-by-trial relationship with reaction times (Fisher Z-transformed correlation coefficient). Consistent with spatial attention, but not alerting or vigilance, value selectivity had a negative relationship with contralateral correlation coefficients (bootstrap, P = 0.0078) and a positive relationship with ipsilateral correlation coefficients (P = 0.0048) when the high value cue had appeared contralaterally (Fig. 7a). These relationships were not significant when the high value cue was ipsilateral or absent, and the magnitude of the regression slopes on these trial types were significantly smaller than those observed on high value contralateral trials (ANCOVA, P < 0.005 for each saccade direction). The relationship between firing rate and reaction time was robust, and remained even after accounting for differences in recent reinforcement outcome history and satiation (Supplementary Fig. 7). In addition, the distance between eye position at the end of fixation and the target did not explain these results; this distance was not correlated with reaction times (P = 0.16), and distances between eye position at target onset and target location did not predict whether the monkey would perform the trial correctly (Wilcoxon, P = 0.23). We note that firing rates also predicted whether the monkey performed the trial correctly; however, differences in saccade behavior between hit and miss trials in the two tasks may have influenced these performance results (Supplementary Fig. 8).
Figure 7.

Trial-to-trial variations in firing rates are correlated with reaction time. (a) Relationship between value selectivity and correlations between firing rate and reaction time. Fisher Z-transformed correlation coefficients are plotted as a function of the value selectivity indices for each trial type and saccade direction. The size of the data points indicates the reliability (inverse standard error) of the correlation coefficient. Regression lines are plotted in instances where a significant relationship was observed (bootstrap, P < 0.05). (b) Histograms of correlation coefficients on high value contralateral trials for the 25% most value selective neurons (based on the magnitude of d’), split according to sign of selectivity (positive, n = 31: blue histograms; negative, n = 16: red histograms) and the direction of the saccade (contralateral: left, ipsilateral: right). Filled bars, individual neurons with correlation coefficients significantly different from 0 (P < 0.05); inset scatterplots, example cells with significant correlation coefficients (dotted arrow indicate their respective position in the histograms). The solid blue and red arrows indicate the mean of the distributions for positive value and negative value neurons, respectively, and asterisks denote that the mean correlation coefficients for these two groups were significantly different from each other (bootstrap, P < 0.05). (c) The difference in correlation coefficients (for contralateral saccades minus ipsilateral saccades) is plotted for cells grouped into quartiles according to the absolute value and sign of value selectivity indices. Vertical bars indicate the standard error. Blue and red filled circles indicate that the distribution was significantly different from zero while green stars indicate that the distributions were significantly different across groups (t-test, P < 0.05).
The significant relationship between value selectivity and correlation coefficients on high value contralateral trials suggests that neurons with stronger value selectivity may play a more important role in influencing attention. To examine this more closely, we split neurons into quartiles based on their value selectivity magnitude (absolute value of d’) and then partitioned each group according to the sign of value selectivity. Focusing on the 25% of cells with the strongest value selectivity, we found that correlation coefficients were significantly different between neurons with positive selectivity (d’ > 0) and neurons with negative selectivity (d’ < 0) for both directions of saccades (Fig. 7b; bootstrap, P < 0.005). Additionally, the distributions for ipsilateral and contralateral saccades were significantly different for positive value neurons (bootstrap, P = 0.001; μ(contra) = −0.04, μ(ipsi) = 0.16), as were the distributions for negative value neurons under the same comparison (P = 0.004; μ(contra) = 0.09, μ(ipsi) = −0.09). Thus the relationship between firing rate and reaction time differs depending upon the locus of spatial attention as measured by reaction time. This finding was present in both operant tasks considered separately (Supplementary Fig. 9). Overall, these results support the notion that amygdala firing is correlated with spatial attention and not arousal-related processes, since, unlike arousal effects, spatially specific effects predict differential relationships with reaction time depending upon saccade direction.
The relationship between trial-by-trial firing rate of amygdala neurons and saccadic reaction time was not present for neurons that did not have strong value selectivity, and it was not present unless a motivationally significant cue appeared in the contralateral field. To demonstrate this, we combined data across saccade directions, taking the difference in the Z-transformed correlation coefficients for each neuron (subtracting ipsilateral from contralateral), which, based on the previous analysis, was negative for neurons with strong positive selectivity and positive for neurons with strong negative selectivity. For high value contralateral trials, correlation coefficient differences were significantly different from zero (t-test, P < 0.05) only for neurons with the greatest value selectivity; the sign of this effect was opposite for the positive value and negative value groups (Fig. 7c). No significant effects were observed for any other groups of neurons on high value contralateral trials or for any group on either high value ipsilateral or absent trials. Notably, neurons with the highest value selectivity magnitude also tended to have the widest spike waveforms (Supplementary Fig. 10), suggesting that these neurons may be projection neurons that influence attentional processing; this effect was not different for neurons with positive and negative value selectivity, and the overall distributions of waveforms widths for these two populations did not differ (Wilcoxon, P = 0.66). Together these results suggest that the representation of space and value provided by the amygdala may play a role in spatial attention when highly valuable stimuli appear in the contralateral field and that this influence is mediated by the most value-selective amygdala neurons.
DISCUSSION
Motivationally salient stimuli trigger a range of cognitive and emotional responses. These include spatially non-specific processes like arousal or freezing induced by fear, as well as spatially specific responses like orienting attention. Traditionally, the amygdala has been understood as participating in spatially non-specific responses, but not spatially specific ones. Here we show that amygdala neurons encode information about both the spatial configuration of visual stimuli, as well as the rewards predicted by stimuli. Moreover, fluctuations in activity correlated with fluctuations of spatial attention on a trial-by-trial basis. These results suggest that the amygdala not only participates in spatially non-specific emotional responses, but it may also influence spatially specific cognitive processes, such as the allocation of enhanced cognitive resources to more valuable locations.
Amygdala neurons combine information about space and value such that activity changes to stimuli associated with increasing reward are associated with activity changes related to the spatial configuration of these stimuli. Previous studies showed that amygdala neural responses are sensitive to the reinforcement contingencies of CSs presented over the fovea, with some neurons responding more strongly when a CS predicts a reward as compared to an aversive stimulus, and other neurons having the opposite response profile (“positive” and “negative” value-coding neurons, respectively)9,10. In the present experiments, positive (REW+) amygdala neurons, which responded more strongly when a highly valuable cue appeared, also responded most when this cue appeared contralaterally. By contrast, negative (REW−) amygdala neurons responded less to the presence of a highly valuable cue and also responded most weakly when this cue appeared contralaterally. Thus, there is a systematic relationship between spatial and value selectivity in the amygdala. The data suggest that although stimuli presented ipsilaterally or contralaterally may both drive amygdala neural responses, neurons can exhibit either positive or negative excursions in activity to signal the presence of a valuable cue in the contralateral field.
The discovery of a representation of space and value in the amygdala immediately leads one to wonder about the degree of spatial selectivity encoded by amygdala neurons. In the current experiments, we tested for spatial selectivity at the level of the visual hemifield. We observed that the onset latency of value information was strongly dependent on the locations of outcome-predictive stimuli while visual response latencies were relatively insensitive to spatial location, suggesting that the spatial properties of amygdala neurons may have dynamic features that change depending upon task demands. Indeed, when monkeys directed attention, a signal representing space and value is sustained throughout a trial in the amygdala, long after the visual cues were extinguished. Although spatial selectivity at the level of the hemifield observed during the fixation task predicts spatial selectivity during the operant tasks, these observations indicate that it will be necessary to assess spatial properties in a variety of task contexts. The sheer number of trials required to map spatial properties in different tasks poses a significant experimental challenge for the future. Given the current data, the amygdala may at least be essential for quickly shifting attention to the left or right visual field based on the value of stimuli.
How is this representation of space & value unique?
The response properties we describe suggest a distinct and perhaps unique role for the amygdala compared to other brain areas that integrate information about space and value. Neurons encoding various aspects of rewarding and punishing outcomes have been discovered throughout the brain16, and have been studied extensively by presenting single visual cues associated with different outcomes. Although these studies have shown how outcome-sensitive neurons may be relevant for computing the value associated with specific objects or actions16, it is less clear how these neurons respond when there are multiple objects in the environment, particularly in situations where resources must often be divided and allocated.
Experiments using two or more simultaneously presented stimuli associated with different values suggest that some brain areas combine space and value information to encode “action values”17, the value associated with an available action. Two of the most studied brain structures in this regard are the lateral intraparietal area (LIP) and the dorsal striatum. During the performance of choice tasks both LIP and the dorsal striatum have been described as encoding the value of a choice in space17,18. Notably, neurons in these brain structures encode value differently than amygdala neurons. First, neither LIP nor dorsal striatum contain large populations of neurons with a sustained preference for opposite reinforcement valences (like REW+ and REW− neurons) that is systematically related to spatial selectivity preference. Second, unlike in the amygdala, neural responses in LIP are inhibited according to the value associated with competing actions for targets appearing in the opposite hemifield18,19. Third, dorsal striatal neurons most frequently encode the value of a single action20,21 or, similar to LIP, a quantity approximating the difference between the values of the two actions22.
The encoding of action value in LIP and the dorsal striatum often coincides with the locus of attention or preparation of an action whose endpoint is the locus of attention23, but some data indicates action value and attention can be dissociated (e.g.,24). In our experiments, amygdala neurons do not simply represent the monkeys’ locus of spatial attention. If they did, we would have observed intermediate neural responses for high value absent trials (where attention is split approximately equally between the two hemifields) relative to trials where the high value cue appeared contralaterally or ipsilaterally (where attention is heavily biased towards one hemifield or the other). Instead, valuable stimuli in either hemifield modulate activity in the same direction for individual amygdala neurons, indicating that these neurons integrate value information across the visual field in addition to encoding information about the locus of spatial attention.
Another structure commonly investigated in relation to value is the orbitofrontal cortex. The amygdala and OFC are anatomically interconnected, and the physiological properties of neurons in the two areas are similar along many dimensions9,10,25 (although, see26). However, when the OFC has been studied with tasks where monkeys select one of two choice targets associated with different rules or values, neurons represent aspects of value without providing spatial information before selection11. Spatial coding also appears to be lacking in the ventral ACC (vACC)27, a brain area likely to participate in a functional network with the amygdala and OFC given its strong anatomical connectivity to both28. Thus, neurons in the OFC and vACC appear to be involved in computing the value of objects irrespective of where spatial attention and subsequent action are directed, which may be important in weighing possible outcomes and guiding economic choices. By contrast, the emergence of spatial properties in the amygdala raises the possibility that its role is distinct from vACC and OFC in modulating spatial cognition.
How is this representation of space & value created?
In order to allocate cognitive resources to valuable stimuli, “where” and “what” information must converge with stimulus value information. The amygdala is a potential site for this convergence; it receives direct inputs from the ventral visual stream29 and single neurons in the amygdala encode stimulus value9,10. The source of spatial information in the amygdala is less clear. Direct projections to the amygdala from spatially selective areas such as the frontal eye fields or parietal cortex or the dorsal striatum are sparse or nonexistent in the primate29, suggesting that the dorsal visual pathway does not contribute directly to the spatial selectivity we observed. A superior colliculus to pulvinar pathway has been proposed as a source of direct subcortical input to the amygdala that would allow rapid processing of emotional information that bypasses slower cortical pathways30. However, we suspect that it does not play a special role in our experiments since the visual onset latencies (> 100 ms) we observed in the amygdala are consistent with visual information arriving through cortical pathways31.
Another possibility is that neurons in the inferotemporal cortex, although not encoding value information32,33, may provide enough spatial information for amygdala neurons to build the selectivity we observe34. However, the disassociation between the timing of visual information and value information in the amygdala suggests that these signals arise from different sources. Since the transfer of visual information between hemispheres is fast (~7–20 ms34,35), the relatively long delay (~50 ms) that we observed in ipsilateral value information suggests that it arises from a source other than feed-forward visual pathways. One possibility is that value information is established in the contralateral amygdala and then passed to the ipsilateral amygdala, which would be indirect since the amygdalae do not project to each other in primates36. Furthermore, a path through prefrontal cortices would likely be slow, since amygdala-prefrontal connections are exclusively ipsilateral37, adding at least one additional synapse between the amygdalae.
Finally, it is also possible that the amygdala inherits its representation of space and value from other brain structures like frontal cortical areas, many of which project to the amygdala with varying fiber density28,29,37. Unlike OFC and ventral ACC discussed above, neurons in the dorsolateral and ventrolateral prefrontal cortices encode spatial information that can be enhanced by reward38. The VLPFC is part of a network important for orienting attention towards behaviorally relevant objects39, and interactions with the amygdala may allow this network to orient attention based on emotional significance, although the DLPFC and VLPFC project weakly to the amygdala28. In contrast, the amygdala is more interconnected with the dorsal ACC, and it was recently shown that a small subset of neurons in dACC and adjoining area 32 conjointly encode spatial attention and reward value 40. Projections from these areas may carry space and value information to the amygdala although they also project relatively weakly to the amygdala28. However, these authors did not report that representations of space and value were combined systematically, and the response latencies they measured were generally slower than we observed in the amygdala, suggesting the possibility that the encoding of space and value in dACC may in fact depend on inputs from the amygdala, which sends a relatively stronger return projection to dACC28.
How might the amygdala influence spatial attention?
Our data demonstrate that amygdala neurons can encode relevant locations in space defined by arbitrary stimulus-outcome associations. This combined representation of space and value could influence a number of processes, including decision-making based on the location and value of choice options, as well as the allocation of cognitive resources, such as the enhancement of attention. The operant tasks we employed allowed us to evaluate how amygdala activity is related to the engagement of attention. We considered two possible effects that the amygdala may have on attention. First, the amygdala might have a direct influence on spatial attention. In the sensory domain, when multiple stimuli compete for limited processing resources, attention biases competition in favor of relevant stimuli41, allowing one to prioritize specific spatial locations in the visual environment. Stimulus relevance may be determined by a wide variety of factors. In the simplest case of orienting the sensory receptors towards some stimuli and away from others, attention can operate in an exogenous (stimulus-driven or bottom-up) or endogenous (goal-directed or top-down) manner39. The former refers to reflexive processes by which organisms direct their sensory receptors towards abrupt or intense stimuli that violate expectations, while the latter refers to a more typically voluntary orientation towards an object or a location in space based on expectancy about an environmental event. The association between rewarding outcomes and a cue indicating spatial location is one such expectation23. It is this type of association that we utilized to examine how cues bias spatial attention and how the amygdala’s processing of the cues is related to attention allocation.
A second means by which the amygdala might modulate attention could involve inducing a state of arousal that promotes vigilance13. Vigilance refers to the ability to sustain attention for prolonged periods of time that depends in part on an organism’s state of arousal. Arousal is thought to be a spatially non-specific way to allocate more processing resources, and scientists have typically thought of the amygdala as augmenting vigilance by modulating arousal42,43, or as augmenting a form of attention described as attention for learning which is also spatially non-specific44,45. These prior experiments did not test whether the amygdala also participates in spatial attention directed to the location of motivationally significant cues.
If the amygdala influences spatial attention, then the relationship between amygdala neural responses and quantitative measures of spatial attention would depend upon the spatial location of the attended stimuli. Using reaction time as a measure of spatial attention, we found that for REW+ neurons, higher activity during the delay period predicted shorter reaction times to targets in the contralateral visual field, and longer reaction times to targets in the ipsilateral field. REW− neurons’ neural activity made the opposite predictions with the same measures of spatial attention. If amygdala activity simply relates to spatially non-specific arousal, then higher activity should have had the same relationship with reaction time regardless of the saccade direction. Instead, our results suggest that the combined representation of space and value in the amygdala is related to the allocation of spatial attention, and the amygdala may therefore play a role in spatially-specific responses, as well as spatially non-specific responses, to motivational stimuli. Moreover, the fact that this correlation between neural activity and reaction time is present during the delay period, long after cues have disappeared from view, suggests that the amygdala represents cognitive information, and not merely perceptual information. This could be used for movement preparation, although amygdala neural responses related to saccadic execution have not been reported.
Of course, signals representing space and value from the amygdala may not actually influence spatial attention, as signals from other brain structures representing spatial attention could modulate the representation of space and value we describe in the amygdala. However, our suggestion that amygdala neural activity may itself influence the allocation of spatial attention may explain why electrical stimulation of the amygdala elicits orienting responses46 similar to those observed during attentive states and why amygdala lesions result in conditioned orienting deficits45. We suspect that in our tasks the amygdala is not directly producing movements per se because the monkeys were extensively trained to covertly attend while fixating. Instead, we believe that the amygdala could influence a number of brain systems involved with enhancing sensory processing. The amygdala could influence attention via direct projections to cortex, including lower level sensory areas29, as well as subcortical areas involved with attention, including the basal forebrain45. These connections could help explain the increased activation of visual cortex to stimuli associated with reward or punishment4,47, and the observation that amygdala damage reduces activation to fearful faces in a hemisphere-specific manner48. Without knowing the topography of the projections from the amygdala back to the sensory cortices, it remains unclear whether amygdala enhancement of cortical processing occurs at the hemifield level, constrained by the ipsilateral bias in projections to the visual cortices29, or in more spatially-specific manner.
Conclusion
We showed that the amygdala links stimulus-outcome associations with their spatial relevance. Our results suggest that the amygdala may influence how a subject attends to valuable stimuli, with the two amygdalae competing to influence spatial attention when location is relevant and working in concert to increase vigilance when location is irrelevant or uncertain. Our findings may provide insights into neuropsychiatric disorders such as autism and schizophrenia where amygdala dysfunction is believed to underlie deficits in orienting attention according to emotionally relevant stimuli49,50. Thus the amygdala, long recognized as a critical coordinator of emotion, may also play a key role in representing emotional information in space, allowing it to influence spatially-specific cognitive responses to the emotional world.
METHODS
Methods and any associated references are available in the online version of the paper.
ONLINE METHODS
General methods
Three rhesus monkeys (Macaca mulatta, 8–13 kg) were used in these experiments. All experimental procedures complied with the National Institutes of Health guidelines and were approved by the Institutional Animal Care and Use Committees at the New York State Psychiatric Institute and Columbia University. Prior to training, each animal was surgically implanted with a plastic headpost secured to the skull using ceramic bone screws. Surgery was conducted using aseptic techniques under isoflurane anesthesia, and analgesics and antibiotics were administered postsurgically. After behavioral training, we acquired T1-weighted MRIs with fiducial markers fixed to the headpost. In a second surgery, the MRI and fiducial markers were registered intra-surgically (Brainsight, Rogue Research, Quebec, Canada), allowing us to accurately implant a plastic recording chamber over the amygdala based on the MRI for each monkey. We recorded the final position of the recording chambers and used these coordinates to the guide electrode placement during experiments. We logged the inferior/superior, anterior/posterior, and medial/lateral position of each recorded neuron to generate a 3D reconstruction using Brainsight software (Fig. 2). Although precise localization of all neurons to particular nuclei is not possible, using the MRIs and atlases, we estimated that 297 neurons in our study were located in the basolateral complex, and 29 neurons were located in the central nucleus.
Behavioral task
Monkeys were seated and head-restrained in darkened sound-attenuating booths during experiments and were operantly conditioned using liquid rewards. The monkeys performed one of two tasks designed to assess how reward expectations influenced attention. In both tasks, trials began with the monkeys fixating a central spot; the fixation window had a radius of 1.88° ± 0.03° in task A and 1.35° ± 0.03° in task B. In task A (monkeys L & O), a Gabor patch (sinusoidal grating windowed by a Gaussian) served as the target and then appeared at one of the two locations between 400 and 4000 ms after cue offset (truncated exponential distribution) for 50 ms. The monkeys were required to saccade to the location of the target between 100–600 ms after its onset. Because the interval during which the target could appear was long and the reaction time window was relatively short, chance performance was about 23%. In task B (Monkey C), the orientation of two gabor patches changed at a random time 350 to 1350 ms after their appearance (chosen from an truncated exponential distribution). Following a target duration of 80–120 ms (adjusted online according to the monkey’s overall performance), the Gabor patches were then masked for 60 ms. Finally, two choice targets appeared around one of the two locations (4.2° away), indicating which Gabor patch was the target stimulus. The monkey was then required to saccade to one of the choice targets to indicate whether the target Gabor patch was more horizontal or more vertical (50% chance performance). The monkey had been trained that choosing the counterclockwise target indicates that the stimulus was more horizontal, and that choosing the clockwise target indicates that the stimulus was more vertical. In both tasks, trials were repeated when the monkeys made premature saccades. When the monkey failed to make a correct discrimination after the target appeared, the trial type was chosen at random on the next trial, just as we did when the monkey correctly performed the discrimination. Cues were colored rectangles (Task A, 2.25 deg.2 at 7° eccentricity) or circles (Task B, 0.5° diameter at ~3° eccentricity), and we randomly interleaved two distinct sets of cues associated with the same outcomes.
We also trained two of the three monkeys (monkey O and C) to perform a simple fixation task. After fixating a central point for 500 ms, a plaid grating (1.5° SD Gaussian window) appeared either to the left or right of the fixation point (7° eccentricity) for 350 ms. The monkeys were required to maintain fixation for an additional 1000 ms to complete the trial and obtain a reward (delivered after an additional 500 ms delay).
Eye position was monitored using an infrared camera and digitized at 1000 Hz (SR Research, Ontario, Canada). Reaction times were defined as the beginning of the saccade detected by using a velocity/acceleration-based algorithm. Visual stimuli were generated using EXPO (Center for Neural Science, New York University), and were displayed on a CRT monitor positioned 61 cm away from the monkey.
Electrophysiology
Recordings from single amygdala neurons were made through a surgically implanted plastic cylinder affixed to the skull. Three to eight electrodes were individually lowered into the left (monkeys O and L) or right (monkey C) amygdala using a multiple electrode microdrive (NaN Instruments, Nazareth, Israel). Extracellular activity was recorded using tungsten electrodes (2MΩ impedance at 1000 Hz; FHC Inc., Bowdoinham, ME). Analog signals were amplified, bandpass filtered (250–7500 Hz), and digitized (30000 Hz) for unit isolation (Blackrock Microsystems, Salt Lake City, Utah). Single-units were isolated offline using waveform principal components (Plexon Offline Sorter, Plexon, Dallas, TX).
Data analysis
We used two-tailed statistical tests in all instances. For all bootstrap analyses, we randomly re-sampled with replacement to obtain replications with the same size as the original data set; this was repeated at least 10000 times. Comparisons were significant if > 97.5% of the bootstrap distribution fell on the same side of the null hypothesis or if the test statistics in one condition were greater than those in the other in > 97.5% cases (both equivalent to a two-tailed test at α = 0.05). Non-parametric Wilcoxon tests were performed on unpaired data (rank-sum test) unless specified otherwise (sign-rank test). We used t-tests only on data that was verified to be normal (Lilliefors test at α = 0.05). Neurons were defined as task-responsive if firing rates around the onset of the fixation point (100–600 ms), the cue (100–800 ms), the target (100–300 ms), or the reward (0–400 ms) were differed significantly from baseline (1000 ms before fixation point onset; Paired Wilcoxon, P < 0.05). For selectivity indices, we computed d’ =(μ1 – μ2) / √((SS1 + SS2) / (df1 + df2)) where μX is the mean firing rates, SSX is the sum of squares, and dfX is the degrees of freedom (number of trials minus one) for each condition. Behavioral and neural data was similar across cue sets, so the data were combined except where noted.
Reaction time correlation analysis
We calculated correlation coefficients between amygdala activity around target onset (900 ms before to 100 ms after) and saccadic reaction times. Before calculating each correlation coefficient, we subtracted the mean firing rate and reaction time for each cue set individually to ensure that any neural and/or behavioral differences between each cue set did not produce any across-group correlations. After mean subtraction, we calculated the correlation coefficients and applied the Fisher Z-transformation. To assess the relationship between value selectivity (d’; same values as in Fig. 3b) and the correlation coefficients, we used a least squares regression weighted by the inverse standard errors of the Z- transformed correlation coefficients; significance was determined by a bootstrap analysis in which the set of cells for each resample was chosen randomly with replacement. Only correlation coefficients based on at least 15 trials were included for analysis; this resulted in a set of 274, 105, and 228 cells for contralateral saccades and 165, 215, and 208 cells for ipsilateral saccades (for high value cue contralateral, ipsilateral, and absent trials, respectively). We obtained similar results when we restricted the analysis of each trial type to the same set of cells (n = 83; those with 15 trials for each trial type and saccade direction).
Timecourse analyses
We sought to determine how three factors influenced neural activity as a function of time: (1) the inclusion of an high value cue irrespective of space (spatial non-specific value), (2) the inclusion of an high value cue contralaterally (spatially specific value), and (3) the use of the different cue sets (stimulus identity). For each factor, we computed the effect size, ω2 = (SSA – dfA × MSE) / (SS + MSE), where SSA is the across group sum of squares for factor A, dfA is the degrees of freedom for factor A (dfA = 1 for all factors in our model), SS is the total sum of squares, and MSE is the mean squared error of the model. The spatially non-specific value component of this multifactor analysis differs from the d’ value selectivity index: a neuron that responds only on high value contralateral trials would result in ω2 > 0 only for the spatial specific value signal but would have d’ > 0 for both spatial selectivity and value selectivity (with the spatial selectivity index roughly double in magnitude). The significance of values in each time bin was determined by comparing against those in the baseline interval (200 ms before cue onset; bootstrap). In comparison to the effect size measure η2 (proportion of total variance explained), ω2 tends towards zero when the explanatory power of the factor is weak and does not exhibit a positive bias for increasingly small sample sizes51. This was essential for analyzing cue-triggered responses because individual trials were truncated at the time of target onset, which occurred at a random time and resulted in progressively fewer trials available for analysis at increasingly later time times in the trial. Replotting Figure 6 using the η2 measure yields a similar result except the values are biased upwards at later time points.
Latency analyses
For all instances where we computed value or visual onset latencies, we defined the latency as the first of 25 (population latencies) or 15 (individual neurons latencies) consecutive bins (30 ms bins slid by 2 ms) for which the comparison of interest was significant (P < 0.05). We used a bootstrap analysis to test for differences in population latencies.
For population value latencies, we first computed the difference in firing rates between high value contralateral trials OR high value cue ipsilateral trials with firing rates on high value absent trials for each value-selective neuron (n = 186). Firing rate differences across were combined across REW− and REW+ by (1) subtracting any baseline firing rate differences (500 ms before cue onset) and (2) dividing by the signed peak deviation from zero during the signal period. The peak deviation from zero was based on the average of the two difference curves in order to illustrate the difference in their magnitude; the same results were obtained when the difference curves were normalized to reach the same asymptotic value. Neural discrimination in each post-cue time bin was tested against zero (Wilcoxon).
We used an analogous analysis to determine visual onset latencies in the fixation task for the population of stimulus-responsive neurons (compare firing rates 100–300 ms after stimulus onset versus 500 ms before stimulus onset; Paired Wilcoxon, P < 0.05 for both locations). This included 32 neurons of which 19 had excitatory responses, 11 had inhibitory responses, and 2 had responses of opposite sign for the two cue locations. Again, we baseline subtracted, peak normalized, and sign-corrected the raw firing rates in order to average over neurons with excitatory and inhibitory responses; here, the peak response was based on the average of the responses to contralateral and ipsilateral stimuli. Visual onset latencies for contralateral and ipsilateral stimuli were estimated in the same way as for value latencies.
For individual visual onset latencies, we compared firing rate distributions at each time bin (50–500 ms after cue onset) against the distribution of all baseline time bins (500 ms before cue onset, Wilcoxon). For individual value latencies, we compared firing rate distribution on trials where the high value cue was contralateral or trials where the high value cue was ipsilateral with trials when the high value cue was absent. The analyses of visual onset latencies and value latencies were limited to set of stimulus-responsive and value-selective neurons, respectively, as in the population analyses. We used a fairly stringent criterion to ensure that the measured latencies were accurate; as a result, value latencies and visual onset latencies could only be computed for a subset of value-selective (n = 116/186) and stimulus-responsive (n = 19/32) neurons, respectively.
Supplementary Material
ACKNOWLEDGEMENTS
This research was supported by grants from the NIMH and NIDA to C.D.S., as well as by a core grant from NEI; C.J.P. received support from NIMH and NEI; B.L. received support from NIMH and the Helen Hay Whitney Foundation. We thank E. Kandel and K. Louie for discussions and comments on the manuscript; S. Dashnaw for MRI support, G. Asfaw for veterinary support and K. Marmon for technical support.
Footnotes
Note: Supplementary Information is available in the online version of the paper.
AUTHOR CONTRIBUTIONS B.L. initiated the project; C.J.P. and B.L. designed the experiments, collected the data and wrote the manuscript; C.J.P. performed the data analysis with assistance from B.L.; C.D.S. supervised and provided input about all aspects of the project and edited the manuscript.
COMPETING FINANCIAL INTERESTS The authors declare no competing financial interests.
REFERENCES
- 1.Lang PJ, Davis M. Emotion, motivation, and the brain: reflex foundations in animal and human research. Prog Brain Res. 2006;156:3–29. doi: 10.1016/S0079-6123(06)56001-7. [DOI] [PubMed] [Google Scholar]
- 2.Ohman A, Wiens S. Ch. 13. In: Davidson Richard J., Sherer Klaus R., Goldsmith H. Hill., editors. Handbook of Affective Sciences. Oxford University Press; 2003. [Google Scholar]
- 3.Anderson AK. Affective influences on the attentional dynamics supporting awareness. J Exp Psychol Gen. 2005;134:258–281. doi: 10.1037/0096-3445.134.2.258. [DOI] [PubMed] [Google Scholar]
- 4.Armony JL, Dolan RJ. Modulation of spatial attention by fear-conditioned stimuli: an event-related fMRI study. Neuropsychologia. 2002;40:817–826. doi: 10.1016/s0028-3932(01)00178-6. [DOI] [PubMed] [Google Scholar]
- 5.Phelps EA, Ling S, Carrasco M. Emotion facilitates perception and potentiates the perceptual benefits of attention. Psychol Sci. 2006;17:292–299. doi: 10.1111/j.1467-9280.2006.01701.x. [DOI] [PMC free article] [PubMed] [Google Scholar]
- 6.Klein JT, Shepherd SV, Platt ML. Social attention and the brain. Curr Biol. 2009;19:R958–962. doi: 10.1016/j.cub.2009.08.010. [DOI] [PMC free article] [PubMed] [Google Scholar]
- 7.Anderson BA, Laurent PA, Yantis S. Value-driven attentional capture. Proc Nat Acad Sci. 2011;108:10367–10371. doi: 10.1073/pnas.1104047108. [DOI] [PMC free article] [PubMed] [Google Scholar]
- 8.Phelps EA, LeDoux JE. Contributions of the amygdala to emotion processing: from animal models to human behavior. Neuron. 2005;48:175–187. doi: 10.1016/j.neuron.2005.09.025. [DOI] [PubMed] [Google Scholar]
- 9.Paton JJ, Belova MA, Morrison SE, Salzman CD. The primate amygdala represents the positive and negative value of visual stimuli during learning. Nature. 2006;439:865–870. doi: 10.1038/nature04490. [DOI] [PMC free article] [PubMed] [Google Scholar]
- 10.Belova MA, Paton JJ, Salzman CD. Moment-to-moment tracking of state value in the amygdala. The Journal of neuroscience : the official journal of the Society for Neuroscience. 2008;28:10023–10030. doi: 10.1523/JNEUROSCI.1400-08.2008. [DOI] [PMC free article] [PubMed] [Google Scholar]
- 11.Padoa-Schioppa C, Assad JA. Neurons in the orbitofrontal cortex encode economic value. Nature. 2006;441:223–226. doi: 10.1038/nature04676. [DOI] [PMC free article] [PubMed] [Google Scholar]
- 12.Adolphs R, et al. A mechanism for impaired fear recognition after amygdala damage. Nature. 2005;433:68–72. doi: 10.1038/nature03086. [DOI] [PubMed] [Google Scholar]
- 13.Davis M, Whalen PJ. The amygdala: vigilance and emotion. Mol Psychiatry. 2001;6:13–34. doi: 10.1038/sj.mp.4000812. [DOI] [PubMed] [Google Scholar]
- 14.Posner MI, Snyder CR, Davidson BJ. Attention and the detection of signals. Journal of experimental psychology. 1980;109:160–174. [PubMed] [Google Scholar]
- 15.Parasuraman R, Davies DR. Varieties of attention. Academic Press; 1984. [Google Scholar]
- 16.Schultz W. Behavioral theories and the neurophysiology of reward. Annu Rev Psych. 2006;57:87–115. doi: 10.1146/annurev.psych.56.091103.070229. [DOI] [PubMed] [Google Scholar]
- 17.Kable JW, Glimcher PW. The neurobiology of decision: consensus and controversy. Neuron. 2009;63:733–745. doi: 10.1016/j.neuron.2009.09.003. [DOI] [PMC free article] [PubMed] [Google Scholar]
- 18.Sugrue LP, Corrado GS, Newsome WT. Choosing the greater of two goods: neural currencies for valuation and decision making. Nature reviews. Neuroscience. 2005;6:363–375. doi: 10.1038/nrn1666. [DOI] [PubMed] [Google Scholar]
- 19.Louie K, Grattan LE, Glimcher PW. Reward value-based gain control: divisive normalization in parietal cortex. The Journal of neuroscience : the official journal of the Society for Neuroscience. 2011;31:10627–10639. doi: 10.1523/JNEUROSCI.1237-11.2011. [DOI] [PMC free article] [PubMed] [Google Scholar]
- 20.Lau B, Glimcher PW. Value representations in the primate striatum during matching behavior. Neuron. 2008;58:451–463. doi: 10.1016/j.neuron.2008.02.021. [DOI] [PMC free article] [PubMed] [Google Scholar]
- 21.Samejima K, Ueda Y, Doya K, Kimura M. Representation of action-specific reward values in the striatum. Science. 2005;310:1337–1340. doi: 10.1126/science.1115270. [DOI] [PubMed] [Google Scholar]
- 22.Cai X, Kim S, Lee D. Heterogeneous coding of temporally discounted values in the dorsal and ventral striatum during intertemporal choice. Neuron. 2011;69:170–182. doi: 10.1016/j.neuron.2010.11.041. [DOI] [PMC free article] [PubMed] [Google Scholar]
- 23.Maunsell JH. Neuronal representations of cognitive state: reward or attention? Trends in cognitive sciences. 2004;8:261–265. doi: 10.1016/j.tics.2004.04.003. [DOI] [PubMed] [Google Scholar]
- 24.Peck CJ, Jangraw DC, Suzuki M, Efem R, Gottlieb J. Reward modulates attention independently of action value in posterior parietal cortex. The Journal of neuroscience : the official journal of the Society for Neuroscience. 2009;29:11182–11191. doi: 10.1523/JNEUROSCI.1929-09.2009. [DOI] [PMC free article] [PubMed] [Google Scholar]
- 25.Morrison SE, Salzman CD. The convergence of information about rewarding and aversive stimuli in single neurons. The Journal of neuroscience : the official journal of the Society for Neuroscience. 2009;29:11471–11483. doi: 10.1523/JNEUROSCI.1815-09.2009. [DOI] [PMC free article] [PubMed] [Google Scholar]
- 26.Morrison SE, Saez A, Lau B, Salzman CD. Different time courses for learning-related changes in amygdala and orbitofrontal cortex. Neuron. 2011;71:1127–1140. doi: 10.1016/j.neuron.2011.07.016. [DOI] [PMC free article] [PubMed] [Google Scholar]
- 27.Cai X, Padoa-Schioppa C. Neuronal encoding of subjective value in dorsal and ventral anterior cingulate cortex. J Neurosci. 2012;32:3791–3808. doi: 10.1523/JNEUROSCI.3864-11.2012. [DOI] [PMC free article] [PubMed] [Google Scholar]
- 28.Ghashghaei HT, Hilgetag CC, Barbas H. Sequence of information processing for emotions based on the anatomic dialogue between prefrontal cortex and amygdala. NeuroImage. 2007;34:905–923. doi: 10.1016/j.neuroimage.2006.09.046. [DOI] [PMC free article] [PubMed] [Google Scholar]
- 29.Freese JL, Amaral DG. Ch. 1. In: Whalen Paul J., Phelps Elizabeth A., editors. The human amygdala. Guilford Press; 2009. pp. 3–42. [Google Scholar]
- 30.Tamietto M, de Gelder B. Neural bases of the non-conscious perception of emotional signals. Nature reviews. Neuroscience. 2010;11:697–709. doi: 10.1038/nrn2889. [DOI] [PubMed] [Google Scholar]
- 31.Pessoa L, Adolphs R. Emotion processing and the amygdala: from a ’low road’ to ’many roads’ of evaluating biological significance. Nature reviews. Neuroscience. 2010;11:773–783. doi: 10.1038/nrn2920. [DOI] [PMC free article] [PubMed] [Google Scholar]
- 32.Rolls ET, Judge SJ, Sanghera MK. Activity of neurones in the inferotemporal cortex of the alert monkey. Brain Res. 1977;130:229–238. doi: 10.1016/0006-8993(77)90272-4. [DOI] [PubMed] [Google Scholar]
- 33.Liu Z, Richmond BJ. Response differences in monkey TE and perirhinal cortex: stimulus association related to reward schedules. Journal of neurophysiology. 2000;83:1677–1692. doi: 10.1152/jn.2000.83.3.1677. [DOI] [PubMed] [Google Scholar]
- 34.DiCarlo JJ, Maunsell JH. Anterior inferotemporal neurons of monkeys engaged in object recognition can be highly sensitive to object retinal position. Journal of neurophysiology. 2003;89:3264–3278. doi: 10.1152/jn.00358.2002. [DOI] [PubMed] [Google Scholar]
- 35.Swadlow HA, Rosene DL, Waxman SG. Characteristics of interhemispheric impulse conduction between prelunate gyri of the rhesus monkey. Exp Brain Res. 1978;33:455–467. doi: 10.1007/BF00235567. [DOI] [PubMed] [Google Scholar]
- 36.Demeter S, Rosene DL, Van Hoesen GW. Fields of origin and pathways of the interhemispheric commissures in the temporal lobe of macaques. J Comp Neurol. 1990;302:29–53. doi: 10.1002/cne.903020104. [DOI] [PubMed] [Google Scholar]
- 37.Ghashghaei HT, Barbas H. Pathways for emotion: interactions of prefrontal and anterior temporal pathways in the amygdala of the rhesus monkey. Neuroscience. 2002;115:1261–1279. doi: 10.1016/s0306-4522(02)00446-3. [DOI] [PubMed] [Google Scholar]
- 38.Kennerley SW, Wallis JD. Reward-dependent modulation of working memory in lateral prefrontal cortex. The Journal of neuroscience : the official journal of the Society for Neuroscience. 2009;29:3259–3270. doi: 10.1523/JNEUROSCI.5353-08.2009. [DOI] [PMC free article] [PubMed] [Google Scholar]
- 39.Corbetta M, Patel G, Shulman GL. The reorienting system of the human brain: from environment to theory of mind. Neuron. 2008;58:306–324. doi: 10.1016/j.neuron.2008.04.017. [DOI] [PMC free article] [PubMed] [Google Scholar]
- 40.Kaping D, Vinck M, Hutchison RM, Everling S, Womelsdorf T. Specific contributions of ventromedial, anterior cingulate, and lateral prefrontal cortex for attentional selection and stimulus valuation. PLoS Biol. 2011;9:e1001224. doi: 10.1371/journal.pbio.1001224. [DOI] [PMC free article] [PubMed] [Google Scholar]
- 41.Desimone R, Duncan J. Neural mechanisms of selective visual attention. Annual review of neuroscience. 1995;18:193–222. doi: 10.1146/annurev.ne.18.030195.001205. [DOI] [PubMed] [Google Scholar]
- 42.Belova MA, Paton JJ, Morrison SE, Salzman CD. Expectation modulates neural responses to pleasant and aversive stimuli in primate amygdala. Neuron. 2007;55:970–984. doi: 10.1016/j.neuron.2007.08.004. [DOI] [PMC free article] [PubMed] [Google Scholar]
- 43.Kapp BS, Supple WF, Jr., Whalen PJ. Effects of electrical stimulation of the amygdaloid central nucleus on neocortical arousal in the rabbit. Behavioral neuroscience. 1994;108:81–93. doi: 10.1037//0735-7044.108.1.81. [DOI] [PubMed] [Google Scholar]
- 44.Roesch MR, Calu DJ, Esber GR, Schoenbaum G. All that glitters ... dissociating attention and outcome expectancy from prediction errors signals. Journal of neurophysiology. 2010;104:587–595. doi: 10.1152/jn.00173.2010. [DOI] [PMC free article] [PubMed] [Google Scholar]
- 45.Holland PC, Gallagher M. Amygdala circuitry in attentional and representational processes. Trends in cognitive sciences. 1999;3:65–73. doi: 10.1016/s1364-6613(98)01271-6. [DOI] [PubMed] [Google Scholar]
- 46.Ursin H, Kaada BR. Functional localization within the amygdaloid complex in the cat. Electroencephalogr Clin Neurophysiol. 1960;12:1–20. doi: 10.1016/0013-4694(60)90058-4. [DOI] [PubMed] [Google Scholar]
- 47.Padmala S, Pessoa L. Affective learning enhances visual detection and responses in primary visual cortex. The Journal of neuroscience : the official journal of the Society for Neuroscience. 2008;28:6202–6210. doi: 10.1523/JNEUROSCI.1233-08.2008. [DOI] [PMC free article] [PubMed] [Google Scholar]
- 48.Vuilleumier P, Richardson MP, Armony JL, Driver J, Dolan RJ. Distant influences of amygdala lesion on visual cortical activation during emotional face processing. Nature neuroscience. 2004;7:1271–1278. doi: 10.1038/nn1341. [DOI] [PubMed] [Google Scholar]
- 49.Baron-Cohen S, et al. The amygdala theory of autism. Neurosci Biobehav Rev. 2000;24:355–364. doi: 10.1016/s0149-7634(00)00011-7. [DOI] [PubMed] [Google Scholar]
- 50.Pinkham AE, Hopfinger JB, Pelphrey KA, Piven J, Penn DL. Neural bases for impaired social cognition in schizophrenia and autism spectrum disorders. Schizophr Res. 2008;99:164–175. doi: 10.1016/j.schres.2007.10.024. [DOI] [PMC free article] [PubMed] [Google Scholar]
- 51.Olejnik S, Algina J. Generalized eta and omega squared statistics: measures of effect size for some common research designs. Psychological methods. 2003;8:434–447. doi: 10.1037/1082-989X.8.4.434. [DOI] [PubMed] [Google Scholar]
Associated Data
This section collects any data citations, data availability statements, or supplementary materials included in this article.