

Abstract
Nerve growth factor (NGF) induces collateral branching along sensory axons by promoting the formation of axonal filopodia dependent on the actin-nucleating Arp2/3 complex. This study shows that chicken embryonic sensory axons contain mRNAs for the actin-nucleating Arp2/3 complex activator WAVE1 and the complex stabilizer cortactin. NGF increases the axonal levels of WAVE1 and cortactin through localized protein synthesis even in axons isolated from the cell body. Inhibition of protein synthesis in severed axons impairs NGF-induced branching, the formation of axonal filopodia, and the initiation of Arp2/3-dependent axonal actin patches, which serve as precursors to the emergence of filopodia. Overexpression of WAVE1 or cortactin in axons not treated with NGF increased the rate of actin patch formation and the frequency of the emergence of filopodia from actin patches, respectively. Antisense inhibition of cortactin mRNA translation in isolated axons blocked NGF-induced filopodia. NGF also activated the Rac1 GTPase, which drives WAVE1 activity, in a protein synthesis-independent manner. Similarly, inhibition of protein synthesis did not impair the effects of NGF on the axonal microtubule cytoskeleton during branching. The effects of NGF on Rac1 activity and increases in axonal levels of WAVE1 and cortactin were both dependent on phosphoinositide 3-kinase (PI3K) signaling. Collectively, the data indicate that NGF promotes sensory axon branching through regulation of the actin cytoskeleton using both canonical signaling mechanisms and intra-axonal protein synthesis downstream of PI3K signaling. Finally, we present experimental evidence of axonal mRNA translation in sensory axons in the living embryonic spinal cord.
Introduction
The establishment of synaptic contacts between individual neurons and multiple target cells is a fundamental aspect of the development of complex neuronal circuitry (Teeter and Stevens, 2011). Since each neuron generates one axon, connectivity with multiple synaptic partners is made possible by the formation of axon collateral branches. The mechanisms of branch formation, and the regulation by extracellular signals, are only partially understood (Gallo, 2011). Collateral branches emerge de novo from the axon shaft and their initiation is regulated by extracellular signals released by target tissues (Gibson and Ma, 2011; Li et al., 2011). Centrally and peripherally projecting cutaneous dorsal root ganglion (DRG) sensory axons form branches in the spinal cord and in the skin. Nerve growth factor (NGF) mediates the branching of sensory axons in the skin during development and in the adult (Petruska and Mendell, 2004), but the underlying mechanisms remain unclear.
Axon collateral branches are initiated as axonal filopodia. In vivo and in vitro, axonal filopodia emerge from precursors consisting of actin filament-based cytoskeletal structures termed axonal actin patches (Andersen et al., 2011; Spillane et al., 2011). NGF increases the number of axonal filopodia by increasing the rate of formation of axonal actin patches (Ketschek and Gallo, 2010). The formation of actin patches is driven by phosphoinositide-3-kinase (PI3K) activity and patch formation requires the actin-nucleating Arp2/3 complex (Spillane et al., 2011). The maturation of a filopodium into a branch requires the entry and stabilization of microtubules (Gallo, 2011). Since the invasion of filopodia by microtubules has a low frequency of occurrence, only a few filopodia have the potential to mature into branches before being retracted into the axon. The mechanisms used by branch-inducing signals to coordinate the regulation of the axonal actin and microtubule cytoskeleton remain unclear.
Axons synthesize proteins in response to extracellular signals and contain a variety of mRNAs coding for cytoskeletal proteins with roles in the formation of axon branches (e.g., cortactin and Arp2) (Willis et al., 2007; Zivraj et al., 2010; Gumy et al., 2011). While axonal protein synthesis contributes to growth cone guidance and extension (Jung and Holt, 2011), it is not known whether axonal protein synthesis contributes to the formation of axon branches. We report that the axonal synthesis of regulators of the actin-nucleating Arp2/3 complex is involved in NGF-induced axon branching. This study also reveals that NGF activates a microtubule-based mechanism that contributes to the formation of axon branches in a protein synthesis-independent manner. Thus, the induction of sensory axon filopodia and branches by NGF requires both axonal protein synthesis-dependent and -independent mechanisms. Furthermore, we present experimental evidence that sensory axons translate axonally targeted mRNAs in the living spinal cord at a developmental stage coinciding with the early phase of branching in vivo.
Materials and Methods
Cell culture and transfection.
Fertilized chicken eggs containing embryos of either sex were obtained from Charles River. At embryonic day 7 (E7), embryos were removed from the eggs and the DRG dissected out. Whole explants were cultured, or the cells were dissociated using previously described protocols (Lelkes et al., 2006). In all cases, the culturing substrata were coated with 25 μg/ml laminin (Invitrogen) in PBS overnight. Explants and cells were cultured in defined F12H medium without NGF as previously described (Ketschek and Gallo, 2010). Explants and dissociated cell cultures were used for experiments between 20 and 30 h after plating. For live imaging experiments, explants or dissociated cells were plated in glass-bottom dishes as described by Ketschek and Gallo (2010). For experiments in which the cultures were fixed, cells or explants were cultured on glass coverslips. Dissociated DRG cells were transfected using an Amaxa Nucleoporator (program G-13, 10 μg of plasmid) and chicken transfection reagents, as previously described by Ketschek and Gallo (2010). eYFP-β-actin, mCherry-β-actin and GFP-EB3 plasmids were used as previously described (Jones et al., 2006; Ketschek and Gallo, 2010; Spillane et al., 2011). RFP-cortactin and GFP-WAVE1 were kind gifts from Dr. T. O' Connor (University of British Columbia, Canada) (Mingorance-Le Meur and O'Connor, 2009) and Dr. L. Lanier (University of Minnesota), respectively. Myristoylated, green fluorescent protein (myrGFP)-β-actin 3′UTR was previously described by Willis et al. (2007).
Reagents.
The PI3Kpep peptide and the inactive control peptide PI3KpepAla were obtained and used as previously described (50 μg/ml, 1 h treatment; Ketschek and Gallo, 2010; Spillane et al., 2011). LY294002 and rapamycin were obtained from EMD Biosciences and dissolved in dimethylsulfoxide (DMSO), and used at 10 μm (30 min treatment) and 25 nm (1 h pretreatment), respectively. NGF was purchased from R&D Systems and used to treat cultures at 40 ng/ml for 30 min, or varying amounts of time (see Fig. 1).Laminin was obtained from Invitrogen. Glass substrata were coated overnight with 25 μg/ml laminin. Cycloheximide (CHX) was purchased from Sigma and dissolved in DMSO, and used at 35 and 350 μm for in vitro and ex vivo experiments, respectively (pretreatment times are detailed in individual experiments).
Figure 1.
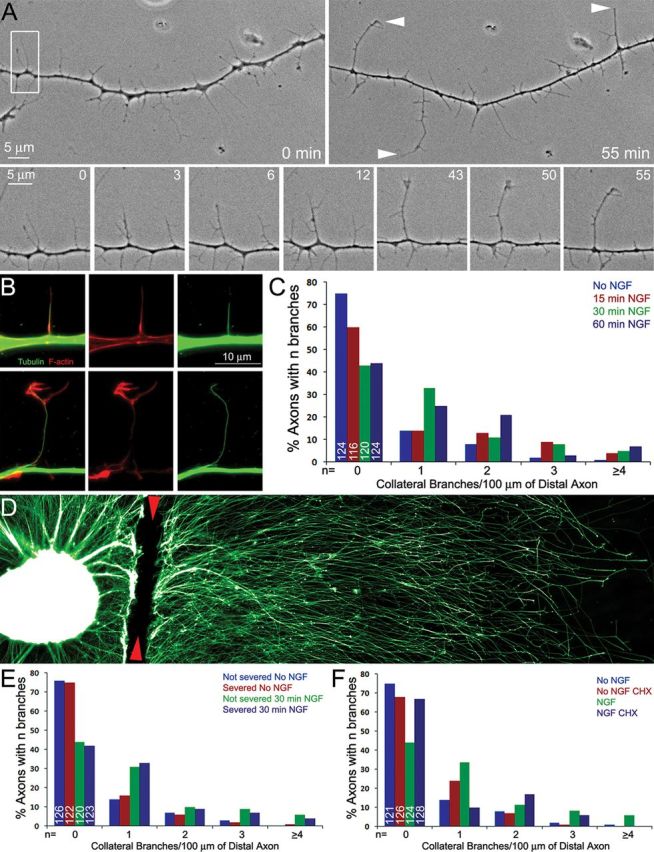
NGF induces axons branching dependent on axonal protein synthesis. A, Phase contrast time-lapse sequence of collateral formation. Top, The morphology of the axon before branch formation (0 min) and 55 min later. The arrowheads at 55 min denote structures interpreted to be collateral branches based on length and morphological criteria. Bottom, The maturation of a filopodium into a branch tipped by a dynamic small growth cone-like structure. The bottom represents the area in the white box in the top left. By 12 min the filopodium has darkened and developed an additional filopodia near its tip and other filopodia along its shaft. By 43 min the branch has extended further and developed a small growth cone. B, Examples of axons simultaneously fixed and extracted to reveal the polymeric cytoskeleton. Top, Shows an axonal filopodia invaded by a microtubule. Although a microtubule is present, the filopodium has a relatively uniform F-actin distribution and no distal accumulation of F-actin. In contrast, a mature branch contains a microtubule and a distal accumulation of F-actin (bottom). C, Distribution of the number of mature branches (0 to ≥4) along the distal 100 μm axons as a function of time after treatment with NGF. The number of axons scored per group from six separate cultures is denoted by the numbers in the 0 branches categories. In this and all subsequent experiments in this figure, the distribution of axon branches was not normal as determined by the Kolmogorov–Smirnov test. The data are thus presented as distributions and analyzed using the χ2 tests for trend as described (see Materials and Methods). D, Example of an explant cultured in NGF and fixed immediately following severing of the axons at the base of the explant. The site of severing is denoted by the red arrowheads. The sample is stained with anti-α-tubulin. E, F, Show graphs of the number of mature branches along the distal 100 μm axons (as in C). E, Severing of the axons did not affect the ability of axons to generate mature collateral branches in response to NGF. Severed axons and non-severed axons from the same cultures were scored providing a within-sample comparison. F, Pretreatment of severed axons with CHX before axon severing impairs the ability of severed axons to generate mature collateral branches in response to NGF. CHX treatment had similar effects on non-severed axons (data not shown).
In vitro imaging of transfected neurons.
Transfected neurons were imaged using a Zeiss 200 m microscope equipped with an Orca-ER camera (Hamamatsu) in series with a PC workstation running Axiovision software for image acquisition and analysis. Cultures were placed on a heated microscope stage (Zeiss temperable insert P with objective heater) for 15 min before imaging. Imaging was performed using a Zeiss Pan-Neofluar 100× objective (1.3 NA), 2 × 2 camera binning, minimal light exposure. Acquisition parameters were set to prevent saturation of the signal in axons. For imaging of eYFP/mCherry-β-actin and GFP-WAVE1, we used 6 s interframe acquisition rates. For imaging GFP-EB3 we used 3 s interframe acquisition rates.
Axon severing.
To determine axon branch distributions, cultures were simultaneously fixed and extracted and stained with anti-α-tubulin and phalloidin to reveal microtubules and actin filaments (F-actin), respectively (Gallo and Letourneau, 1999; Jones et al., 2006). Six to eight cultures, each containing 2 DRG explants, were used per group and axons were severed on one side of the explants before treatment with NGF. The unsevered axons in the same cultures served as internal controls. A minimum of 20 axons (distal 100 μm) was scored per culture in the peripheral halo of axons. Severing was performed manually at the base of explants with a number 11 scalpel (Feather Safety Razor Company) (Fig. 1D). Only distal axons that were not contacting other axons along the distal 100 μm were scored. The number of axonal filopodia and filopodia containing microtubules was similarly determined. For severing experiments, explants were cultured in video dishes that provide a fixed substratum during severing, unlike coverslips placed in dishes. Definitions of axon branches and filopodia are provided (see Results).
Immunocytochemistry and quantification of fluorescence intensities.
Cultures were fixed using one of four protocols (P1–4; all 15 min): P1, 8% paraformaldehyde (PFA) containing 5% sucrose; P2, 0.25% glutaraldehyde or P3, simultaneously fixed and extracted using 0.4% glutaraldehyde and 0.1% Triton X-100 in PHEM buffer (as described by Gallo and Letourneau, 1999); and P4, 8% PFA in PHEM buffer containing 5% sucrose, 5 μm jasplakinolide (Calbiochem), 10 μm taxol (Sigma), and 0.2% NP-40. For protocols P2 and P3 glutaraldehyde fluorescence was subsequently quenched with 2 mg/ml sodium borohydride in calcium magnesium-free PBS for 15 min. Samples were then blocked using 10% goat serum in PBS with 0.1% Triton X-100 (GST) and stained with primary antibodies for 45 min, washed in GST, incubated with secondary antibodies for 45 min (all secondary antibodies were from Jackson ImmunoResearch), washed in GST and stained with phalloidin for an additional 30 min (phalloidin was used following the manufacturer's directions and dissolved in PBS), washed in deionized water, and mounted in no-fade mounting medium (as described by Gallo and Letourneau, 1999). The following primary antibodies were used in conjunctions with the described fixation protocols (P1–3 above) and at the described dilutions: Arp2 (P4; 1:100; ECM Biosciences), WAVE1 (P2; 1:50; ECM Biosciences), cortactin (P1; 1:250; Abcam, ab11065), DM1A-FITC (P2,3; 1:100; fluorescein-conjugated anti-α-tubulin; Sigma), Rac1 (P2; 1:100; NewEast Biosciences), and GTP-loaded Rac1 (P2; 1:100; NewEast Biosciences).
For quantification of the levels of immunolabeled axonal proteins, samples were visualized using a Zeiss 200 m microscope equipped as described above. For each axon, two channel images were acquired, representing actin filaments and the protein of interest, respectively. Camera binning of 2 × 2 was used and the acquisition parameters were set so that the entire dataset was within the dynamic range of measurement. The distal 40 μm of axon shaft was defined as a region of interest using the Zeiss Axiovision software interactive measurement module, and the area of the region of interest was multiplied by the background subtracted mean intensity of the stain to obtain the total integrated staining intensity within the region of interest. For ratiometric quantification of WAVE1 and cortactin levels in individual actin patches, the region of interest was defined as the outline of the actin patch based on the phalloidin staining pattern. The ratio was then derived using the background subtracted integrated intensities of the antibody stain to the phalloidin for each patch.
Axonal mRNA detection.
The method for generating axonal populations isolated from their cell bodies for analysis of mRNA content has been previously described (Zheng et al., 2001; Willis et al., 2005; Donnelly et al., 2011). Briefly, E6 DRG explants were cultured on 8 μm diameter porous polyethylene terephthalate membranes (BD Falcon) resting on 6-well plates. Axons penetrate the membranes by extending through the pores, while cell bodies remain on the surface. The use of explants, which contain the cell bodies of neurons and non-neuronal cells that only minimally migrate from the explants, facilitated preparation of axonal isolates. After 48–72 h, the two sides of the membranes were individually scraped to obtain samples reflective of axons and cell bodies/explants + axons. RNA was isolated using the RNAqueous Micro kit (Ambion), treated with DNase, and quantified using RiboGreen reagent (Invitrogen). Reverse transcription (RT) was performed with iScript (Bio-Rad) using 100 ng of RNA as template. The RNA template sample run through RT in the absence of reverse transcriptase serves as the negative control, whereas the sample extracted from the cell body/explant compartment serves as the positive control. Total RT reactions were diluted twofold for standard PCR. Cortactin, WAVE1, Arp2, β-actin, and GAP-43 were run for 32 cycles, all others for 30 cycles. For visualization of the axonal transcripts, the samples were run in 1% agarose gel and stained by ethidium bromide. The purity of axonal preparation was tested by RT for β-actin, γ-actin, activating transcription factor 2 (ATF2), and microtubule-associated protein 2 (MAP2) mRNAs.
The primers used were selected from Gallus gallus species: forward β-actin (TGCGCATAAAACAAGACGAG), reverse β-actin (GACTGCTGCTGACACCTTCA), forward γ-actin (GAGGTGTTGCAGGCTTGTC), reverse γ-actin (GCCAACAGGCTGCTATTTCT), forward ATF2 (TCGGTTGCATCCTTCTTAGG), reverse ATF2 (TCTCACCTTCACCTGCCAAT), forward MAP2 (GATGCAGAAATTGGCCTGAT), reverse MAP2 (ATGCAAGACAGAGCAGAGCA), forward GAP43 (CCCCCTATCCTCTATCCTTCC), reverse GAP43 (TGACTGGGATTTTTCCTGCT), forward cortactin (TTGCGCTTCTGTCAGCATAC), reverse cortactin (AGCGCTGCTCTTTCTCACTC), forward WAVE1 (GTGTGCTGCTGGAAGCAATA), reverse WAVE1 (AACAAGCACCACAATGGACA), forward Arp2 (TGCTTTCAACCATTCTGCTG), reverse Arp2 (CGTTCTCCACCGACTTTGAT).
Chariot-based transfection of gripNAs and GTPases.
Chariot and gripNAs were custom synthesized and purchased from ActiveMotif. The chicken cortactin gripNA antisense sequence used was as described by Cheng et al. (2000); GCAGCACCGTCATGCTCC. The control sequence was CCTCGTACTGCCACGACG. Chariot II-based transfection was performed as suggested by the manufacturer but 18 nm Chariot II was used to complex to 300 pm gripNA as this improved internalization based on the fluorescence of the fluorescein tag in the axons. Rac1 and Cdc42 proteins (Cytoskeleton) were internalized using previously described Chariot-based protocols for the delivery of proteins (Gallo, 2003).
Generation of myrGFP constructs using the cortactin and Arp2 3′UTRs.
The constructs were based on N-terminal myrGFP plasmid originally provided by Erin Schuman (Aakalu et al., 2001). 3′UTRs of G. gallus Arp2 and cortactin mRNAs (GenBank ID: NM 205224.1 and NM 205468.1, respectively) were generated by RT-PCR and cloned into myrGFP plasmid. RNA (200 ng) isolated from embryonic chicken brain tissue was reverse transcribed using iScript cDNA synthesis kit (Bio-Rad). The cDNA was then amplified using Pfu DNA polymerase (Stratagene). The PCR conditions were as follows: 95°C for 1 min, 56°C for 1 min, and 72°C for 1 min for 35 cycles with a final 72°C extension for 10 min. The primers were engineered to include 5′ Not1 and 3′ Xho1 restriction sites in the cDNA products. The following primer sequences were used for amplifying G. gallus Arp2 mRNA 3′UTR segment: nucleotides 1296–1560, sense-GCGGCCGCATCCCAAAGCTTGTTCCCATCACG and antisense-CTCGAGACCCAATTGCCTACTGGGAAGG; for amplifying G. gallus cortactin mRNA 3′UTR segment: nucleotides 2075–2460, sense GCGGCCGCAGACTGTTGTCTGCTGGTTATGCC and antisense-CTCGAGACCGCAAGCATGATTTCTGAGCTG. In each case where PCR products were used for vector production, inserts were fully verified by sequencing.
In ovo electroporation and ex vivo imaging.
In ovo electroporation and ex vivo imaging were performed as described by Spillane et al. (2011). Lumbosacral chicken embryo DRG were electroporated in ovo at E3 using a CUY-21SC electroporator (Nepa Gene) equipped with 3 mm L-shaped gold tip electrodes (Harvard Apparatus). Five 50 ms 50 V pulses were applied at a rate of 1 pulse per second. Expression vectors were injected (0.1–0.15 μg/μl PBS with 0.01% fast green) into the lumen of the neural tube and electrodes placed at the level of the lumbosacral enlargement. In each embryo, 3–5 DRG were transfected unilaterally. At E7, embryos were removed from the eggs and the entire spinal cord caudal to the first thoracic segment was dissected out. The cord was then divided into two halves by cutting the roof and floor plates and immediately placed in the well of a video-imaging dish containing 20 μl of culturing medium. The well of the video dish was then enclosed by placing a glass coverslip on top of the well in the dish and sealed to the dish by a ring of medium between the glass and dish surface (see Fig. 8D). The assembled video dish containing the spinal cord was immediately used for imaging. Imaging was performed as for the in vitro experiments using a Zeiss 200 m inverted microscope equipped with an Orca-ER CCD camera (Hamamatsu). For imaging we used a Zeiss Pan-Neofluar 100× objective with 1.3 NA. Additional details can be found in Spillane et al. (2011).
Figure 8.

Overexpression of WAVE1 and cortactin promote actin patch initiation and the emergence of filopodia from patches, respectively, in the absence of NGF. A, Quantification of the rate of actin patch formation in GFP-WAVE1 + mCherry-actin and GFP + mCherry-actin-expressing axons pre-post NGF treatment (paired t test for within pre-post comparisons, Welch's t test for cross-group comparison). B, Quantification of the rate of actin patch formation in RFP-cortactin + eYFP-actin and RFP + eYFP-actin-expressing axons pre-post NGF treatment (paired t tests). C, Quantification of the duration of actin patch duration (seconds) from the same axons as in C. Welch's t test used for cross-group comparisons. D, In ovo electroporation and acute ex vivo spinal cord imaging as previously described by Spillane et al. (2011). The spinal cord is dissected from electroporated embryos, transferred to an imaging dish, and imaged on an inverted microscope. An example of DRG axons extending in the dorsal funiculi imaged at 20× is shown. E, Examples of axons transfected in ovo with RFP or RFP-cortactin. For morphometric analysis imaging was performed at 100×. F, Morphometrics of the protrusions along RFP or RFP-cortactin-expressing axons in the ex vivo spinal cord. Individual protrusions are shown ranked by ascending length for each group (n = 54 and 46 axons for RFP-cortactin and RFP; median lengths of protrusions is shown in parentheses next to the color-coded labels). The shaded areas denote the portion of the population of protrusions in each group above the threshold length (gray line) set as the criterion for classification as a branch. G, Schematic of the gripNA treatment paradigm. Fluorescein-labeled gripNAs complexed to Chariot cell-permeable peptide were added to explant cultures for 90 min, to allow internalization. Bottom images show the presence of fluorescein-labeled gripNA in axons. Axons were then severed from the explants and treated with NGF for 30 min as in previous experiments. H, GripNA antisense blockade of the axonal translation of cortactin impaired the NGF-induced increase in the number of axonal filopodia. Kruskal–Wallis ANOVA with Dunn's post hoc tests. I, GripNA antisense impaired the NGF-induced increase in axonal cortactin levels. Kruskal–Wallis ANOVA with Dunn's post hoc tests.
Fluorescence recovery after photobleach (fluorescence recovery after photobleaching) of axons in vitro and the ex vivo spinal cord.
For in vitro fluorescence recovery after photobleaching (FRAP), experimental cultures were pretreated with 35 μm CHX or an equal amount of DMSO vehicle for 30 min before photobleaching. Ex vivo spinal cords were prepared as described above and either treated with DMSO or 350 μm CHX for 20 min before imaging. The higher dose of CHX used in this experiments, relative to in vitro, was chosen to allow tissue penetration of the drug during the pretreatment period. One video sequence was obtained from each spinal cord for a total postdissection survival time of ∼1 h. Frames were acquired just before and immediately after bleaching and at 5 and 10 min intervals thereafter for in vitro and ex vivo experiments, respectively. In vitro and ex vivo, photobleaching of myrGFP was performed using a 30–45 s exposure of the distal 60–80 μm axons in the imaging field to light from a 100 W source. This procedure resulted in photobleaching of the axon of interest and other axons above and below the selected axon within the tissue in ex vivo experiments (data not shown). In the ex vivo spinal cord, the RFP channel was used to determine the morphology of the axon and select the region of interest for measurements of recovery from fluorescence in the GFP channel. Similarly, in vitro phase contrast images of the axons acquired at the same times as the GFP channel were used to determine the location of the axon at early time points in the FRAP when the GFP signal is otherwise too low to detect the axon. Only axons that were photobleached by >90% of their initial value were used in the analysis. To track recovery, the mean background subtracted intensity of myrGFP was measured in a fixed length of the axon at multiple time points.
Statistical analysis.
Analysis was performed using Graphpad Instat software. The software automatically checks datasets for deviation from a normal distribution (Kolmogorov–Smirnov test). If a non-normal distribution was detected in any of the datasets with a comparison group then nonparametric statistics were used. The distributions of axon branches did not exhibit normal distributions. Therefore, the levels of branching were analyzed across groups using χ2 tests for trend on the raw binned categorical data (i.e., bin = number of axons with n branches). The data are presented in the figures as a percentage of axons per bin to provide a direct normalized visual comparison across groups. For bins in which the number of observations was below the number required by the test, the bin was merged with the next lower bin to obtain sufficient observations. As an example, if the bin for ≥4 branches did not have sufficient observations, then it was merged with the bin for three branches in all comparison groups, which would then represent ≥3 branches, and merging was performed until a sufficient number of observations per bin was obtained. This never resulted in less than the 0, 1, and 2 branches per axon bins being used in the analysis.
Results
Protein synthesis contributes to NGF-induced collateral branching
Treatment of embryonic sensory neurons with NGF promotes elaboration of growth cone morphology and induces axon collateral branching. Roche et al. (2009) have shown that treatment of chicken embryonic sensory neurons with NGF drives axonal protein synthesis. However, inhibition of protein synthesis did not impair the effects of NGF on growth cone morphology, but partially inhibited guidance to NGF gradients. The results of Roche et al. (2009) stand in contrast to previous demonstrations of axonal protein synthesis having a role in the regulation of growth cone motility (Zhang et al., 2001; Verma et al., 2005; Yao et al., 2006; Lin and Holt, 2007). Thus, although Roche et al. (2009) demonstrated that NGF induces axonal protein synthesis, their study failed to find evidence for the ensuing protein synthesis in the regulation of growth cone dynamics. To further understand the role of NGF-induced protein synthesis in chicken embryonic sensory axons, in this study we investigated the role of protein synthesis in NGF-induced axon branching, an aspect of axonal biology not previously considered.
The emergence of axonal filopodia is the first step in the formation of collateral branches. However, only a small fraction of axonal filopodia mature into branches. The formation of new lamellae or filopodia from the tip of an axonal filopodium is a key event in the maturation of the filopodium into a branch (Fig. 1A,B) (Gallo, 2011). Therefore, to count mature collateral branches along the axon shaft, we defined a mature branch as an axonal protrusion >10 μm in length that contained one or more microtubules and exhibited filopodia or lamellipodia enriched in F-actin at its tip. Thus, a branch was defined as an axonal protrusion containing microtubules and distally accumulated F-actin. In contrast, axonal filopodia were defined as F-actin-based protrusions that did not exhibit additional protrusive structures at their tip, or evidence of a distal accumulation of F-actin, regardless of whether they contained microtubules (Fig. 1B). All immunocytochemical analyses were performed on cultures simultaneously fixed and extracted to remove soluble tubulin and actin while preserving microtubules and F-actin (Gallo and Letourneau, 1999).
We counted the number of collateral branches/100 μm of the distal axon at different times following treatment with 40 ng/ml NGF, which was the concentration used throughout this study. NGF induced a statistically significant but slight increase in the number of branches at 15 min following treatment (p < 0.02; Fig. 1C). However, by 30 min NGF had a pronounced effect on the number of collateral branches, which did not increase further by 60 min following treatment (p < 0.001 at both time points; Fig. 1C). Fifty-seven and 56% of axons exhibited one or more branches at 30 and 60 min post-NGF treatment, respectively, compared with 25% in control axons. Thus, within a 1 h time window, NGF-induced branching occurs maximally by 30 min post-treatment.
A 30 min treatment with NGF-induced axon branching along axons severed from the cell body to the same extent as not-severed axons (Fig. 1D,E). Since axons were severed from the cell bodies before the addition of NGF, the formation of branches in response to NGF is independent of continuity with the cell body. To test whether the formation of axon collateral branches is dependent on protein synthesis, cultures were pretreated with CHX (35 μm, 30 min pretreatment used throughout for in vitro studies) followed by severing of the axons and a 30 min treatment with NGF. This CHX treatment protocol is used throughout. CHX treatment did not affect baseline numbers of axon collateral branches (p = 0.16, No NGF vs No NGF+CHX; Fig. 1F), but impaired the formation of collateral branches in response to NGF (p < 0.0001, NGF vs CHX+NGF; Fig. 1F). NGF treatment increased the percentage of axons exhibiting one or more branches from 25 to 57% (Fig. 1F). In contrast, in the presence of CHX the percentage of axons with one or more branches was 32 and 33%, with and without NGF treatment, respectively. Collectively these data indicate that protein synthesis, independent of the cell body, contributes to the induction of collateral branches by NGF.
NGF-PI3K signaling induces axonal protein synthesis-dependent axonal filopodia and protein synthesis-independent growth cone filopodia
The initiation of axonal filopodia is the first step in the establishment of branches. Axonal filopodia emerge from transient precursor cytoskeletal structures termed axonal actin patches, reflective of the localized accumulation of actin filaments (Fig. 2A; for review, see Gallo, 2011). In contrast, only a few filopodia formed at the growth cone are preceded by detectable actin accumulations (Loudon et al., 2006). The initiation and development of actin patches was tracked in living axons through transfection with eYFP-β-actin. As previously described, actin patches formed along the axon's shaft, increased in size to a maximum size and intensity, and subsequently dissipated until the eYFP- β-actin signal was no longer elevated relative to background axonal levels (Fig. 2A). We have previously reported that a 30 min treatment with NGF increases the rate of actin patch formation, without affecting the duration of patches or the probability that a patch will give rise to a filopodium (Ketschek and Gallo, 2010). To gain insights into the time course of NGF-induced regulation of actin patch dynamics, we investigated the effects of NGF at 5, 15, and 30 min post-treatment. A 5 min treatment with NGF did not have any effect on the rate of formation of axonal actin patches (Fig. 2B) or the number of filopodia formed (data not shown). A 15 min treatment induced a statistically significant 37% increase in the rate of actin patch formation. Consistent with previous work, a 30 min treatment with NGF resulted in an ∼98% increase in the rate of actin patch and filopodia formation (Fig. 2B). The probability of emergence of a filopodium from a patch and the duration of patches were not affected at any time point (data not shown), consistent with a previous analysis of the effects of NGF at 30 min post-treatment (Ketschek and Gallo, 2010). In contrast, a 5 min treatment with NGF rapidly increased the number of filopodia at growth cones, and a 5 min treatment was as effective as a 30 min treatment (Fig. 2C). Thus, NGF induces a rapid (<5 min) increase in the number of filopodia at growth cones, but the increase in the formation of axonal actin patches and axonal filopodia is delayed.
Figure 2.

Axonal protein synthesis is required for NGF-induced formation of axonal actin patches and filopodia, but not NGF-induced increases in the number of growth cone filopodia. A, Time-lapse sequence showing an example of filopodial emergence from an axonal actin patch in the axon of an eYFP-β-actin-expressing neuron. At 0 s, the future site of formation of the actin patch contains a filopodium (f), which is soon retracted into the axon. An established actin patch, with a filopodium extending from it, is also denoted by a blue arrow. By 12 s, a new actin patch has formed along the axon (white arrowhead), and eventually gives rise to a filopodium (24 s, yellow arrowhead). In contrast, the patch present at 0 s (blue arrowhead) has dissipated by 30 s. We note that in many cases filopodia persist longer than the patches they arise from, as was likely the case for the filopodium labeled f at 0 s. B, Time course of NGF-induced increases in the rate of actin patch formation. For each time point, a within-axon pre-post NGF treatment paradigm was used. To monitor actin dynamics in axons neurons were transfected with eYFP-β-actin. A 5 min treatment with NGF did not increase the rate of actin patch formation, while a 15 and 30 min treatment increased the rate by ∼40% and 100%, respectively. Six minute videos were obtained, the post-NGF imaging periods were thus reflective of 5–11, 15—21, and 30–36 min post-NGF. n = number of axons monitored is denoted in the Pre-NGF bar of each set. Paired t test performed at each time point comparing pretreatment and post-treatment. C, NGF rapidly (5 min treatment) and persistently (30 min treatment) increased the number of growth cone filopodia. An example of a growth cone treated with NGF for 30 min, relative to an untreated control, is shown in the inset. Pretreatment with CHX did not impair the NGF-induced increase in the number of growth cone filopodia at either 5 or 30 min post-NGF treatment. Kruskal–Wallis ANOVA followed by Dunn's post hoc tests were used to compare 5 and 30 min treatments to the baseline control values. Statistical p values are shown above the bars. The 5 and 30 min NGF treatment groups were not significantly different from one another. Mann–Whitney tests we used to compare the CHX treatments to time matched NGF-treatment groups and the p values are shown above the NGF-treatment bars. Kruskal–Wallis ANOVA did not report differences between the baseline group and either of the CHX groups. n = number of growth cones analyzed per group is denoted in each bar. D, CHX and rapamycin (Rapa) block NGF and PI3Kpep-induced increases in the number of axonal filopodia (30 min treatment). Neither CHX nor Rapa affected the baseline number of filopodia. DMSO was the control group for NGF treatments and PI3KpepAla + DMSO was the control group for PI3Kpep treatment (+DMSO). Data were analyzed within NGF and PI3Kpep treatment groups using Kruskal–Wallis ANOVA and Dunn's post hoc tests. Inset shows examples of growth cone and distal axon morphologies as revealed by staining with phalloidin. n = number of axons analyzed is denoted in each bar. E, CHX and Rapa block the NGF-induced increase in the rate of formation of axonal actin patches. eYFP-β-actin-expressing axons were imaged at equivalent time points following treatment with CHX or Rapa and NGF. NGF increased the rate of actin patch formation in DMSO-treated controls, but did not increase the rate with CHX or Rapa pretreatment. Neither CHX nor Rapa affected the baseline rates of patch formation in the absence of NGF treatment (Kruskal–Wallis ANOVA with Dunn's post hoc tests).
We next investigated whether axonal protein synthesis is required for the effects of NGF on the induction of axonal filopodia and actin patches. To directly test the involvement of axonal protein synthesis in the induction of axonal filopodia by NGF, cultures were pretreated with CHX for 30 min and axons were then severed from the cell bodies just before addition of NGF for 30 min. Treatment with CHX blocked the increase in the number of axonal filopodia induced by NGF (Fig. 2D). PI3K activity is required and sufficient for the effects of NGF on the formation of axonal filopodia and actin patches (Ketschek and Gallo, 2010). Target of rapamycin (TOR) is a kinase activated by PI3K signaling that drives protein synthesis through the regulation of p70-S6 kinase 1 and eukaryotic initiation factor 4E binding protein 1 (Martelli et al., 2011). Inhibition of TOR using rapamycin (25 nm, 1 h pretreatment), similar to CHX, blocked the NGF-induced increase in the number of axonal filopodia (30 min treatment; Fig. 2D). PI3K can be specifically and directly activated by a cell-permeable phospho-peptide that mimics receptor tyrosine kinase-mediated PI3K activation (PI3Kpep) (Williams and Doherty, 1999; Chadborn et al., 2006; Gallo, 2008; Ketschek and Gallo, 2010). Treatment with PI3Kpep, similar to NGF, increases the rate of actin patch formation and the number of axonal filopodia (Ketschek and Gallo, 2010). Treatment with PI3Kpep (50 μg/ml 1 h used throughout), relative to treatment with the inactive PI3KpepAla peptide, lacking the functionally required phospho-tyrosine, increased in the number of axonal filopodia along severed axons (Fig. 2D), and the effect of PI3Kpep was blocked by pretreatment with rapamycin (Fig. 2D). Similarly, pretreatment with CHX also blocked the response of axons to PI3Kpep. Axons treated with PI3Kpep + DMSO exhibited 9.0 ± 0.7 filopodia/distal 100 μm axon (n = 62), relative to 5.3 ± 0.5 for PI3Kpep + CHX (n = 44; p < 0.001) and 5.8 ± 0.7 in PI3KpepAla + DMSO (n = 42; p < 0.01). CHX treatment had no effect on PI3KpepAla-treated axons (5.46 ± 0.7; p > 0.05). These data indicate that PI3K-TOR signaling and axonal protein synthesis are required for the induction of axonal filopodia by NGF-PI3K signaling.
We next determined whether protein synthesis is required for the NGF-induced increase in the rate of actin patch formation. Pretreatment with CHX blocked the NGF-induced increase in the rate of axonal actin patch formation at 30 min following NGF treatment (Fig. 2E). Similarly, pretreatment with rapamycin blocked the NGF-induced increase in the rate of actin patch formation (Fig. 2E). In contrast, pretreatment with CHX did not have any effect on the NGF-induced increase in the number of filopodia present at growth cones after either a 5 or 30 min treatment with NGF (Fig. 2C). Similarly, counts of filopodia at growth cones treated with PI3Kpep revealed that PI3Kpep treatment increased growth cone filopodia from 7.0 ± 0.6 (n = 48; PI3KpepAla + DMSO) to 9.0 ± 0.5 (n = 71; PI3Kpep + DMSO; p < 0.05). CHX pretreatment had no effect on baseline filopodia in PI3KpepAla-treated cultures (7.15 ± 0.6, n = 48; p > 0.05), and also did not decrease the number of growth cone filopodia in PI3Kpep-treated cultures (10.8 ± 0.7, n = 52; p > 0.05). These data indicate that NGF can increase the number of axonal and growth cone filopodia in protein synthesis-dependent and -independent manners, respectively.
Finally, we note that at 5 min post-treatment with NGF there is an increase in the number of axonal “filopodia” detected in fix and stain experimental protocols (data not shown). However, as determined from live imaging studies these filopodia-like structures arise during jerky lateral motions of the axon induced by NGF treatment and may represent attachment points along the axon shaft, which generate filopodia-like structures when the axon displaces laterally. These filopodia-like structures thus do not arise through a protrusive event but from lateral motions of the axon shaft. Indeed, the increase in the number of “filopodia” observed at 5 min post-treatment is insensitive to CHX treatment. A time course analysis of the effects of CHX on the number of filopodia in fixed samples revealed that CHX only decreases the number of NGF-induced filopodia at times > 15 min post-NGF treatment (data not shown). Thus, care should be taken in the interpretation of axonal “filopodia” in fixed samples at short time intervals after NGF treatment in this culturing system, as a number of these structures may not be true filopodia, and may not arise through protrusion for the axon shaft.
NGF-induced increases in axonal microtubule levels and the localization of microtubules in axonal filopodia are independent of protein synthesis
The entry of one or more microtubules into an axonal filopodium is required for maturation of the filopodium into a branch (Gallo, 2011). We first determined whether NGF treatment affected the total amount of microtubule polymer in axons. Briefly, samples were simultaneously fixed and extracted, to remove soluble tubulin while retaining microtubule polymer, and the total amount of α-tubulin staining was determined in distal axons (as previously performed by Gallo and Letourneau, 1999). A 30 min treatment with NGF increased the amount of microtubule polymer in distal axons (Fig. 3A,B). The NGF-induced increase in axonal microtubule polymer levels was not affected by CHX pretreatment (Fig. 3B). Analysis of total α-tubulin levels in axons fixed and then extracted, thus reporting on soluble and polymeric α-tubulin, did not reveal an effect of NGF (p = 0.42, Mann–Whitney test, n = 30 axons per group). Thus, although NGF increases the levels of microtubule polymer in axons, it does not affect the levels of axonal α-tubulin.
Figure 3.

NGF-induced increases in axonal microtubule polymer levels and the localization of microtubules in axonal filopodia are independent of protein synthesis. A, Examples of microtubule levels in control (CNT) and NGF-treated axons (30 min) simultaneously fixed and extracted and stained with anti-α-tubulin. Note that the NGF-treated axons exhibit increased levels of microtubules. B, Quantification of the background subtracted integrated α-tubulin staining intensity in distal axons. CHX treatment did not affect baseline microtubule levels and did not impair the NGF-induced increase. n = number of axons measured is denoted in the bars. Data were analyzed using the Welch's t test. C, Example of EB3 decorated microtubule tips in the same axon pretreatment and 30 min post-treatment with NGF. Individual microtubule tips are denoted by arrowheads. D, Example of EB3-decorated microtubule tip entry into an axonal filopodia. The rightmost squares show the region of the axon emphasized in the subsequent squares (white box). The squares are separated by 1 min intervals and the signal was inverted to increase the ease of detection of microtubule tips. The arrowheads denote the tips of microtubules present in the filopodium/nascent branch. E, Examples of filopodia containing microtubules (green arrowheads) and filopodia devoid of microtubules (white arrowheads). The axon was simultaneously fixed and extracted and labeled to reveal microtubules and actin filaments (F-actin). F, Quantification of the percentage of axonal filopodia that contain one or more microtubules.NGF treatment increases the localization of microtubules in axonal filopodia, and CHX treatment did not affect baseline (p > 0.7) or NGF-induced levels of microtubules in axonal filopodia. Fischer's exact tests performed on raw categorical data.
Live imaging of microtubule tip polymerization, as revealed by microtubule tip associated GFP-EB3, was monitored in the same axons before and after NGF treatment. This experiment showed that NGF increased the number of actively polymerizing microtubule tips in distal axons by 49% (p < 0.0001, paired t test, n = 13 axons, 5.69 ± 0.5 and 8.46 ± 0.8 mean number of comets pre-/post-NGF respectively; Fig. 3C). Furthermore, before NGF treatment 2% of axonal filopodia contained one or more GFP-EB3-decorated microtubule tips during the imaging period, compared with 10% following NGF-treatment (p < 0.007, Wilcoxon matched-pairs signed-ranks test, n = 13 axons). Figure 3D shows an example of a filopodium, which is repeatedly invaded by GFP-EB3-decorated microtubule tips, and over a 5 min period develops into a branch. Similarly, analysis of the percentage of axonal filopodia containing microtubules in simultaneously fixed and extracted samples, stained with anti-α-tubulin and phalloidin, revealed that a 30 min treatment with NGF increased the percentage of axonal filopodia that contain microtubules along the distal 100 μm axon from 6 to 14% (Fig. 3E,F). CHX treatment had no effect on either the baseline or NGF-induced percentage of filopodia that contained microtubules (Fig. 3F). The data show that, in contrast to the regulation of axonal actin filament cytoskeleton, NGF-induced increases in axonal microtubule levels and the localization of microtubules to filopodia is independent of protein synthesis.
NGF induces protein synthesis-dependent increases in the axonal protein levels of cortactin, WAVE1, and Arp2
The actin-nucleating Arp2/3 complex is involved in the formation of actin patches, axonal filopodia, and branches in vitro and in vivo (Strasser et al., 2004; Spillane et al., 2011). The Arp2/3 complex is a seven polypeptide complex that drives the nucleation of actin filaments from pre-existing filaments giving rise to branched arrays of filaments, which contribute to the formation of filopodia (Yang and Svitkina, 2011). WAVE1 and cortactin drive activation of the Arp2/3 complex and stabilization of Arp2/3-mediated branched actin filaments, respectively (Ren et al., 2009; Derivery and Gautreau, 2010). Arp2/3 complex subunits, cortactin and WAVE1 target to axonal actin patches (Spillane et al., 2011). mRNAs for cortactin and Arp2 have been reported to target to axons (Gumy et al., 2011). We therefore sought to determine if NGF altered the axonal levels of these proteins in a translation-dependent manner in severed axons. To address this question, we used quantitative immunocytochemistry and measured background subtracted integrated staining intensity in the distal 40 μm axons severed from explants as in previous experiments. A 30 min treatment with NGF increased the axonal levels of cortactin, WAVE1, and Arp2 in severed axons in a CHX-sensitive manner (Fig. 4A,B). Similar increases in staining intensities were detected in axons not severed from the cell bodies (data not shown), indicating that severing does not contribute to the NGF-induced increases.
Figure 4.

NGF induces protein synthesis-dependent increases in the axonal levels of cortactin, WAVE1, and Arp2 in severed axons. A, Representative examples of the staining intensities of cortactin, WAVE1, and Arp2 in axons with and without NGF treatment. The examples are from the primary datasets and the levels of staining are in the lower range of the spectrum to assure that all measurements are within the dynamic range of measurement. B, Graph showing the mean integrated background subtracted intensities of cortactin, WAVE1, and Arp2 determined in distal axons (40 μm) through quantitative immunocytochemistry as described (see Materials and Methods). For each protein, the groups were compared using the Kruskal–Wallis ANOVA with Dunn's post hoc tests. Only the NGF-treated group differed from any of the other groups in each set. Sample sizes (n = axons) are shown in the bars. C, Detection of axonal and somatic mRNAs using purified axonal preparations and cell body preparations as described (see Results and Materials and Methods). As a positive control, β-actin mRNA was detected in axons. In contrast, mRNAs that are known to not target to axons (γ-actin, MAP2, ATF2) were not detected in axonal preparations, but were readily detectable in the somatic preparations. Although GAP-43 has been reported to target to axons in some systems, we did not detect axonal GAP-43 mRNA. mRNAs for cortactin, WAVE1, and Arp2 were detected in axonal preparations. D, Ratiometric analysis of the relative levels of actin filaments (phalloidin staining) and either WAVE1 or cortactin in individual patches. The analysis is shown for NGF-treated and untreated control axons. In each graph a point represents an actin patch. The x-axis and y-axis denote the integrated intensity of phalloidin staining and protein levels detected immunocytochemically in the patch. Graphs on the left represent no NGF treatment data and those on the right represent post-NGF treatment. NGF did not affect the ratio of WAVE or cortactin to actin filaments in patches (W/A or C/A). In all cases the correlation coefficient between actin filament levels of protein levels was between 0.65 and 0.74.
To determine if mRNAs for cortactin, Arp2, and WAVE1 are present in chicken sensory axons, we used compartmentalized chambers to obtain purified axonal preparations followed by PCR-based amplification and detection of individual mRNA species. Briefly, DRG explants were cultured on filters with 8 μm diameter pores that allowed axons, but not neuronal cell bodies or non-neuronal cells, to penetrate the filter and extend on the bottom of the filter opposite to the side where the explants were plated. The explants on the top of the filter and the axons on the bottom of the filter were then harvested separately. The purity of the axonal preparation was confirmed by the lack of detection of mRNAs that do not target to axons (γ-actin, ATF2, MAP2) (Zheng et al., 2001; Willis et al., 2005; Cox et al., 2008). Only samples that satisfied these conditions were used to detect axonal mRNAs. Using this approach, mRNAs for cortactin, Arp2, and WAVE1 were detected in axonal preparations (Fig. 4C). Although GAP-43 mRNA has been previously detected in other axonal preparations, we did not detect it in our axonal samples. Collectively, these data show that sensory axons contain mRNAs for cortactin, Arp2, and WAVE1 and NGF induces protein synthesis-dependent increases in the levels of the proteins in axons severed from the cell bodies.
Treatment with NGF increases the rate of actin patch formation but does not alter the mean F-actin content of axonal actin patches (Spillane et al., 2011). We next analyzed whether the increase in the NGF-induced levels of cortactin and WAVE1 translated into greater accumulation of these Arp2/3 regulators in actin patches. Single patch analysis of the ratio of the levels of cortactin, or WAVE1, to the F-actin content of individual actin patches revealed that following NGF treatment similar amounts of cortactin and WAVE1 target to patches (Fig. 4D). Thus, the NGF-induced increases in axonal cortactin and WAVE1 levels do not result in accumulation of these Arp2/3 complex regulators in actin patches above baseline values. These data suggest that the increased axonal levels of cortactin and WAVE1 are used to maintain functionally adequate levels of these proteins in actin patches in the face of increased rates of patch formation. The data do not, however, rule out the possibility that axonally synthesized WAVE1 and cortactin may be functionally distinct from the pre-existing molecules.
Live imaging analysis of the axonal translation of myrGFP targeted into axons using the 3′UTRs of Arp2 and cortactin chicken mRNA
The quantitative immunocytochemical studies reveal a CHX-sensitive increase in axonal protein levels in axons isolated from the cell bodies. To independently verify the axonal translation of Arp2 and cortactin in vitro, we used a live imaging fluorescence recovery from photobleach (FRAP) approach, as previously performed to detect the localized translation of other mRNAs (Aakalu et al., 2001; Vuppalanchi et al., 2010). The 3′UTRs of mRNAs are responsible for the axonal targeting of mRNAs (for review, see Donnelly et al., 2010; Yoo et al., 2010). As a reporter of translation, we used GFP mRNA containing a myristoylation sequence (myrGFP) targeted to axons using the 3′UTRs of chicken Arp2 and cortactin. Myristoylation is a cotranslational modification of nascent proteins that targets them to the membrane and greatly decreases their diffusion (Aakalu et al., 2001; Yudin et al., 2008). In vitro FRAP studies have shown that myrGFP fluorescence, derived from the expression of subcellularly targeted mRNA, recovers in axons and dendrites in a protein synthesis-dependent manner, and there is a low level of diffusion of myrGFP from adjacent axon segments (Aakalu et al., 2001; Yudin et al., 2008; Vuppalanchi et al., 2010). Dissociated neurons were cultured in NGF, to drive translation, and FRAP was determined with and without pretreatment with CHX. Expression of the myrGFP-Arp2 3′UTR and cortactin myrGFP-cortactin 3′UTR constructs resulted in myrGFP throughout axons (Fig. 5A,C), and exhibited localized differences in intensity consistent with previous observations on dendrites and axons (Fig. 5A–D; Aakalu et al., 2001; Vuppalanchi et al., 2010). During a 40 min post-bleach period the axons of neurons expressing myrGFP-Arp2 3′UTR and cortactin myrGFP-cortactin 3′UTR recovered 54 and 58%, respectively (Fig. 5E). For both constructs, the recovery was decreased to 19% by a 30 min pretreatment with 35 μm CHX (Fig. 5E). In the absence of CHX the recovery begun within 20 min post-photobleaching and increased steadily. In contrast, the recovery in the presence of CHX was minimal before 20 min and increased slightly between 20 and 40 min. Subtracting the CHX-insensitive component of the recovery yields a mean recovery of 35 and 39% for Arp2 and cortactin at 40 min post-photobleaching, respectively. The slight recovery observed with CHX is consistent with previous analysis of 3′UTR myrGFP reporters and may reflect translational leakage or slight diffusion of myrGFP from the more proximal axon (Aakalu et al., 2001; Vuppalanchi et al., 2010). Similar results were obtained expressing myrGFP-β-actin 3′UTR (data not shown; see Fig. 9). These data directly reveal the axonal translation of mRNA targeted into axons using the 3′UTRs of Arp2 and cortactin.
Figure 5.

Fluorescence recovery after photobleaching analysis and visualization of the axonal translation of myrGFP mRNA targeted into axons using the 3′UTRs of Arp2 and cortactin in vitro. The left and right columns represent data from myrGFP-Arp2 3′UTR and myrGFP-cortactin 3′UTR expression, respectively. A, Representative examples of false colored axons showing the expression of myrGFP constructs. The axons are shown pre, immediately post, and 40 min post-photobleach. Note the recovery of fluorescence by 40 min. B, Plots of intensity line scans obtained using National Institutes of Health ImageJ from the images shown above the plots in A. Pre (black) and 40 min post (red) scans are shown. The line scans are size matched to the relevant images, and the measurement bar in A applies to the Distance Along Axon x-axis of the scans. The myrGFP signal recovers significantly, and at both pre- and post-photobleach the signal exhibits local variations consistent with Aakalu et al. (2001). C, D, They follow the format of A and B, but show the extent of myrGFP recovery in axons pretreated with (30 min, 35 μm). Note the minimal recovery of fluorescence as shown by both the false colored images and the intensity line scan plots. Note that the axons in the cortactin 3′UTR and Arp 3′UTR parts in A and C, respectively, underwent lateral displacement on the substratum, a normal feature of axonal behavior in vitro over a 30–60 min period. E, Graphs showing the percentage of myrGFP fluorescence recovery as a function of time following photobleach for myrGFP-Arp2 3′UTR and myrGFP-cortactin 3′UTR constructs with and without CHX pretreatment. Within time series the data were analyzed using a Kruskal–Wallis test nonparametric repeated-measures ANOVA and Dunn's multiple-comparison tests. The p values shown over each time point represent comparison of the time points to the value at 5 min within the time series (*p < 0.05; **p < 0.01). Comparison of the recovery values across groups (control vs CHX) at each time point using a Kruskal–Wallis Test nonparametric ANOVA and Dunn's multiple-comparisons tests yielded p < 0.05 for comparisons at ≥15 min for both Arp2 and cortactin 3′UTR constructs. n = axons.
Figure 9.

Experimental demonstration of the axonal translation of mRNA in the living spinal cord. DRG were cotransfected in ovo with myrGFP-β-actin 3′UTR and RFP, as a reporter of axonal morphology following bleaching of the myrGFP signal. A, Shows examples of the FRAP of axons in the living spinal cord. Note the detectable recovery in the control axon (DMSO treated) relative to the minimal recovery observed in the CHX-treated axon. Distal axons were photobleached so as to minimize the possibility of recovery being due to diffusion from distal and proximal axon segments. B, Graph showing the quantification of the recovery of fluorescence at 10 min post-photobleaching intervals (n = 7 axons per group, each axon represents one ex vivo spinal cord). The green line denotes the mean recovery from photobleach observed in the baseline/DMSO group when the mean of the recovery in the CHX group is subtracted at each time point. Within time series the data were analyzed using a Kruskal–Wallis Test nonparametric repeated-measures ANOVA and Dunn's multiple-comparison tests. The p values shown over each time point represent comparison of the time points to the value at 10 min within the time series. Comparison of the recovery values across groups (DMSO vs CHX) at each time point using a Kruskal–Wallis Test nonparametric ANOVA and Dunn's multiple-comparisons tests yielded p < 0.01 for comparisons at 20, 30, and 40 min. The 10 min time points were not below p = 0.05.
NGF regulates the axonal levels of cortactin and WAVE1 through PI3K signaling
PI3K can activate protein translation through Akt-mediated activation of the kinase TOR, and we have previously reported that Akt activity is required for actin patch formation (Ketschek and Gallo, 2010). To determine if PI3K activity is sufficient to elicit increases in the axonal levels of cortactin, WAVE1, and Arp2, cultures were treated with the cell-permeable PI3K-activating peptide PI3Kpep or the inactive control peptide PI3KpepAla, as previously described in Figure 2D. Relative to PI3KpepAla, PI3Kpep treatment increased the axonal levels of cortactin and WAVE1, but not Arp2 (Fig. 6A). The effect of PI3Kpep on axonal protein levels was surprisingly strong for WAVE1 and increased levels by 259% relative to control axons. The strong effect of PI3Kpep on WAVE1 levels is considered (see Discussion). Inhibition of PI3K activity during treatment with NGF using LY294002 (10 μm, cotreatment with NGF) blocked the NGF-induced increases in the levels of cortactin and WAVE1, and Arp2 (Fig. 6B). Collectively, the data thus indicate that NGF drives the axonal protein synthesis of cortactin, WAVE1, and Arp2 in a PI3K-dependent manner. However, although PI3K signaling is sufficient for increasing the axonal levels of cortactin and WAVE1, it is not sufficient for increasing the axonal levels of Arp2.
Figure 6.

NGF regulates the axonal proteins levels of Arp2, cortactin, and WAVE1 through PI3K signaling. A, Treatment with PI3Kpep, relative to the control PI3KpepAla, increased axonal levels of cortactin and WAVE1, but not Arp2. The effect of PI3Kpep on WAVE1 levels was strong and the y-axis is presented with a break to cover the range of fold differences between groups in the same graph. The number of axons analyzed is shown in the bars. Groups were compared using the Mann–Whitney test. B, Inhibition of PI3K signaling using LY294002 (LY; 10 μm, cotreatment) blocked the NGF-induced increases in the axonal levels of cortactin, WAVE1, and Arp2 (p value shown in bars). LY did not affect the baseline levels of proteins. Number of axons analyzed are shown in the bars. Within protein, the datasets were analyzed using the Kruskal–Wallis ANOVA with Dunn's post hoc tests.
Rac1 contributes to the NGF-induced increase in the number of axonal actin patches and filopodia
The Rac1 GTPase activates WAVE1, which in turn activates the Arp2/3 complex (Derivery and Gautreau, 2010). We therefore sought to determine if Rac1 is involved in the effects of NGF on axonal and growth cone filopodia. Immunostaining with a Rac1 antibody showed that Rac1 is found in axonal actin patches (Fig. 7A). Consistent with previous studies (Kuhn et al., 1998; Thies and Davenport, 2003), Rac1 was distributed in puncta of varying density and intensity among a low background along the axon shaft. Similarly, using an antibody specific to active GTP-loaded Rac1 we found that GTP-Rac1 is concentrated in actin patches (Fig. 7B). Concentrations of GTP-Rac1 were also observed in the absence of actin patches (data not shown), likely indicating additional roles of Rac1 in axons. Unlike cortactin, Arp2, and WAVE1, NGF treatment did not affect the axonal levels of Rac1 (Fig. 7C). However, NGF increased the levels of GTP-Rac1 in axons by 77% (Fig. 7C).
Figure 7.

Rac1 regulates the number of axonal actin patches and filopodia. A, Example of an axon stained with phalloidin (F-actin) and antibodies to Rac1. Rac1 staining was punctate throughout the axon, and actin patches colocalized with puncta of Rac1. B, Example of an axon stained with phalloidin and an antibody specific to GTP-loaded Rac1. GTP-loaded Rac1, similar to total Rac1, also colocalized with actin patches. C, Quantification of the integrated staining intensity of Rac1 and GTP-Rac1 in the distal 40 μm axons as a function of NGF treatment (30 min). Inset shows false colored examples of axons. NGF did not affect the levels of Rac1, but increased staining levels for GTP-Rac1. Sample sizes (n = axons) are shown in the bars, data were analyzed using Welch's t test. D, Quantification of the number of axonal actin patches detected through phalloidin staining in the distal axons (F) of neurons transfected with constitutively active (Q61L) and dominant-negative (T17N) forms of Rac1 and Cdc42 purified proteins using the Chariot cell-permeable peptide carrier (Gallo, 2003). For both D and E the number of axons measured is shown in the bars (D) and groups were compared using the Kruskal–Wallis ANOVA with Dunn's post hoc tests. E, Quantification of the number of axonal filopodia detected through phalloidin staining along distal axons. F, False colored examples of distal axons and growth cones transfected with bovine serum albumin (BSA) (control), constitutively active or dominant-negative Rac1 and CDc42 and stained with phalloidin. The arrowheads in BSA denote actin patches. Note the lack of prominent actin patches in the axon transfected with T17N-Rac1. The inset in the Q61L-Cdc42 shows that in this set of axons we observed an increase in the presence of what appears to be intra-axonal actin filament bundles extending parallel to the main axis of the axon, with actin patches often found overlapping the apparent bundles. The double-headed arrow denotes the presence of bundle-like structures in the axon.
PI3K signaling can result in activation of Rac1 (Park et al., 2004; Pan et al., 2005; Qian et al., 2005). We therefore sought to determine whether NGF-induced PI3K activity drives Rac1 in axons. PI3Kpep and PI3KpepAla treatments were performed as in previous experiments (50 μg/ml, 1 h) and levels of GTP-Rac1 detected and measured as in Figure 7C. In the absence of NGF, PI3Kpep increased the levels of GTP-Rac1 by 44% (mean intensity values of 172 ± 14 (n = 61) and 248 ± 18 (n = 65) for PI3KpepAla and PI3Kpep, respectively; p < 0.002, Mann–Whitney test). Conversely, we determined the requirement of PI3K in the activation of Rac1 by NGF. A 30 min cotreatment with NGF and the PI3K inhibitor LY294002 (10 μm) suppressed the NGF-induced increase in axonal levels of GTP-Rac1 (NGF + DMSO vs NGF + LY294002, n = 33 and 57, p > 0.08, Mann–Whitney test). LY294002 treatment alone, for the same time period as in the NGF cotreatment experiment above, did not, however, decrease baseline levels of GTP-Rac1 in the absence of NGF treatment (DMSO vs LY, n = 33 and 27, p = 0.45, Mann–Whitney test). In the absence of NGF, integrin signaling is considered to drive the PI3K-dependent formation of actin patches and filopodia (Ketschek and Gallo, 2010). The data are consistent with previous studies that have shown that laminin signaling can activate Rac1 through a PI3K-independent pathway (Tang et al., 2011), but our data suggest that NGF signaling through PI3K can activate Rac1 in axons.
To determine whether Rac1 is involved in the regulation of axonal actin patches and filopodia, we transfected neurons with dominant-negative T17N-Rac1 and T17N-Cdc42 protein using the protein internalization Chariot peptide as previously described (Gallo, 2003; see Materials and Methods). In cultures raised in NGF, T17N-Rac1 decreased the number of axonal actin patches and filopodia (Fig. 7D,E). Chariot-mediated transfection with T17N-Cdc42 protein had no effect on either the number of actin patches or filopodia (Fig. 7D,E). However, T17N-Cdc42 decreased the number of filopodia at the growth cones of the same axons by 42% (mean number of 8.65 ± 0.5 and 5.05 ± 0.5 filopodia for BSA control and T17N-Cdc42, respectively; p < 0.0001, Mann–Whitney test). T17N-Rac1 also decreased the number of growth cone filopodia by a similar extent as T17N-Cdc42 (5.04 ± 0.49 filopodia; p < 0.0001, Mann–Whitney test). Similar to the lack of an additive effect of PI3Kpep treatment and NGF on the number of axonal filopodia (Ketschek and Gallo, 2010), chariot peptide-mediated transfection with constitutively active Q61L-Rac1 in the presence of NGF did not further increase the number of axonal actin patches and filopodia (Fig. 7D,E). However, as expected, Q61L-Rac1promoted the formation of lamellipodia at growth cones and increased growth cone size (Fig. 7F; data not shown). We also observed that axons transfected with Q61L-Cdc42 often exhibited increased levels of axonal actin filaments, which, however, appeared to be bundles of filaments running parallel to the axis of the axon (Fig. 7F, inset in Q61L-Cdc42), similar to those we have observed following treatment with Semaphorin 3A (Gallo, 2006). Collectively, these data indicate that NGF activates Rac1 in axons and Rac1 activity, presumably by activating WAVE1, drives the Arp2/3-dependent assembly of actin patches.
WAVE1 controls the rate of formation of axonal actin patches but not the rate of emergence of filopodia from patches
NGF treatment increases the rate of actin patch formation, without affecting the probability that individual patches will give rise to filopodia, or the duration of patches (Ketschek and Gallo, 2010). NGF increases the axonal levels of both cortactin and WAVE1, both of which in turn regulate the Arp2/3 complex. However, the specific contributions of WAVE1 and cortactin in the regulation of actin patches and axonal filopodia are not known. The rationale for the following experiment is to mimic the NGF-induced increase in axonal levels of WAVE1 on axonal actin patches and filopodia, in the absence of a corresponding increase in the levels of cortactin. Therefore, we addressed the effects of overexpression of GFP-WAVE1, relative to expression of GFP, on actin patch dynamics visualized through expression of mCherry-actin. In the absence of NGF treatment, overexpression of GFP-WAVE1 increased the rate of actin patch formation (Fig. 8A). However, overexpression of GFP-WAVE1 did not further increase the rate of patch formation following NGF treatment (Fig. 8A), indicating that the exogenously expressed WAVE1 did not have an additive effect with the NGF-induced increases in axonal WAVE1 levels. Although NGF treatment increases the rate of actin patch formation, it does not alter the duration of patches, which is maintained at pre-NGF values (Ketschek and Gallo, 2010). In the absence of NGF treatment, overexpression of GFP-WAVE1 decreased the duration of actin patches by 42% (p < 0.04), but did not affect the duration of patches following NGF treatment (p > 0.05). Interestingly, although WAVE1 overexpression increased the rate of actin patch formation, it did not affect the rate of formation of axonal filopodia. Neither comparison of pre-NGF treatment GFP controls to GFP-WAVE1 overexpressors (p = 0.98) or post-NGF treatment comparisons (p = 0.85) revealed a statistically significant difference in the formation of filopodia. Thus, overexpression of WAVE1 in the absence of NGF increased the formation of actin patches, which were, however, shorter in duration than controls, but gave rise to similar numbers of filopodia. In contrast, following treatment with NGF the duration of patches formed in WAVE1 overexpressing axons was not different from NGF-treated control axons. These observations indicate that NGF activates a mechanism, not operative in its absence, which allows the duration of patches to be maintained at baseline levels when the rate of patch formation is increased by NGF, or already elevated to NGF-like levels by overexpression of WAVE1. Consistent with its role as an activator of the Arp2/3 complex, these data indicate that WAVE1 drives the initiation of actin patches but does not regulate the emergence of filopodia from actin patches. A caveat of the experimental design is that we cannot control the expression level of exogenous proteins to identically match the increase induced by NGF. However, the data reveal that overexpression only affects patches in the absence of NGF, and reveals the role of WAVE1 in the regulation of actin patches.
Cortactin promotes collateral branching and the emergence of filopodia from actin patches but not the rate of actin patch formation
Cortactin promotes the formation of axonal filopodia and collateral branches in vitro (Mingorance-Le Meur and O'Connor, 2009). Based on the rationale described for the experiments overexpressing WAVE1, we examined the effect of overexpressing cortactin in neurons raised in the absence of NGF, and following NGF treatment. Axonal actin patch dynamics were determined in axons cotransfected with RFP-cortactin, or RFP as a control, and eYFP-β-actin. Overexpression of cortactin did not affect the rate of actin patch formation either before (p > 0.72, Welch's t test) or after (p > 0.54, Welch's t test) treatment with NGF (Fig. 8B), and NGF similarly increased the rate of patch formation in control and cortactin overexpressing axons (Fig. 8B). However, cortactin overexpression increased the duration of actin patches relative to control axons both before and after treatment with NGF (Fig. 8C). Although cortactin increased the duration of patches, NGF treatment had no effect on duration in either control (p > 0.79, Welch's t test) or cortactin overexpressing axons (p > 0.7, Welch's t test; Fig. 8C), consistent with the previously reported lack of an effect of NGF on patch duration (Ketschek and Gallo, 2010). Overexpression of cortactin increased the rate of formation of axonal filopodia in the absence of NGF (p < 0.03, Mann–Whitney test), but did not further increase the NGF-induced increase in formation of filopodia (p > 0.05, Mann–Whitney test). Relative to the controls, cortactin overexpression increased the proportion of actin patches that give rise to filopodia in the absence of NGF (p < 0.009, Fischer's exact test), but not in the presence of NGF (p > 0.14, Fischer's exact test). Thus, overexpression of cortactin has no statistically significant effects on the response of axons to NGF. In the absence of NGF, overexpression of cortactin increases the emergence of axonal filopodia from spontaneously formed actin patches resulting in increased formation of axonal filopodia. These data suggest that cortactin regulates the reorganization of the meshwork of actin filaments in patches leading to the formation of a filopodial bundle of actin filaments (Spillane et al., 2011). Collectively, these data indicate that WAVE1 contributes to the rate of actin patch formation, while cortactin contributes to the mechanism that determines whether a patch gives rise to a filopodium.
To determine if overexpression of cortactin would affect axons in vivo, we electroporated DRGs in ovo and determined the number of axonal filopodia and branches along DRG axons extending in the dorsal funiculi of the caudal spinal cord in an acute ex vivo preparation as previously described (Fig. 8D,E) (Spillane et al., 2011). Briefly, embryos were electroporated at E3, and on E7 the caudal spinal cord was rapidly dissected and transferred to an imaging dish (Fig. 8D). At E7 DRG axons are just beginning to establish collateral branches in the spinal cord (Mendelson et al., 1992), in an Arp2/3-dependent manner (Spillane et al., 2011). The morphology of DRG axons expressing RFP-cortactin, or RFP alone, was imaged at 100× in the dorsal funiculi of the spinal cord. Axonal filopodia and branches were scored based on previously established length criteria (Spillane et al., 2011). Axonal protrusions less than twice the median length of all control axonal protrusions (5.8 μm) were scored as axonal filopodia, and branches were defined as protrusions greater than twice the median length. Overexpression of RFP-cortactin relative to RFP alone increased the number axonal filopodia by 154% (p < 0.0001, Mann–Whitney, n = 54 and 46 axons, respectively; Fig. 8E,F). Cortactin overexpression also increased the percentage of axonal protrusions classified as branches by 91% relative to the RFP control (p < 0.05, Fischer's exact test; Fig. 8E,F). These results are consistent with the in vitro results and suggest that the role of cortactin in the formation of axonal filopodia and branches is retained in vivo.
To address the relevance of the axonal synthesis of specific proteins in the NGF-induced formation of axonal filopodia, we used an antisense approach to inhibit the axonal translation of cortactin. Cortactin was chosen since the above experiments determined that it controls the emergence of filopodia from patches and promotes branching. An antisense sequence previously shown to block the translation of chicken cortactin mRNA was used (Cheng et al., 2000), and a scrambled version served as a control. To deliver antisense in axons, we used gripNA-antisense. GripNA oligonucleotides are negatively charged peptide nucleic acids (see Materials and Methods), which due to their peptidic nature can be delivered intracellularly by the cell-permeable Chariot peptide (for review, see Gallo, 2003). To determine intracellular delivery we used fluorescein-conjugated gripNAs. Explants were treated with gripNA complexed with Chariot for 90 min and internalization of the griPNA was confirmed by the presence of fluorescein fluorescence along the axons (Fig. 8G). Axons were then severed from the explants, as in previous experiments, and treated with NGF for 30 min, followed by fixation and staining with phalloidin and anti-cortactin to determine the number of axonal filopodia and cortactin levels (Fig. 8G). Treatment with anti-cortactin gripNA, but not control gripNA, impaired the increase in the number of filopodia induced by NGF (Fig. 8H). Neither gripNA affected baseline number of filopodia. Quantification of the levels of cortactin in axons, as in Figure 4, showed that the anti-cortactin gripNA impaired the NGF-induced increase in cortactin levels, which occurred following NGF treatment in control gripNA-treated cultures (Fig. 8I). Treatment with cortactin gripNA did not, however, impair the effects of NGF on axonal levels of WAVE1 determined as in Figure 4 (n = 45 axons per group, NGF-treated integrated intensity of 142% relative to no NGF treatment, p < 0.001). The data thus indicate that inhibition of the axonal translation of cortactin mRNA impairs the ability of NGF to induce increases in the number of axonal filopodia.
Direct evidence for the axonal translation of β-actin mRNA in the living ex vivo spinal cord
Although evidence for intra-axonal protein synthesis has accumulated from in vitro studies, very little is known about axonal protein synthesis in vivo. A recent study described that myrGFP-mRNA axonally targeted using the 3′UTR of β-actin is detected along peripheral and central sensory axons in transgenic mice (Willis et al., 2011). However, direct experimental determination of protein synthesis in axons in their biologically relevant environment is minimal (Brittis et al., 2002). We took advantage of the ex vivo E7 spinal cord preparation to experimentally investigate whether sensory axons translate mRNAs in the spinal cord. To address the issue, we used GFP mRNA containing a myristoylation sequence targeted to axons using the β-actin 3′UTR (Willis et al., 2011) (Fig. 5). We coexpressed myrGFP-β-actin 3′UTR and RFP in ovo and performed FRAP along axons in the ex vivo spinal cord in the presence or absence of CHX. During the dissection of the spinal cord we made sure to remove the DRGs, thus axotomizing axons and separating them from their cell bodies. myrGFP expression was present along sensory axons growing in the dorsal funiculi of the acute ex vivo spinal cord (Fig. 9A), consistent with the previous demonstration that myrGFP is detected in the central branches of sensory axons in vivo in transgenic mice (Willis et al., 2011). FRAP analysis of axons revealed that during a 40 min treatment myrGFP recovered by a mean of 30%, and the recovery was greatly impaired by pretreatment with CHX (Fig. 9B). The CHX-treated axons also recovered by ∼5% during a 40 min period (Fig. 9B). The recovery observed in the CHX group could represent incomplete effects of CHX, or the diffusion of myrGFP from the more proximal axon. The graph in Figure 9B thus also shows the data for the baseline recovery group with the mean of the recovery of the CHX group subtracted at each time point. Taking the CHX recovery into account, this yields a 25% recovery from photobleach at 40 min post-bleaching. These data experimentally demonstrate that the central axons of DRG sensory neurons actively translate β-actin mRNAs in the spinal cord. One caveat is that the expression of myrGFP observed in the acutely ex vivo spinal cord may be a consequence of the injury to axons during dissection. This scenario is highly unlikely since the cord is imaged within 5 min of the dissection and the amount of fluorescence recovery in axons, as an indicator of the rate of translation, only recovers by 6% of the initial value during a 10 min post-bleaching period. Thus, the levels of myrGFP observed in axons upon first imaging of the cord are not likely due to a response of the axons to the dissection of the spinal cord required for ex vivo imaging.
Discussion
The mechanisms of axon collateral branching are only partially understood. This study reveals that NGF induces branching of embryonic sensory axons through both axonal protein synthesis-dependent and -independent mechanisms. The emergence of axonal filopodia from precursor axonal actin patches is one of the earliest steps in collateral branching in vivo and in vitro (Gallo, 2011). NGF induces the axonal synthesis of proteins involved in the regulation of the Arp2/3 complex that contribute to the control of the rate of formation of axonal actin patches (WAVE1) and the emergence of filopodia from patches (cortactin). In contrast, NGF increases the levels of axonal microtubules and promotes the localization of microtubules into axonal filopodia in a protein synthesis-independent manner. These new data advance previous findings and suggest a model for the signaling and cytoskeletal basis of embryonic sensory axon collateral branching (Fig. 10).
Figure 10.

Suggested model of the differential regulation of filopodia-mediated axon branch formation and the regulation of growth cone filopodia by NGF. A, The growth cones of chicken sensory neurons use both Cdc42 and Rac1 to control the number of growth cone filopodia in the presence of NGF, in a protein synthesis-independent manner. PI3K signaling at least partially drives the mechanism controlling the number of growth cone filopodia (Marsick et al., 2012). The response of growth cones to NGF is rapid and occurs maximally in <5 min. In contrast, in response to NGF-PI3K signaling, the axon shaft generates Rac1 and protein synthesis-dependent axonal filopodia, independent of Cdc42. Furthermore, the role for protein synthesis in this mechanism is reflected in the longer post-NGF treatment time required for the axon to mount a response (≥15 min). B, This study advanced our previous understanding of the mechanisms of sensory axon collateral branch formation in response to NGF. Previously established components of the mechanism are shown in black text, and the novel observations are denoted by white text on a black background. NGF activates PI3K, resulting in activation of Rac1, which drives the activity of the Arp2/3 activator WAVE1. WAVE1 activity promotes Arp2/3-dependent actin patch initiation. Cortactin positively regulates actin patch duration and contributes to the probability of emergence of a filopodium from the patch. PI3K activity concurrently also drives the intra-axonal synthesis of WAVE1, cortactin, and Arp2 from axonally targeted mRNAs. NGF, through as of yet undetermined signaling mechanisms, also promotes the polymerization of microtubules in axons and increases the localization of microtubule tips into filopodia. While NGF treatment increases the rate of actin patch formation, and thus filopodia, patches formed in the presence of NGF are not distinguishable from patches that form in the absence of NGF (Ketschek and Gallo, 2010). We propose that the axonal protein synthesis-dependent increases in WAVE1, cortactin, and Arp2 induced by NGF serve to provide additional building blocks for the generation of more actin patches, while maintaining the duration and probability of filopodial emergence from patches at pre-NGF levels. C, We propose that PI3K signaling has two major roles in the formation of axonal actin patches. Localized axonal microdomains of PIP3 accumulation driven by PI3K activity determine the sites of actin patch formation (Ketschek and Gallo, 2010). PI3K signaling, by driving axonal protein synthesis, also increases the axonal levels of the molecular machinery required to form more patches in the presence of NGF (e.g., WAVE1, cortactin, and Arp2). Whether PIP3 microdomains also locally drive protein synthesis is currently under investigation (gray line). The role of intra-axonal protein synthesis in this system may thus be to serve as a matching mechanism that provides cellular components required to maintain the system at steady state in the face of increased levels of signaling and the demand for increased output (i.e., increased formation of filopodia and branches). The role of intra-axonal protein synthesis in this system fits broadly under the umbrella of merotrophism as proposed by Alvarez et al. (2000).
The branching of retinal axons in vivo is independent of continuity with the cell body (Harris et al., 1987), the mRNA binding protein FMRP negatively regulates axon branching (Pan et al., 2004; Tucker et al., 2006), and β-actin and actin depolymerizing factor mRNAs accumulate at sites of axon branching (Olink-Coux and Hollenbeck, 1996; Lee and Hollenbeck, 2003), suggesting a link between branching and axonal translation. PI3K-Akt signaling promotes axon branching, but the cellular mechanisms are minimally understood (Gallo, 2011). Akt activates TOR, and expression of constitutively active Akt in sensory neurons increases the formation of collateral branches through a rapamycin-sensitive mechanism (Grider et al., 2009). Furthermore, rapamycin impairs axon sprouting in models of epilepsy (Buckmaster and Lew, 2011; Buckmaster and Wen, 2011). This study shows that, in the context of NGF signaling, PI3K activity is required for the axonal synthesis of cortactin, WAVE1, and Arp2. In axons not treated with NGF, overexpression of cortactin promoted formation of axonal filopodia by increasing the probability that an actin patch will give rise to a filopodium without affecting the rate of patch formation, and increased the duration of patches. Following NGF treatment, the same relative amount of cortactin targeted to patches as in the absence of NGF. While NGF increases the rate of patch formation, it does not alter the probability of the emergence of a filopodium from a patch or the duration of patches (Ketschek and Gallo, 2010). These data thus suggest that the NGF-induced increase in cortactin levels serves to match the amount of available cortactin to the requirements imposed by the greater number of actin patches formed in response to NGF, thereby maintaining the pre-NGF duration of patches and probability of filopodial emergence. In contrast, overexpression of WAVE1 in the absence of NGF increased the rate of actin patch formation but not the formation of filopodia, and treatment with NGF did not further increase patch formation. Furthermore, when greater numbers of patches are formed due to WAVE1 overexpression in the absence of NGF, the duration of patches is decreased, suggesting that insufficient amounts of regulators of patch duration (e.g., cortactin) are available to maintain patch duration at baseline levels. Thus, we propose that the protein synthesis-dependent increase in the axonal WAVE1 contributes to the NGF-induced increase in the rate of actin patch formation, while the protein synthesis-dependent increases in axonal cortactin contribute to the duration of patches and emergence of filopodia from patches in the face of increased levels of patch formation induced by NGF (Fig. 10).
Rac1 regulates the actin cytoskeleton (Ridley, 2006) and positively regulates branching in vivo (Gallo, 2011). However, the cellular role of Rac1 in branching has not been resolved. The data demonstrate that NGF activates axonal Rac1 though a canonical signal transduction mechanism involving PI3K, without affecting the axonal levels of Rac1. Rac1 is a well established activator of WAVE (Derivery and Gautreau, 2010). Collectively, the data thus indicate that NGF increases Rac1 activity levels in axons, which in turn activate WAVE1 leading to the promotion of actin patch initiation. The NGF-induced increase in levels of WAVE1 may serve to match the availability of WAVE1 to the increased levels of Rac1 signaling.
Although Cdc42 is the canonical GTPase thought to mediate formation of filopodia (Ridley, 2006), we did not find an effect of dominant-negative Cdc42 on the number of axonal filopodia, consistent with a lack of effect on axon branching (Brown et al., 2000). However, dominant-negative Cdc42 and Rac1 decreased the number of growth cone filopodia, which is consistent with previous observations (Kuhn et al., 1998; Chen et al., 2006; Rajnicek et al., 2006; Leemhuis et al., 2010). Differences in the role of actin depolymerizing factor in the regulation of growth cone and axonal filopodia have similarly been reported (Meberg and Bamburg, 2000), and the actin nucleation factor cordon blue regulates branching but not axon extension (Ahuja et al., 2007). Our study revealed that while the NGF-induced formation of axonal filopodia is dependent on axonal protein synthesis, the regulation of growth cone filopodia by NGF is not dependent on synthesis. However, we note that the mRNA binding protein FMRP negatively regulates the number of filopodia at hippocampal growth cones (Antar et al., 2006), while another mRNA binding protein ZBP1 can regulate growth cone filopodial length but not number (Welshhans and Bassell, 2011). It will be of interest to further determine how the mechanisms of filopodia formation differ between the growth cone and the axon shaft of sensory neurons.
Chicken sensory axons contain mRNA coding for cortactin and WAVE1, and NGF induces axonal protein synthesis-dependent increases in the levels of both proteins. In cultured hippocampal neurons, brain-derived neurotrophic factor (BDNF) increases axonal cortactin levels through the inactivation of calpain, which normally cleaves cortactin (Mingorance-Le Meur and O'Connor, 2009). Axonal protein synthesis-dependent growth cone guidance can also require protein degradation (Campbell and Holt, 2001), and the E3 ligase Nedd4 promotes retinal axon branching through degradation of PTEN (Drinjakovic et al., 2010), the phosphatase that antagonizes the activity of PI3K. Treatment with PI3Kpep resulted in a large increase in the axonal levels of WAVE1, relative to cortactin and Arp2. In addition to driving the axonal synthesis of WAVE1, PI3K may also negatively regulate mechanisms that control WAVE1 degradation thus resulting in a relatively strong increase in the levels of WAVE1.
This study indicates that NGF increases the levels of the Arp2 subunit of the Arp2/3 complex through the intra-axonal translation of Arp2 mRNA. Axonal mRNAs for five of the seven subunits of the Arp2/3 complex have been shown to be targeted to axons in mammalian embryonic sensory neurons (Gumy et al., 2011). We speculate that the axonal translation of the available complement of Arp2/3 complex subunit mRNAs may represent a “gating” mechanism for the availability of functional Arp2/3 complexes in the axon. In this model, a surplus of the subunits of the complex for which no axonal mRNAs are present could be delivered into axons by axonal transport, and would form functional complexes only when signals induce the axonal synthesis of the other subunits. This type of gating mechanism has been shown to be operative for injury-induced retrograde signaling mediated by importins (Hanz et al., 2003), which function as α-β dimers. Adult sensory axons contain α importin protein but minimal levels of β importin. Injury induces the intra-axonal synthesis of β importin resulting in the formation of α-β importin dimers and functional retrograde signaling. Future studies will be required to address whether the intra-axonal synthesis of additional Arp2/3 complex subunits serves to gate the availability of functional Arp2/3 complexes in axons.
Although the targeting of microtubules into axonal filopodia is a fundamental event in the formation of collateral branches, little is known about the underlying mechanisms (Gallo, 2011). Axonal microtubule tips undergo dynamic instability and this study revealed that NGF increases the number of actively polymerizing microtubule tips and the localization of microtubules in axonal filopodia. Similarly, BDNF increases the targeting of microtubules into dendritic filopodia and spines (Gu et al., 2008; Hu et al., 2011). mRNAs for tubulins and microtubule-associated proteins have been reported to target to sensory axons (Gumy et al., 2011). However, in contrast to the regulation of the actin cytoskeleton by NGF, the regulation of microtubule levels in axons and the localization of microtubules to axonal filopodia by NGF is independent of protein synthesis.
A role for axonal protein synthesis in axon branching was hypothesized by Alvarez et al. (2000). This study reveals that DRG axons translate mRNAs in the living spinal cord, and that the NGF-induced formation of axonal filopodia and collateral branches involves both canonical signaling mechanisms (e.g., Rac1 activation) and intra-axonal protein synthesis. The PI3K pathway is upstream of both the activation of Rac1 and axonal protein synthesis. We suggest that through this multipronged mechanism NGF-induced axonal PI3K activity acts to increase the formation of actin patches along axons, which in turn require the upregulation of the levels of molecular components required for proper function of Arp2/3-dependent actin patches (Fig. 10). Whether this matching scheme represents a general scheme for the role of intra-axonal protein synthesis will have to be addressed by future studies.
Footnotes
This work was supported by Grants NIH NS048090 (G.G.) and NIH R01-NS041596 (J.L.T.). We thank Dr. M. Wilson (ECM Biosciences) for the generous gifts of Arp2 and WAVE1 antibodies. Aspects of this work were performed at Drexel University College of Medicine, Department of Neurobiology and Anatomy.
References
- Aakalu G, Smith WB, Nguyen N, Jiang C, Schuman EM. Dynamic visualization of local protein synthesis in hippocampal neurons. Neuron. 2001;30:489–502. doi: 10.1016/s0896-6273(01)00295-1. [DOI] [PubMed] [Google Scholar]
- Ahuja R, Pinyol R, Reichenbach N, Custer L, Klingensmith J, Kessels MM, Qualmann B. Cordon-bleu is an actin nucleation factor and controls neuronal morphology. Cell. 2007;131:337–350. doi: 10.1016/j.cell.2007.08.030. [DOI] [PMC free article] [PubMed] [Google Scholar]
- Alvarez J, Giuditta A, Koenig E. Protein synthesis in axons and terminals: significance for maintenance, plasticity and regulation of phenotype. With a critique of slow transport theory. Prog Neurobiol. 2000;62:1–62. doi: 10.1016/s0301-0082(99)00062-3. [DOI] [PubMed] [Google Scholar]
- Andersen EF, Asuri NS, Halloran MC. In vivo imaging of cell behaviors and F-actin reveals LIM-HD transcription factor regulation of peripheral versus central sensory axon development. Neural Dev. 2011;6:27. doi: 10.1186/1749-8104-6-27. [DOI] [PMC free article] [PubMed] [Google Scholar]
- Antar LN, Li C, Zhang H, Carroll RC, Bassell GJ. Local functions for FMRP in axon growth cone motility and activity-dependent regulation of filopodia and spine synapses. Mol Cell Neurosci. 2006;32:37–48. doi: 10.1016/j.mcn.2006.02.001. [DOI] [PubMed] [Google Scholar]
- Brittis PA, Lu Q, Flanagan JG. Axonal protein synthesis provides a mechanism for localized regulation at an intermediate target. Cell. 2002;110:223–235. doi: 10.1016/s0092-8674(02)00813-9. [DOI] [PubMed] [Google Scholar]
- Brown MD, Cornejo BJ, Kuhn TB, Bamburg JR. Cdc42 stimulates neurite outgrowth and formation of growth cone filopodia and lamellipodia. J Neurobiol. 2000;43:352–364. doi: 10.1002/1097-4695(20000615)43:4<352::aid-neu4>3.0.co;2-t. [DOI] [PubMed] [Google Scholar]
- Buckmaster PS, Lew FH. Rapamycin suppresses mossy fiber sprouting but not seizure frequency in a mouse model of temporal lobe epilepsy. J Neurosci. 2011;31:2337–2347. doi: 10.1523/JNEUROSCI.4852-10.2011. [DOI] [PMC free article] [PubMed] [Google Scholar]
- Buckmaster PS, Wen X. Rapamycin suppresses axon sprouting by somatostatin interneurons in a mouse model of temporal lobe epilepsy. Epilepsia. 2011;52:2057–2064. doi: 10.1111/j.1528-1167.2011.03253.x. [DOI] [PMC free article] [PubMed] [Google Scholar]
- Campbell DS, Holt CE. Chemotropic responses of retinal growth cones mediated by rapid local protein synthesis and degradation. Neuron. 2001;32:1013–1026. doi: 10.1016/s0896-6273(01)00551-7. [DOI] [PubMed] [Google Scholar]
- Chadborn NH, Ahmed AI, Holt MR, Prinjha R, Dunn GA, Jones GE, Eickholt BJ. PTEN couples Sema3A signalling to growth cone collapse. J Cell Sci. 2006;119:951–957. doi: 10.1242/jcs.02801. [DOI] [PubMed] [Google Scholar]
- Chen TJ, Gehler S, Shaw AE, Bamburg JR, Letourneau PC. Cdc42 participates in the regulation of ADF/cofilin and retinal growth cone filopodia by brain derived neurotrophic factor. J Neurobiol. 2006;66:103–114. doi: 10.1002/neu.20204. [DOI] [PubMed] [Google Scholar]
- Cheng Y, Leung S, Mangoura D. Transient suppression of cortactin ectopically induces large telencephalic neurons towards a GABAergic phenotype. J Cell Sci. 2000;113:3161–3172. doi: 10.1242/jcs.113.18.3161. [DOI] [PubMed] [Google Scholar]
- Cox LJ, Hengst U, Gurskaya NG, Lukyanov KA, Jaffrey SR. Intra-axonal translation and retrograde trafficking of CREB promotes neuronal survival. Nat Cell Biol. 2008;10:149–159. doi: 10.1038/ncb1677. [DOI] [PMC free article] [PubMed] [Google Scholar]
- Derivery E, Gautreau A. Generation of branched actin networks: assembly and regulation of the N-WASP and WAVE molecular machines. Bioessays. 2010;32:119–131. doi: 10.1002/bies.200900123. [DOI] [PubMed] [Google Scholar]
- Donnelly CJ, Fainzilber M, Twiss JL. Subcellular communication through RNA transport and localized protein synthesis. Traffic. 2010;11:1498–1505. doi: 10.1111/j.1600-0854.2010.01118.x. [DOI] [PMC free article] [PubMed] [Google Scholar]
- Donnelly CJ, Willis DE, Xu M, Tep C, Jiang C, Yoo S, Schanen NC, Kirn-Safran CB, van Minnen J, English A, Yoon SO, Bassell GJ, Twiss JL. Limited availability of ZBP1 restricts axonal mRNA localization and nerve regeneration capacity. EMBO J. 2011;30:4665–4677. doi: 10.1038/emboj.2011.347. [DOI] [PMC free article] [PubMed] [Google Scholar]
- Drinjakovic J, Jung H, Campbell DS, Strochlic L, Dwivedy A, Holt CE. E3 ligase Nedd4 promotes axon branching by downregulating PTEN. Neuron. 2010;65:341–357. doi: 10.1016/j.neuron.2010.01.017. [DOI] [PMC free article] [PubMed] [Google Scholar]
- Gallo G. Making proteins into drugs: assisted delivery of proteins and peptides into living neurons. Methods Cell Biol. 2003;71:325–338. doi: 10.1016/s0091-679x(03)01015-x. [DOI] [PubMed] [Google Scholar]
- Gallo G. RhoA-kinase coordinates F-actin organization and myosin II activity during semaphorin-3A-induced axon retraction. J Cell Sci. 2006;119:3413–3423. doi: 10.1242/jcs.03084. [DOI] [PMC free article] [PubMed] [Google Scholar]
- Gallo G. Semaphorin 3A inhibits ERM protein phosphorylation in growth cone filopodia through inactivation of PI3K. Dev Neurobiol. 2008;68:926–933. doi: 10.1002/dneu.20631. [DOI] [PubMed] [Google Scholar]
- Gallo G. The cytoskeletal and signaling mechanisms of axon collateral branching. Dev Neurobiol. 2011;71:201–220. doi: 10.1002/dneu.20852. [DOI] [PubMed] [Google Scholar]
- Gallo G, Letourneau PC. Different contributions of microtubule dynamics and transport to the growth of axons and collateral sprouts. J Neurosci. 1999;19:3860–3873. doi: 10.1523/JNEUROSCI.19-10-03860.1999. [DOI] [PMC free article] [PubMed] [Google Scholar]
- Gibson DA, Ma L. Developmental regulation of axon branching in the vertebrate nervous system. Development. 2011;138:183–195. doi: 10.1242/dev.046441. [DOI] [PMC free article] [PubMed] [Google Scholar]
- Grider MH, Park D, Spencer DM, Shine HD. Lipid raft-targeted Akt promotes axonal branching and growth cone expansion via mTOR and Rac1, respectively. J Neurosci Res. 2009;87:3033–3042. doi: 10.1002/jnr.22140. 2009 Nov 1. [DOI] [PMC free article] [PubMed] [Google Scholar]
- Gu J, Firestein BL, Zheng JQ. Microtubules in dendritic spine development. J Neurosci. 2008;28:12120–12124. doi: 10.1523/JNEUROSCI.2509-08.2008. [DOI] [PMC free article] [PubMed] [Google Scholar]
- Gumy LF, Yeo GS, Tung YC, Zivraj KH, Willis D, Coppola G, Lam BY, Twiss JL, Holt CE, Fawcett JW. Transcriptome analysis of embryonic and adult sensory axons reveals changes in mRNA repertoire localization. RNA. 2011;17:85–98. doi: 10.1261/rna.2386111. [DOI] [PMC free article] [PubMed] [Google Scholar]
- Hanz S, Perlson E, Willis D, Zheng JQ, Massarwa R, Huerta JJ, Koltzenburg M, Kohler M, van-Minnen J, Twiss JL, Fainzilber M. Axoplasmic importins enable retrograde injury signaling in lesioned nerve. Neuron. 2003;40:1095–1104. doi: 10.1016/s0896-6273(03)00770-0. [DOI] [PubMed] [Google Scholar]
- Harris WA, Holt CE, Bonhoeffer F. Retinal axons with and without their somata, growing to and arborizing in the tectum of Xenopus embryos: a time-lapse video study of single fibres in vivo. Development. 1987;101:123–133. doi: 10.1242/dev.101.1.123. [DOI] [PubMed] [Google Scholar]
- Hu X, Ballo L, Pietila L, Viesselmann C, Ballweg J, Lumbard D, Stevenson M, Merriam E, Dent EW. BDNF-induced increase of PSD-95 in dendritic spines requires dynamic microtubule invasions. J Neurosci. 2011;31:15597–15603. doi: 10.1523/JNEUROSCI.2445-11.2011. [DOI] [PMC free article] [PubMed] [Google Scholar]
- Jones SL, Selzer ME, Gallo G. Developmental regulation of sensory axon regeneration in the absence of growth cones. J Neurobiol. 2006;66:1630–1645. doi: 10.1002/neu.20309. [DOI] [PMC free article] [PubMed] [Google Scholar]
- Jung H, Holt CE. Local translation of mRNAs in neural development. Wiley Interdiscip Rev RNA. 2011;2:153–165. doi: 10.1002/wrna.53. [DOI] [PMC free article] [PubMed] [Google Scholar]
- Ketschek A, Gallo G. Nerve growth factor induces axonal filopodia through localized microdomains of phosphoinositide 3-kinase activity that drive the formation of cytoskeletal precursors to filopodia. J Neurosci. 2010;30:12185–12197. doi: 10.1523/JNEUROSCI.1740-10.2010. [DOI] [PMC free article] [PubMed] [Google Scholar]
- Kuhn TB, Brown MD, Bamburg JR. Rac1-dependent actin filament organization in growth cones is necessary for beta1-integrin-mediated advance but not for growth on poly-D-lysine. J Neurobiol. 1998;37:524–540. doi: 10.1002/(sici)1097-4695(199812)37:4<524::aid-neu3>3.0.co;2-h. [DOI] [PubMed] [Google Scholar]
- Lee SK, Hollenbeck PJ. Organization and translation of mRNA in sympathetic axons. J Cell Sci. 2003;116:4467–4478. doi: 10.1242/jcs.00745. [DOI] [PubMed] [Google Scholar]
- Leemhuis J, Bouché E, Frotscher M, Henle F, Hein L, Herz J, Meyer DK, Pichler M, Roth G, Schwan C, Bock HH. Reelin signals through apolipoprotein E receptor 2 and Cdc42 to increase growth cone motility and filopodia formation. J Neurosci. 2010;30:14759–14772. doi: 10.1523/JNEUROSCI.4036-10.2010. [DOI] [PMC free article] [PubMed] [Google Scholar]
- Lelkes PI, Unsworth BR, Saporta S, Cameron DF, Gallo G. Culture of neuroendocrine and neuronal cells for tissue engineering. In: Vunjak-Novakovic G., Freshney R.I., editors. Culture of cells for tissue engineering, Chap 14. Wiley-Liss; 2006. [Google Scholar]
- Li PP, Chen C, Lee CW, Madhavan R, Peng HB. Axonal filopodial asymmetry induced by synaptic target. Mol Biol Cell. 2011;22:2480–2490. doi: 10.1091/mbc.E11-03-0198. [DOI] [PMC free article] [PubMed] [Google Scholar]
- Lin AC, Holt CE. Local translation and directional steering in axons. EMBO J. 2007;26:3729–3736. doi: 10.1038/sj.emboj.7601808. [DOI] [PMC free article] [PubMed] [Google Scholar]
- Loudon RP, Silver LD, Yee HF, Jr, Gallo G. RhoA-kinase and myosin II are required for the maintenance of growth cone polarity and guidance by nerve growth factor. J Neurobiol. 2006;66:847–867. doi: 10.1002/neu.20258. [DOI] [PMC free article] [PubMed] [Google Scholar]
- Marsick BM, San Miguel-Ruiz JE, Letourneau PC. Activation of ezrin/radixin/moesin mediates attractive growth cone guidance through regulation of growth cone actin and adhesion receptors. J Neurosci. 2012;32:282–296. doi: 10.1523/JNEUROSCI.4794-11.2012. 2012 Jan 4. [DOI] [PMC free article] [PubMed] [Google Scholar]
- Martelli AM, Evangelisti C, Chappell W, Abrams SL, Bäsecke J, Stivala F, Donia M, Fagone P, Nicoletti F, Libra M, Ruvolo V, Ruvolo P, Kempf CR, Steelman LS, McCubrey JA. Targeting the translational apparatus to improve leukemia therapy: roles of the PI3K/PTEN/Akt/mTOR pathway. Leukemia. 2011;25:1064–1079. doi: 10.1038/leu.2011.46. [DOI] [PubMed] [Google Scholar]
- Meberg PJ, Bamburg JR. Increase in neurite outgrowth mediated by overexpression of actin depolymerizing factor. J Neurosci. 2000;20:2459–2469. doi: 10.1523/JNEUROSCI.20-07-02459.2000. [DOI] [PMC free article] [PubMed] [Google Scholar]
- Mendelson B, Koerber HR, Frank E. Development of cutaneous and proprioceptive afferent projections in the chick spinal cord. Neurosci Lett. 1992;138:72–76. doi: 10.1016/0304-3940(92)90475-m. [DOI] [PubMed] [Google Scholar]
- Mingorance-Le Meur A, O'Connor TP. Neurite consolidation is an active process requiring constant repression of protrusive activity. EMBO J. 2009;28:248–260. doi: 10.1038/emboj.2008.265. [DOI] [PMC free article] [PubMed] [Google Scholar]
- Olink-Coux M, Hollenbeck PJ. Localization and active transport of mRNA in axons of sympathetic neurons in culture. J Neurosci. 1996;16:1346–1358. doi: 10.1523/JNEUROSCI.16-04-01346.1996. [DOI] [PMC free article] [PubMed] [Google Scholar]
- Pan J, Kao YL, Joshi S, Jeetendran S, Dipette D, Singh US. Activation of Rac1 by phosphatidylinositol 3-kinase in vivo: role in activation of mitogen-activated protein kinase (MAPK) pathways and retinoic acid-induced neuronal differentiation of SH-SY5Y cells. J Neurochem. 2005;93:571–583. doi: 10.1111/j.1471-4159.2005.03106.x. [DOI] [PubMed] [Google Scholar]
- Pan L, Zhang YQ, Woodruff E, Broadie K. The Drosophila fragile X gene negatively regulates neuronal elaboration and synaptic differentiation. Curr Biol. 2004;14:1863–1870. doi: 10.1016/j.cub.2004.09.085. [DOI] [PubMed] [Google Scholar]
- Park HS, Lee SH, Park D, Lee JS, Ryu SH, Lee WJ, Rhee SG, Bae YS. Sequential activation of phosphatidylinositol 3-kinase, beta Pix, Rac1, and Nox1 in growth factor-induced production of H2O2. Mol Cell Biol. 2004;24:4384–4394. doi: 10.1128/MCB.24.10.4384-4394.2004. [DOI] [PMC free article] [PubMed] [Google Scholar]
- Petruska JC, Mendell LM. The many functions of nerve growth factor: multiple actions on nociceptors. Neurosci Lett. 2004;361:168–171. doi: 10.1016/j.neulet.2003.12.012. [DOI] [PubMed] [Google Scholar]
- Qian Y, Zhong X, Flynn DC, Zheng JZ, Qiao M, Wu C, Dedhar S, Shi X, Jiang BH. ILK mediates actin filament rearrangements and cell migration and invasion through PI3K/Akt/Rac1 signaling. Oncogene. 2005;24:3154–3165. doi: 10.1038/sj.onc.1208525. [DOI] [PubMed] [Google Scholar]
- Rajnicek AM, Foubister LE, McCaig CD. Growth cone steering by a physiological electric field requires dynamic microtubules, microfilaments and Rac-mediated filopodial asymmetry. J Cell Sci. 2006;119:1736–1745. doi: 10.1242/jcs.02897. [DOI] [PubMed] [Google Scholar]
- Ren G, Crampton MS, Yap AS. Cortactin: coordinating adhesion and the actin cytoskeleton at cellular protrusions. Cell Motil Cytoskeleton. 2009;66:865–873. doi: 10.1002/cm.20380. [DOI] [PubMed] [Google Scholar]
- Ridley AJ. Rho GTPases and actin dynamics in membrane protrusions and vesicle trafficking. Trends Cell Biol. 2006;16:522–529. doi: 10.1016/j.tcb.2006.08.006. [DOI] [PubMed] [Google Scholar]
- Roche FK, Marsick BM, Letourneau PC. Protein synthesis in distal axons is not required for growth cone responses to guidance cues. J Neurosci. 2009;29:638–652. doi: 10.1523/JNEUROSCI.3845-08.2009. [DOI] [PMC free article] [PubMed] [Google Scholar]
- Spillane M, Ketschek A, Jones SL, Korobova F, Marsick B, Lanier L, Svitkina T, Gallo G. The actin nucleating Arp2/3 complex contributes to the formation of axonal filopodia and branches through the regulation of actin patch precursors to filopodia. Dev Neurobiol. 2011;71:747–758. doi: 10.1002/dneu.20907. [DOI] [PMC free article] [PubMed] [Google Scholar]
- Strasser GA, Rahim NA, VanderWaal KE, Gertler FB, Lanier LM. Arp2/3 is a negative regulator of growth cone translocation. Neuron. 2004;43:81–94. doi: 10.1016/j.neuron.2004.05.015. [DOI] [PubMed] [Google Scholar]
- Tang MC, Chan LC, Yeh YC, Chen CY, Chou TY, Wang WS, Su Y. Thymosin beta 4 induces colon cancer cell migration and clinical metastasis via enhancing ILK/IQGAP1/Rac1 signal transduction pathway. Cancer Lett. 2011;308:162–171. doi: 10.1016/j.canlet.2011.05.001. [DOI] [PubMed] [Google Scholar]
- Teeter CM, Stevens CF. A general principle of neural arbor branch density. Curr Biol. 2011;21:2105–2108. doi: 10.1016/j.cub.2011.11.013. [DOI] [PubMed] [Google Scholar]
- Thies E, Davenport RW. Independent roles of Rho-GTPases in growth cone and axonal behavior. J Neurobiol. 2003;54:358–369. doi: 10.1002/neu.10135. 2003 Feb 5. [DOI] [PubMed] [Google Scholar]
- Tucker B, Richards RI, Lardelli M. Contribution of mGluR and Fmr1 functional pathways to neurite morphogenesis, craniofacial development and fragile X syndrome. Hum Mol Genet. 2006;15:3446–3458. doi: 10.1093/hmg/ddl422. [DOI] [PubMed] [Google Scholar]
- Verma P, Chierzi S, Codd AM, Campbell DS, Meyer RL, Holt CE, Fawcett JW. Axonal protein synthesis and degradation are necessary for efficient growth cone regeneration. J Neurosci. 2005;25:331–342. doi: 10.1523/JNEUROSCI.3073-04.2005. 2005 Jan 12. [DOI] [PMC free article] [PubMed] [Google Scholar]
- Vuppalanchi D, Coleman J, Yoo S, Merianda TT, Yadhati AG, Hossain J, Blesch A, Willis DE, Twiss JL. Conserved 3′-untranslated region sequences direct subcellular localization of chaperone protein mRNAs in neurons. J Biol Chem. 2010;285:18025–18038. doi: 10.1074/jbc.M109.061333. [DOI] [PMC free article] [PubMed] [Google Scholar]
- Welshhans K, Bassell GJ. Netrin-1-induced local β-actin synthesis and growth cone guidance requires zipcode binding protein 1. J Neurosci. 2011;31:9800–9813. doi: 10.1523/JNEUROSCI.0166-11.2011. [DOI] [PMC free article] [PubMed] [Google Scholar]
- Williams EJ, Doherty P. Evidence for and against a pivotal role of PI 3-kinase in a neuronal cell survival pathway. Mol Cell Neurosci. 1999;13:272–280. doi: 10.1006/mcne.1999.0750. [DOI] [PubMed] [Google Scholar]
- Willis DE, van Niekerk EA, Sasaki Y, Mesngon M, Merianda TT, Williams GG, Kendall M, Smith DS, Bassell GJ, Twiss JL. Extracellular stimuli specifically regulate localized levels of individual neuronal mRNAs. J Cell Biol. 2007;178:965–980. doi: 10.1083/jcb.200703209. [DOI] [PMC free article] [PubMed] [Google Scholar]
- Willis DE, Xu M, Donnelly CJ, Tep C, Kendall M, Erenstheyn M, English AW, Schanen NC, Kirn-Safran CB, Yoon SO, Bassell GJ, Twiss JL. Axonal Localization of transgene mRNA in mature PNS and CNS neurons. J Neurosci. 2011;31:14481–14487. doi: 10.1523/JNEUROSCI.2950-11.2011. [DOI] [PMC free article] [PubMed] [Google Scholar]
- Willis D, Li KW, Zheng JQ, Chang JH, Smit A, Kelly T, Merianda TT, Sylvester J, van Minnen J, Twiss JL. Differential transport and local translation of cytoskeletal, injury-response, and neurodegeneration protein mRNAs in axons. J Neurosci. 2005;25:778–791. doi: 10.1523/JNEUROSCI.4235-04.2005. [DOI] [PMC free article] [PubMed] [Google Scholar]
- Yang C, Svitkina T. Filopodia initiation: focus on the Arp2/3 complex and formins. Cell Adh Migr. 2011;5:402–408. doi: 10.4161/cam.5.5.16971. [DOI] [PMC free article] [PubMed] [Google Scholar]
- Yao J, Sasaki Y, Wen Z, Bassell GJ, Zheng JQ. An essential role for beta-actin mRNA localization and translation in Ca2+-dependent growth cone guidance. Nat Neurosci. 2006;9:1265–1273. doi: 10.1038/nn1773. [DOI] [PubMed] [Google Scholar]
- Yoo S, van Niekerk EA, Merianda TT, Twiss JL. Dynamics of axonal mRNA transport and implications for peripheral nerve regeneration. Exp Neurol. 2010;223:19–27. doi: 10.1016/j.expneurol.2009.08.011. [DOI] [PMC free article] [PubMed] [Google Scholar]
- Yudin D, Hanz S, Yoo S, Iavnilovitch E, Willis D, Gradus T, Vuppalanchi D, Segal-Ruder Y, Ben-Yaakov K, Hieda M, Yoneda Y, Twiss JL, Fainzilber M. Localized regulation of axonal RanGTPase controls retrograde injury signaling in peripheral nerve. Neuron. 2008;59:241–252. doi: 10.1016/j.neuron.2008.05.029. [DOI] [PMC free article] [PubMed] [Google Scholar]
- Zhang HL, Eom T, Oleynikov Y, Shenoy SM, Liebelt DA, Dictenberg JB, Singer RH, Bassell GJ. Neurotrophin-induced transport of a beta-actin mRNP complex increases beta-actin levels and stimulates growth cone motility. Neuron. 2001;31:261–275. doi: 10.1016/s0896-6273(01)00357-9. [DOI] [PubMed] [Google Scholar]
- Zheng JQ, Kelly TK, Chang B, Ryazantsev S, Rajasekaran AK, Martin KC, Twiss JL. A functional role for intra-axonal protein synthesis during axonal regeneration from adult sensory neurons. J Neurosci. 2001;21:9291–9303. doi: 10.1523/JNEUROSCI.21-23-09291.2001. [DOI] [PMC free article] [PubMed] [Google Scholar]
- Zivraj KH, Tung YC, Piper M, Gumy L, Fawcett JW, Yeo GS, Holt CE. Subcellular profiling reveals distinct and developmentally regulated repertoire of growth cone mRNAs. J Neurosci. 2010;30:15464–15478. doi: 10.1523/JNEUROSCI.1800-10.2010. [DOI] [PMC free article] [PubMed] [Google Scholar]