Abstract
Background
Little is known about the medical care resources devoted to diagnosing and treating cancer-related symptoms prior to a definitive cancer diagnosis. Previous research using SEER-Medicare data to measure incremental costs and utilization associated with cancer started with the date of diagnosis. We hypothesized that health care use increases prior to diagnosis of a new primary cancer.
Methods
We used a longitudinal case-control design to estimate incremental medical care utilization rates. Cases were 121,293 persons enrolled between January, 2000 and December, 2008 with one or more primary cancers. We selected 522,839 controls randomly from among all health plan members who had no tumor registry evidence of cancer prior to January, 2009, and we frequency matched controls to cancer cases on a five-to-one ratio by age group, gender, and having health plan eligibility in the year of diagnosis of the index cancer case. Utilization data were extracted for all cases and controls for the period 2000-2008 from standardized distributed data warehouses. To determine when and the extent to which patterns of medical care use change preceding a cancer diagnosis, we compute hospitalization rates, hospital days, emergency department visits, same-day surgical procedures, ambulatory medical office visits, imaging procedures, laboratory tests, and ambulatory prescription dispensings per 1,000 persons per month within integrated delivery systems.
Results
One- to three-fold increases in monthly utilization rates were observed during the three to five months prior to a cancer diagnosis, compared to matched non-cancer control groups. This pattern was consistent for both aged and non-aged cancer patients. Aged cancer patients had higher utilization rates than non-aged cancer patients throughout the year prior to a cancer diagnosis.
Conclusion
The pre-diagnosis phase is a resource-intensive component of cancer care episodes and should be included in cost of cancer estimates. More research is needed to determine whether reliable prognostic markers can be identified as the start of a cancer episode prior to a pathology-based diagnosis.
Keywords: Cancer, medical care use, utilization, phase of care, hospital discharges, inpatient days, emergency department visits, same-day surgery, ambulatory visits, dispensings, imaging procedures, laboratory tests
INTRODUCTION
While many cancers are detected early through screening or as a byproduct of an unrelated medical or surgical procedure, significant numbers of cases are diagnosed as a result of a search for an underlying cause. Little is known, however, about the medical care resources devoted to diagnosing and treating cancer-related symptoms prior to a definitive cancer diagnosis. Previous research using SEER-Medicare data to measure incremental costs and utilization associated with cancer started with the date of diagnosis.(1-4) We hypothesized that health care use increases prior to diagnosis of a new primary cancer for these reasons: 1) Signs and symptoms may motivate patients to seek symptom alleviation and diagnosis of the underlying disease, which ultimately is discovered to be cancer or, alternatively, an indolent tumor is diagnosed because the physician was searching for something else; 2) Misdiagnosis that leads to a diagnostic work-up, selection of an incorrect diagnosis, a treatment attempt, treatment failure, re-diagnosis, and so on, until the cancer is found; 3) Patients seek alleviation of symptoms, but do not elect to pursue the path of confirming a cancer diagnosis, leading to a delayed diagnosis; 4) The primary focus of diagnosis and treatment may mask a cancer and delay diagnosis; 5) Delay in assigning a cancer diagnosis due to existential factors of everyday life may cause delays of weeks or months while the diagnostic evidence is accrued; and, 6) Older patients are more likely to have multiple chronic diseases that may mask cancer symptoms, leading to a longer and more service-intensive pattern of utilization leading up to their cancer diagnoses.
To test these hypotheses, we accessed the informatics resources of the Cancer Research Network (CRN), a consortium of group-model HMOs with comprehensive administrative and electronic medical record information for the populations they serve. The CRN represents a highly suitable laboratory for this research as a result of the defined, stable populations of cancer patients. This study uses a case-control design and data from four CRN health plans over a nine-year period (2000-2008). We used these data to estimate the incremental medical care use among adult cancer patients, relative to cancer-free persons, aged 18 and older, for the pre-diagnosis phase of care. We define this period as the 12 months prior to the month of cancer diagnosis. Measures of utilization included inpatient stays and days of care, ambulatory doctor office visits, emergency department visits, same-day surgical procedures, medication dispensings, imaging procedures, and laboratory tests.
METHODS
Research Setting
This research was conducted within four non-profit integrated health care systems that are members of the CRN: Group Health Cooperative (based in Seattle, WA); the Henry Ford Health System (based in Detroit, MI); and the Northwest (based in Portland, OR) and Colorado regions of Kaiser Permanente (based in Denver, CO). Each of these systems provides comprehensive health care to defined populations through closed-panel delivery models with salaried physicians. These systems also have tumor registries and integrated electronic medical record systems. Each organization provides private and public health insurance coverage, including Medicare Advantage and Medicaid risk contracts, resulting in diverse enrollments that generally represent their local communities.(5, 6) The Institutional Review Boards of the four participating organizations approved this project.
Research Design and Study Population
We employed a longitudinal case-control design to calculate the incremental medical care resource used to diagnose cancer. We defined cases as those patients enrolled in one of the four participating health plans between January 1, 2000 and December 31, 2008 with evidence of one or more primary tumors. These patients had at least 30 days of continuous health plan eligibility during this nine-year period. We excluded utilization data on individuals whose cancers were diagnosed prior to their 18th birthdays, but included their data from their 18th birthdays onward. We randomly selected control patients from health plan members with no evidence of cancer prior to January 1, 2009. Controls were frequency matched on a five-to-one ratio to cases by age group, gender, and health plan eligibility. Pseudo-diagnosis dates were assigned to controls as the date of cancer diagnosis from their matched case. We defined four subgroups for the current analyses: cancer patients aged 65 years and older at time of cancer diagnosis; cancer patients aged less than 65 years at time of diagnosis; control patients aged 65 years and older as of the date of diagnosis for the matching cancer case; and control patients aged less than 65 years as of the date of diagnosis for the matching cancer case. Enrollment gaps of 95 days or less were presumed to be unintended administrative changes and were not considered when calculating continuous enrollment.
Data
Data on cancer diagnoses, including diagnosis date, were extracted from accredited tumor registries for January 1, 2000 through December 31, 2008. Data on health-plan eligibility were extracted from enrollment files. We extracted comprehensive utilization data for all study cases and controls for 2000-2008 from electronic data warehouses maintained by the participating organizations. These data warehouses compile information from EMRs, hospital discharge abstracts, claims, hospital, emergency room, same day surgical, and medical office ambulatory care encounters, and outpatient dispensings. All persons included in the samples had coverage of ambulatory prescription medications, including Medicare Advantage enrollees. We extracted race and ethnicity for cancer patients from tumor registries. For controls, this information was extracted from health plan enrollment files and hospital discharge abstracts. Data were standardized across plans according to specifications established by the CRN's Virtual Data Warehouse.(7)
Measures
We computed eight different monthly utilization rates: short-term hospital admissions, total inpatient days, emergency department encounters, same-day surgical procedures, ambulatory medical office encounters, outpatient imaging procedures, outpatient laboratory procedures, and outpatient medication dispensings. Hospital admissions and days were counted as of the date of admission, including stays over 31 days. Medication dispensings, including refills, were counted as of the fill date (regardless of the number of days supplied). We counted all other care receipt on the day it occurred.
Analysis
The month of cancer diagnosis was set as the index point for cases. We assigned a pseudo date to controls to allow us to track utilization rates over the months before and after the cancer diagnosis. In this analysis, we present data for the 12 months prior to the month of diagnosis recorded in tumor registries. The numbers of cases and controls varied somewhat across the months of the pre-diagnosis phase because of differences among patients in health plan eligibility relative to the timing of diagnosis.
To determine the statistical significance of the observed differences, we computed Chi-square tests on categorical variables and t-tests on the differences of means for monthly utilization rates between cancer cases and matched controls, and between aged and non-aged patients. We conducted analyses for the entire population of cases and controls.
RESULTS
We identified 121,293 cancer cases and 522,839 controls (Table 1). The average age of cancer patients was about 60.7 years, compared to 58.5 years for controls. Twenty-one percent (N = 24,966) of cancer patients were aged 75 years and older, compared to 17% of controls (N = 91,370).. The gender distributions between cancer cases and controls were similar: 57% (N = 69,106) of cancer patients were female, compared to 61% (N = 319,997) for controls. The differences in race/ethnicity distributions were a function of different data sources for each group—tumor registry versus health plan enrollment files. About 69% (N =76,527) of cancer cases were incident during the study period. The remaining 44,766 cases were prevalent at the beginning of the study period. Breast cancers accounted for 20% of the cases (N = 24,684), followed by prostate cancers (14% of cases, N = 16,648) and other female genital cancers at (12% of cases, N =14,619). Colorectal cancers accounted for 9% of the cases (N= 10,409), and lung cancers represented 8% of cases (N = 9,229).
Table 1.
Descriptive Statistics for Cancer Cases and Non-Cancer Controls
| Variable | Cases (n = 121,293) | Controls (n = 522,839) |
|---|---|---|
| Age at diagnosis | ||
| Mean age (years) ± Std. Dev. | 60.7 ± 16.0 | 58.5 ± 16.3 |
| Age group (%) | ||
| <55 years | 38,769 (32) | 200,054 (38) |
| 55-64 | 27,987 (23) | 125,699 (24) |
| 65-74 | 29,571 (24) | 105,266 (20) |
| 75+ | 24,966 (21) | 91,370 (17) |
| Race/ethnicity (%) | ||
| White | 100,764 (83) | 238,189 (46) |
| Black | 7,764 (6) | 26,209 (5) |
| Asian | 3,044 (3) | 9,936 (2) |
| Hispanic | 3,974 (3) | 10,906 (2) |
| Other race | 1,734 (1) | 6,399 (1) |
| Unknown race | 4,013 (3) | 231,200 (44) |
| Year of Cancer Diagnosis (%) | ||
| Prior to 2000 | 44,766 (37) | NA |
| 2000 | 8,613 (7) | NA |
| 2001 | 8,801 (7) | NA |
| 2002 | 8,800 (7) | NA |
| 2003 | 8,580 (7) | NA |
| 2004 | 8,453 (7) | NA |
| 2005 | 8,216 (7) | NA |
| 2006 | 8,355 (7) | NA |
| 2007 | 8,702 (7) | NA |
| 2008 | 8,007 (8) | NA |
| Cancer Site (%) | ||
| Breast | 24,684 (20) | NA |
| Prostate | 16,648 (14) | NA |
| Other female genitals | 14,619 (12) | NA |
| Skin | 10,734 (9) | NA |
| Colorectal | 10,409 (9) | NA |
| Lung | 9,229 (8) | NA |
| Urinary | 7,543 (6) | NA |
| Digestive | 5,744 (5) | NA |
| Hematopoietic, Reticuloendothelial | 5,242 (4) | NA |
| Lymph Nodes | 3,462 (3) | NA |
| All other cancers | (10) | NA |
| Gender (%) | ||
| Male | 52,187 (43) | 202,842 (39) |
| Female | 69,106 (57) | 319,997 (61) |
| Length of Enrollment Categories | ||
| < 13 months | 8,525 (7) | 54,383 (10) |
| 13-24 months | 9,023 (7) | 45,709 (9) |
| 25-36 months | 9,081 (7) | 41,971 (8) |
| 37-48 months | 9,114 (8) | 39,307 (8) |
| 49-60 months | 8,609 (7) | 35,441 (7) |
| 61-72 months | 8,132 (7) | 31,644 (6) |
| 73-84 months | 8,350 (7) | 32,767 (6) |
| 85-96 months | 8,420 (7) | 34,772 (7) |
| 97-108 months | 52,039 (43) | 206,845 (40) |
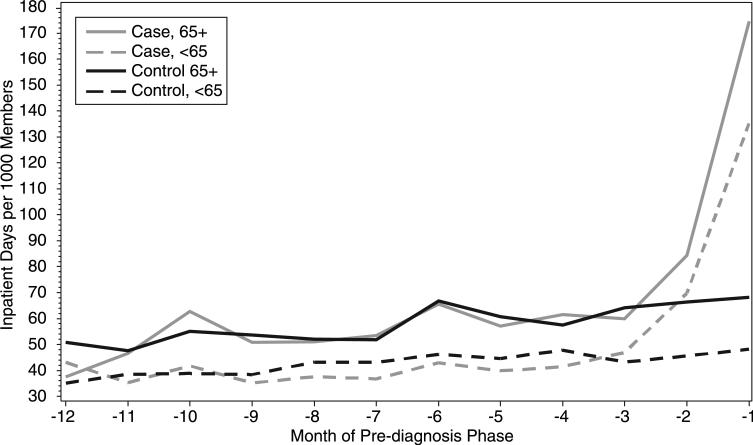
Hospital discharge rates prior to diagnosis for aged and non-aged cases were at the same levels as their respective controls at the beginning of the observation period—14 discharges per 1,000 members for aged patients and about 8 discharges per 1,000 members for non-aged patients (Figure 1a). During the fourth month prior to cancer diagnosis, however, discharge rates for aged cases increased dramatically when compared to aged controls (41 discharges per 1,000). This rate was two-fold higher than aged controls for the month prior to diagnosis. Discharge rates for non-aged cases rose sharply during the last three months of the observation period when compared to aged cases (20 discharges per 1,000 members), while rates for controls were unchanged across the year. Discharge rates for aged cases and controls were consistently higher than non-aged cases and controls, respectively. Rates of hospital days used per month and discharges followed similar patterns over the year (Figure 1b). During the month prior to diagnosis, aged cancer patients used 200 hospital days per 1,000 members (compared to 85/1,000 for aged controls) and non-aged cancer patients used 105 days per 1,000 (compared to 30/1,000 for non-aged controls).
Figure 1a.
Hospital Discharges per 1,000 Members by Month of Pre-Diagnosis Phase, by Age Group and Cancer Status, 2000-2008–All Cancers
Figure 1b.
Hospital Days per 1,000 Members by Month of Pre-Diagnosis Phase, by Age Group and Cancer Status, 2000-2008–All Cancers
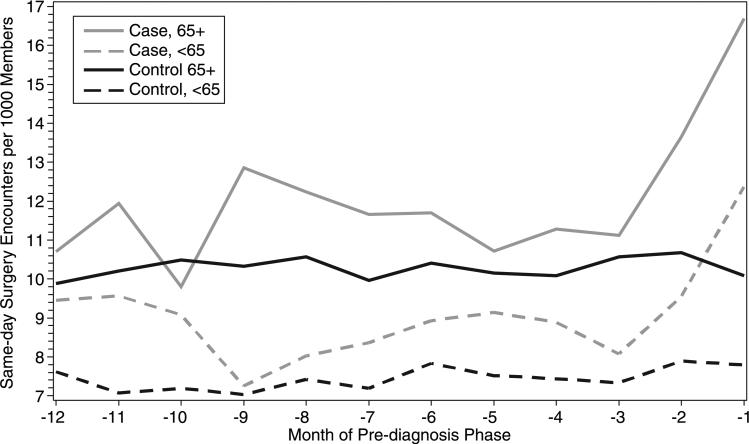
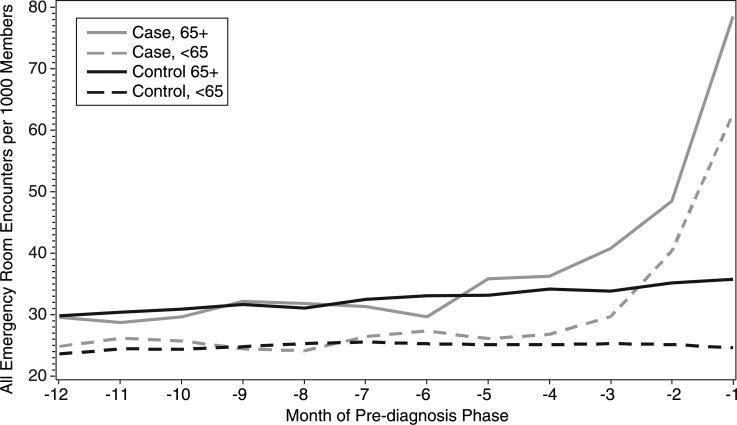
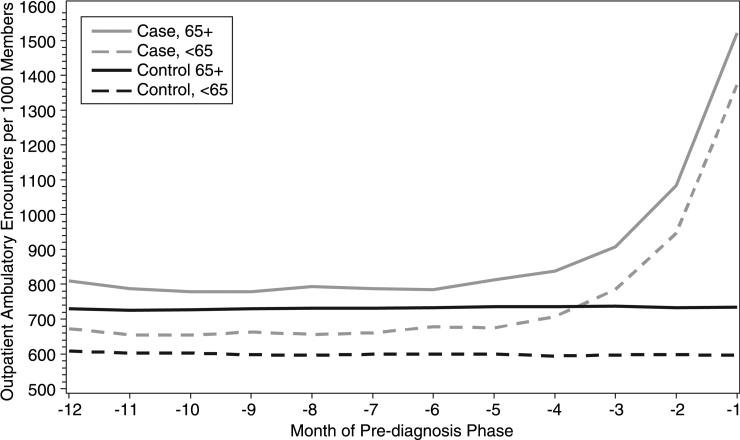
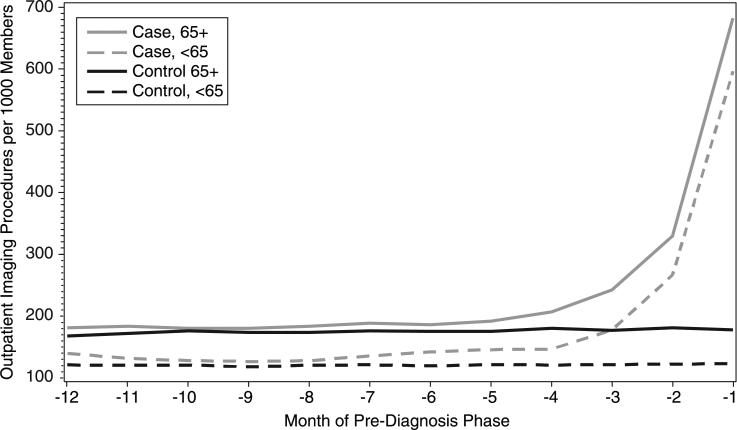
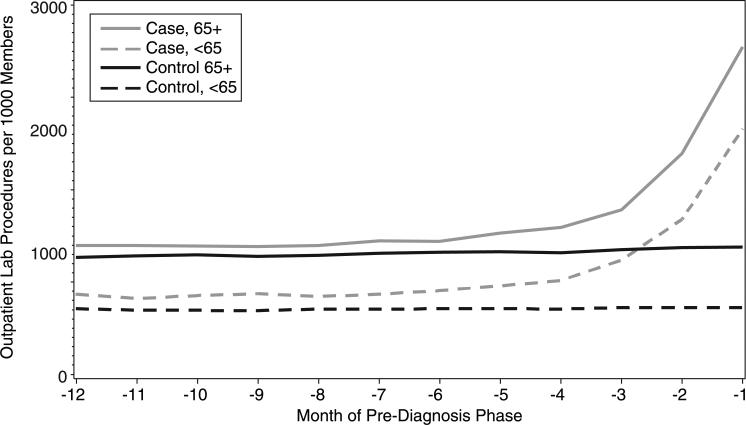
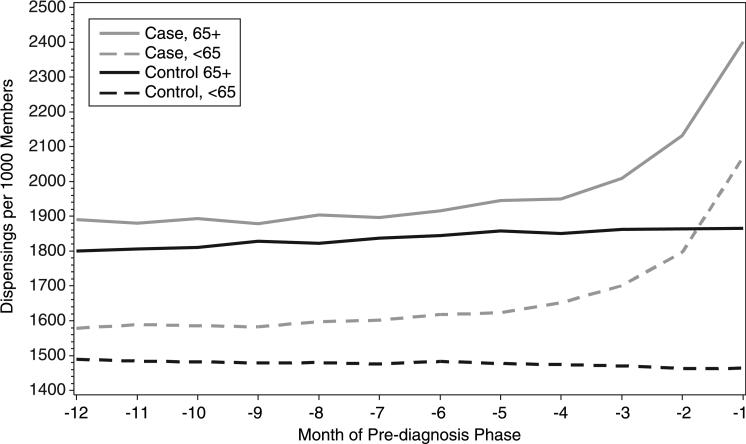
For aged cancer patients, emergency department visit rates for aged cancer patients were 78 visits per 1,000 members for the month before cancer diagnosis, compared to 38 visits per 1,000 members for aged controls, and 63 per 1,000 members vs. 24 per 1,000 members for non-aged cases and controls, respectively (Figure 1c). Same-day surgical procedure rates increased significantly during the three months prior to diagnosis for both aged and non-aged cancer cases, with rates for aged patients remaining consistently higher than non-aged patients (Figure 2a). Use of same-day surgical procedures by controls remained relatively constant throughout the year. Rates of medical office visits (Figure 2b), imaging procedures (Figure 2c), laboratory tests (Figure 3a), and prescription dispensing (Figure 3b) all climbed sharply for cases four to 12 months prior to diagnosis, compared to controls, and aged patients had consistently higher utilization rates than non-aged patients. (To view larger color versions of the above figures, see Supplemental Digital Content 1 (Figure 1a), Supplemental Digital Content 2 (Figure 1b), Supplemental Digital Content 3 (Figure 1c), Supplemental Digital Content 4 (Figure 2a), Supplemental Digital Content 5 (Figure 2b), Supplemental Digital Content 6 (Figure 2c), Supplemental Digital Content 7 (figure 3a), and Supplemental Digital Content 8 (figure 3b).)
Figure 1c.
Same-Day Surgery Procedures per 1,000 Members by Month of Pre-Diagnosis Phase, by Age Group and Cancer Status, 2000-2008–All Cancers
Figure 2a.
Emergency Room Visits per 1,000 Members by Month of Pre-Diagnosis Phase, by Age Group and Cancer Status, 2000-2008–All Cancers
Figure 2b.
Ambulatory Medical Office Visits per 1,000 Members by Month of Pre-Diagnosis Phase, by Age Group and Cancer Status, 2000-2008–All Cancers
Figure 2c.
Ambulatory Imaging Procedures per 1,000 Members by Month of Pre-Diagnosis Phase, by Age Group and Cancer Status, 2000-2008–All Cancers
Figure 3a.
Ambulatory Laboratory Procedures per 1,000 Members by Month of Pre-Diagnosis Phase, by Age Group and Cancer Status, 2000-2008–All Cancers
Figure 3b.
Ambulatory Prescription Dispensings per 1,000 Members by Month of Pre-Diagnosis Phase, by Age Group and Cancer Status, 2000-2008–All Cancers
All utilization differences for both aged and non-aged cases vs. controls were statistically significant for at least the two months prior to cancer diagnosis. Twelve of 16 differences were statistically significant during the third month prior to diagnosis. For ambulatory office visits, laboratory tests, and dispensings, cancer cases have significantly higher utilization rates than controls over the entire year prior to diagnosis. The differences in monthly mean utilization rates per 1,000 persons by service type and age group for the pre-diagnosis phase and their statistical significances are shown in Table 2.)
Table 2.
Monthly Incremental Cancer-related Utilization in Pre-Diagnosis Phase, All Cancers, 2000-2008*
| Month | -12 | -11 | -10 | -9 | -8 | -7 | -6 | -5 | -4 | -3 | -2 | -1 |
|---|---|---|---|---|---|---|---|---|---|---|---|---|
| Discharges/1000, Age <65 | 0.15 | 0.36 | 0.04 | -.59 | -.66 | -1.1 | -1.6 | -.81 | 0.43 | 1.35 | 6.16 | 13.5 |
| P | 0.81 | 0.58 | 0.95 | 0.36 | 0.31 | 0.09 | 0.01 | 0.20 | 0.52 | 0.05 | <.01 | <.01 |
| Discharges/1000, Age 65+ | -.77 | -.31 | -.38 | -.92 | -1.2 | 1.57 | 0.33 | -0.3 | 1.33 | 1.93 | 5.74 | 19.65 |
| P | 0.32 | 0.70 | 0.65 | 0.25 | 0.13 | 0.07 | 0.70 | 0.72 | 0.12 | 0.03 | <.01 | <.01 |
| Days/1000, Age <65 | 7.92 | -3.2 | 2.95 | -3.3 | -5.6 | -6.3 | -3.4 | -4.8 | -6.4 | 3.78 | 24.1 | 87 |
| P | 0.53 | 0.46 | 0.54 | 0.36 | 0.17 | 0.08 | 0.63 | 0.25 | 0.09 | 0.36 | <.01 | <.01 |
| Days/1000, Age 65+ | -13 | -0.9 | 7.61 | -2.9 | -1.1 | 1.64 | -1.1 | -3.5 | 4.02 | -4.3 | 17.8 | 106.4 |
| P | <.01 | 0.84 | 0.62 | 0.63 | 0.84 | 0.70 | 0.91 | 0.68 | 0.44 | 0.37 | <.01 | <.01 |
| ED Visits/1000, Age <65 | 1.24 | 1.71 | 1.37 | -0.35 | -1.2 | 0.88 | 2.07 | 0.95 | 1.7 | 4.41 | 15.2 | 38.2 |
| P | 0.33 | 0.22 | 0.29 | 0.78 | 0.32 | 0.50 | 0.10 | 0.45 | 0.17 | <.01 | <.01 | <.01 |
| ED Visits/1000, Age 65+ | -0.3 | -1.7 | -1.3 | 0.47 | 0.77 | -1.2 | -3.4 | 2.74 | 2.08 | 6.98 | 13.3 | 42.79 |
| P | 0.87 | 0.29 | 0.46 | 0.79 | 0.66 | 0.51 | <.04 | 0.13 | 0.24 | <.01 | <.01 | <.01 |
| Same Day Surgery/1000, Age <65 | 1.84 | 2.5 | 1.89 | 0.22 | 0.61 | 1.17 | 1.10 | 1.62 | 1.45 | 0.75 | 1.66 | 4.57 |
| P | <.02 | <.01 | <.01 | 0.74 | 0.36 | 0.07 | 0.12 | <.02 | <.04 | 0.24 | <.01 | <.01 |
| Same Day Surgery/1000, Age 65+ | 0.82 | 1.75 | -0.7 | 2.53 | 1.67 | 1.7 | 1.29 | 0.58 | 1.19 | 0.54 | 2.97 | 6.61 |
| P | 0.36 | 0.06 | 0.42 | <.01 | 0.07 | 0.07 | 0.18 | 0.49 | 0.17 | 0.53 | <.01 | <.01 |
| Office Visits/1000, Age <65 | 64.3 | 52.5 | 51.8 | 65.1 | 59.5 | 61.4 | 78 | 75 | 113 | 187 | 349 | 775 |
| P | <.01 | <.01 | <.01 | <.01 | <.01 | <.01 | <.01 | <.01 | <.01 | <.01 | <.01 | <.01 |
| Office Visits/1000, Age 65+ | 78.9 | 61.4 | 51.9 | 49.6 | 62.7 | 56.1 | 52.4 | 77 | 103 | 1701 | 351 | 787 |
| P | <.01 | <.01 | <.01 | <.01 | <.01 | <.01 | <.01 | <.01 | <.01 | <.01 | <.01 | <.01 |
| Imaging Procedures/1000, Age <65 | 19 | 11 | 7 | 8.8 | 7.4 | 15 | 23 | 24 | 26 | 57 | 145 | 478 |
| P | <.01 | <.01 | 0.06 | 0.02 | 0.09 | <.01 | <.01 | <.01 | <.01 | <.01 | <.01 | <.01 |
| Imaging Procedures/1000, Age ≥65 | 13.2 | 11.6 | 4.2 | 6.9 | 9.6 | 12.7 | 10.8 | 17.2 | 27 | 66 | 150 | 509 |
| P | <.01 | <.02 | 0.38 | 0.14 | 0.04 | <.01 | 0.03 | <.01 | <.01 | <.01 | <.01 | <.01 |
| Laboratory | 121 | 94 | 121 | 135 | 101 | 122 | 146 | 185 | 231 | 384 | 715 | 1445 |
| Procedures/1000, Age <65 | ||||||||||||
| P | <.01 | <.01 | <.01 | <.01 | <.01 | <.01 | <.01 | <.01 | <.01 | <.01 | <.01 | <.01 |
| Laboratory Procedures/1000, Age ≥65 | 95 | 84 | 72 | 79 | 79 | 100 | 88 | 152 | 205 | 322 | 762 | 1620 |
| P | <.01 | <.01 | 0.01 | <.01 | 0.01 | <.01 | <.01 | <.01 | <.01 | <.01 | <.01 | <.01 |
| Dispensings/1000, Age <65 | 89 | 105 | 104 | 104 | 118 | 126 | 134 | 146 | 178 | 230 | 335 | 605 |
| P | <.01 | <.01 | <.01 | <.01 | <.01 | <.01 | <.01 | <.01 | <.01 | <.01 | <.01 | <.01 |
| Dispensings/1000, Age 65+ | 91 | 74 | 83 | 50 | 81 | 60 | 71 | 87 | 100 | 147 | 268 | 535 |
| P | <.01 | 0.01 | <.01 | <.01 | <.01 | <.01 | <.01 | <.01 | <.01 | <.01 | <.01 | <.01 |
Differences in monthly means per 1,000 persons between cases and controls for aged and non-aged patients, respectively.
CONCLUSIONS AND FUTURE RESEARCH
This study confirmed our hypothesis that care utilization increases before a patient is diagnosed with cancer. We found that patients had multi-fold increases in use of inpatient, ambulatory, emergency department, imaging, laboratory, and pharmacy services during the months leading up to a cancer diagnosis, compared to a matched non-cancer control group, and this held true for both aged and non-aged cancer patients. These findings indicate that all cancer-related care does not start from the diagnosis date, and both cancer research and care should account for this fact.
In addition to confirming the surge in care use before diagnosis, this study also highlights areas in need of future research to further articulate this phenomenon. This research should address questions, such as:
What accounts for this ramp-up in utilization rates prior to diagnosis?
Why do patients age 65 years and older have such markedly higher utilization rates compared to patients under age 65?
What portion of this utilization is the result of delayed recognition of cancer?
What portion of this utilization is the result of rigorous accrual criteria for new primary tumors for cancer registries?
How much of this utilization is the result of patient and/or provider resistance to rapid diagnostic work-ups?
Answering these questions will help shape future research in this area and will illuminate our understanding of this important, yet understudied, phase of cancer care. In addition to issues of cost and utilization, the search for a cancer diagnosis is a complex, difficult, and frustrating experience for patients. As such, more research should examine whether this research could help shorten this period.
This Brief Report presents a preliminary view of a four-site, nine-year comprehensive database on cancer patients and frequency-matched controls. Future publications from this research team will address how medical care costs of cancer differ between HMOs and Medicare indemnity coverage, as well as whether cancers occurring before age 65 have continued costs effects after age 65.
Supplementary Material
Supplemental Digital Content 1. Figure 1a. Hospital Discharges per 1,000 Members by Month of Pre-Diagnosis Phase, by Age Group and Cancer Status, 2000-2008—All Cancers. eps
Supplemental Digital Content 2. Figure 1b. Hospital Days per 1,000 Members by Month of Pre-Diagnosis Phase, by Age Group and Cancer Status, 2000-2008—All Cancers. eps
Supplemental Digital Content 3. Figure 1c. Emergency Room Visits per 1,000 Members by Month of Pre-Diagnosis Phase, by Age Group and Cancer Status, 2000-2008—All Cancers. eps
Supplemental Digital Content 4. Figure 2a. Same-Day Surgery Procedures per 1,000 Members by Month of Pre-Diagnosis Phase, by Age Group and Cancer Status, 2000-2008—All Cancers. eps
Supplemental Digital Content 5. Figure 2b. Ambulatory Medical Office Visits per 1,000 Members by Month of Pre-Diagnosis Phase, by Age Group and Cancer Status, 2000-2008—All Cancers. eps
Supplemental Digital Content 6. Figure 2c. Ambulatory Imaging Procedures per 1,000 Members by Month of Pre-Diagnosis Phase, by Age Group and Cancer Status, 2000-2008—All Cancers. eps
Supplemental Digital Content 7. Figure 3a. Ambulatory Laboratory Procedures per 1,000 Members by Month of Pre-Diagnosis Phase, by Age Group and Cancer Status, 2000-2008—All Cancers. eps
Supplemental Digital Content 8. Figure 3b. Ambulatory Prescription Dispensings per 1,000 Members by Month of Pre-Diagnosis Phase, by Age Group and Cancer Status, 2000-2008—All Cancers. eps
Condensed Abstract.
Cancer cases had accelerating use of eight classes of medical care utilization during the year prior to cancer diagnosis compared to a matched non-cancer control group.
ACKNOWLEDGEMENTS
Data processing and analysis was supported by the following analysts: KP Northwest: Erin M. Keast, Erin E. Masterson, Donald J. Bachman, and Arthur Dixon; Group Health: Cristi Hanson; KP Colorado: Stephanie Latimer and Gwyn Saylor; Henry Ford Health System: Nonna Akkerman and Liz Dobie. Lisa Fox provided graphics arts support and Kevin Lutz provided editorial support.
Funding: This work was supported by the National Cancer Institute at the National Institutes of Health (grant numbers R01 CA114204 and R01 CA114204-03S1 to Mark C. Hornbrook PhD, RC2 CA148185 to Debra P. Ritzwoller PhD, and cooperative agreement number U19 CA79689 to Edward H. Wagner MD, MPH).
Footnotes
Financial Disclosures: The authors have no conflicts to disclose.
Publisher's Disclaimer: This is a PDF file of an unedited manuscript that has been accepted for publication. As a service to our customers we are providing this early version of the manuscript. The manuscript will undergo copyediting, typesetting, and review of the resulting proof before it is published in its final citable form. Please note that during the production process errors may be discovered which could affect the content, and all legal disclaimers that apply to the journal pertain.
REFERENCES
- 1.Mariotto AB, Yabroff KR, Shao Y, et al. Projections of the cost of cancer care in the United States: 2010-2020. J Natl Cancer Inst. 2011;103(2):117–128. doi: 10.1093/jnci/djq495. [DOI] [PMC free article] [PubMed] [Google Scholar]
- 2.Yabroff KR, Warren JL, Schrag D, et al. Comparison of approaches for estimating incidence costs of care for colorectal cancer patients. Med Care. 2009;47(7 Suppl 1):S56–S63. doi: 10.1097/MLR.0b013e3181a4f482. [DOI] [PubMed] [Google Scholar]
- 3.Yabroff KR, Lamont EB, Mariotto A, et al. Cost of care for elderly cancer patients in the United States. J Natl Cancer Inst. 2008;100(9):630–641. doi: 10.1093/jnci/djn103. [DOI] [PubMed] [Google Scholar]
- 4.Yabroff KR, Warren JL, Banthin J, et al. Comparison of approaches for estimating prevalence costs of care for cancer patients: what is the impact of data source? Med Care. 2009;47(7 Suppl 1):S64–S69. doi: 10.1097/MLR.0b013e3181a23e25. [DOI] [PMC free article] [PubMed] [Google Scholar]
- 5.Saunders KW, Davis RL, Stergachis A, Group Health Cooperative . In: Pharmacoepidemiology. Strom BL, editor. Wiley; New York: 2005. pp. 221–239. [Google Scholar]
- 6.Polen M, Green CA, Perrin NA, et al. Drinking patterns, gender and health I: attitudes and health practices. Addiction Research & Theory. 2010;18(2):122–142. doi: 10.3109/16066350903398486. [DOI] [PMC free article] [PubMed] [Google Scholar]
- 7.Hornbrook MC, Hart G, Ellis JL, et al. Building a virtual cancer research organization. J Natl Cancer Inst Monogr. 2005;(35):12–25. doi: 10.1093/jncimonographs/lgi033. [DOI] [PubMed] [Google Scholar]
Associated Data
This section collects any data citations, data availability statements, or supplementary materials included in this article.
Supplementary Materials
Supplemental Digital Content 1. Figure 1a. Hospital Discharges per 1,000 Members by Month of Pre-Diagnosis Phase, by Age Group and Cancer Status, 2000-2008—All Cancers. eps
Supplemental Digital Content 2. Figure 1b. Hospital Days per 1,000 Members by Month of Pre-Diagnosis Phase, by Age Group and Cancer Status, 2000-2008—All Cancers. eps
Supplemental Digital Content 3. Figure 1c. Emergency Room Visits per 1,000 Members by Month of Pre-Diagnosis Phase, by Age Group and Cancer Status, 2000-2008—All Cancers. eps
Supplemental Digital Content 4. Figure 2a. Same-Day Surgery Procedures per 1,000 Members by Month of Pre-Diagnosis Phase, by Age Group and Cancer Status, 2000-2008—All Cancers. eps
Supplemental Digital Content 5. Figure 2b. Ambulatory Medical Office Visits per 1,000 Members by Month of Pre-Diagnosis Phase, by Age Group and Cancer Status, 2000-2008—All Cancers. eps
Supplemental Digital Content 6. Figure 2c. Ambulatory Imaging Procedures per 1,000 Members by Month of Pre-Diagnosis Phase, by Age Group and Cancer Status, 2000-2008—All Cancers. eps
Supplemental Digital Content 7. Figure 3a. Ambulatory Laboratory Procedures per 1,000 Members by Month of Pre-Diagnosis Phase, by Age Group and Cancer Status, 2000-2008—All Cancers. eps
Supplemental Digital Content 8. Figure 3b. Ambulatory Prescription Dispensings per 1,000 Members by Month of Pre-Diagnosis Phase, by Age Group and Cancer Status, 2000-2008—All Cancers. eps


