

Abstract
Serial magnetic resonance imaging (MRI) facilitates the in vivo analysis of the intra- and intersubject evolution of traumatic brain injury (TBI) lesions. Despite the availability of MRI, the natural history of experimental focal contusion lesions in the controlled cortical impact (CCI) rat model has not been well described. We performed CCI on rats and MRI during the acute to chronic stages of cerebral injury to investigate the time course of changes in the brain. Female Wistar rats underwent CCI of their left motor cortex with a flat impact tip driven by an electromagnetic piston. In vivo MRI was performed at 7 T serially over six weeks post-CCI. The appearance of CCI-induced lesions and lesion-associated cortical volumes were variable on MRI, with the percent change in cortical volume of the CCI ipsilateral side to the contralateral side ranging from 18% within 2 hours of injury on Day 0 to a peak of 35% on Day 1 and a trough of -28% by Week 5/6, with an average standard deviation of ±14% at any given time point. In contrast, the percent change of ipsilateral side to contralateral side cortical volumes in control rats was not significant (1%±2%). Hemorrhagic conversion within and surrounding the CCI lesion occurred between days 2 and 9 in 45% of rats with no hemorrhage noted on initial scan. Furthermore, hemorrhage and hemosiderin within the lesion were positive for Prussian blue and highly autofluorescent on histological examination. Although some variation in injuries may be technique related, the divergence of similar lesions between initial and final scans demonstrates the inherent biological variability of the CCI rat model.
Keywords: traumatic brain injury, controlled cortical impact, MRI, hemorrhage, autofluorescence
Introduction
Traumatic brain injury (TBI) afflicts 1.7 million people in the U.S. per year, and is also a hallmark injury of the wars in Iraq and Afghanistan (1–3). Despite preclinical successes, translational effective neuroprotective or neuroregenerative strategies to treat TBI remain elusive except for symptomatic treatments such as reduction of elevated intracranial pressure (4). Several animal models have been developed for the experimental investigation of TBI (5). In a clinical population, TBI can result from one or more mechanisms of injury (i.e., blast, acceleration-deceleration, blunt trauma, penetrating trauma), often complicated by polytraumatic injuries to multiple organ systems (6). Of the current animal models for TBI, no single model encompasses all the injury types and the heterogeneity observed clinically with TBI.
Prior to MRI, the study of TBI in experimental animals was limited to endpoint analysis, with characterization of the lesion by immunohistochemistry (IHC), necessitating the use of additional cohorts of animals at various times post injury. Serial MRI allows investigators to monitor the evolution of experimental TBI lesions in vivo, and permits inter- and intrasubject comparisons (7–14). Although longitudinal MRI studies of the lateral fluid percussion (LFP) model in the rat have been reported (10–13,15,16), the natural history of focal contusion over time in the controlled cortical impact (CCI) rat model has not been as well characterized by MRI. MRI techniques have been utilized to investigate cerebral blood volume in the CCI model (14,17) within the first 5 hours (18) to a week (10) after injury. However, none of these studies has fully investigated the evolution of the CCI lesion over the acute to chronic time course with the description of changes in cortical volume and microenvironment in the surrounding parenchyma. The purpose of this study was to examine by MRI and histology the extent of the variability of moderate to severe CCI in the rat with respect to lesion size changes in cortical volumes and evolution of hemorrhage. In the present study, young adult female Wistar rats underwent CCI to model moderate to severe focal contusions, and were then followed by MRI in the acute to chronic stages after injury. Radiological pathological correlations and behavioral testing were performed.
Experimental
Animals
All experiments were conducted in accordance with the National Research Council’s Guide for the Care and Use of Laboratory Animals All studies were approved by the Animal Care and Use Committees at our institutions. Female Wistar rats age 8 to 12 weeks (200 to 250 g) were obtained from Charles River Laboratories (Wilmington, MA) (n=37). Rats were housed in pairs under 12 hour light/dark cycles in temperature-controlled conditions, and fed standard rodent laboratory chow and water ad libitum.
Controlled Cortical Impact (CCI) Model
The rat CCI model (19–21) was performed using an electromagnetic CCI device (Impact One stereotaxic impactor, myNeuroLab.com/Leica Microsystems, Richmond, IL) (22). Rats were anesthetized via nosecone with a mixture of 2–3% isoflurane and 97–98% oxygen for all procedures. Rats were placed in a stereotaxic frame for CCI. A rectal temperature probe was inserted, and body temperature was maintained with a circulating water warming pad. After scalp incision, a 6 mm craniotomy was performed over the left motor cortex (2.5 mm left lateral and 1.0 mm anterior of Bregma) using a micromotor drill with a dental bit. CCI was delivered with a 5 mm flat impactor tip at a velocity of 5 m/s, depth of 2.0 mm, and dwell time of 100 msec. Post-injury, the bone flap was replaced and sealed with dental acrylic cement. The scalp incision was closed with 4.0 nylon sutures. Rats were placed in warming cages and closely observed during recovery from anesthesia, then returned to their cages until further assessment. All TBI injuries for a given cohort of rats were performed by the same surgeon.
Behavioral Testing and Statistical Analysis
The neurological severity score-revised (NSS-R), which is a modification of several pre-existing NSS examinations (23–27), was performed as described (28). In brief, the NSS-R evaluates motor, sensory, and reflex function with ten tests. For each test, a normal response scores zero, moderate impairment scores one, and complete impairment scores two. The total score for an individual animal on the NSS-R ranges from 0 (completely normal) to 20 (most impaired). Rats underwent NSS-R evaluation at baseline and on days 1, 14, and 28 after injury (n=17). Data were analyzed with a one-way analysis of variance (ANOVA) and subsequent post-hoc Tukey, using Prism version 5.0c for Macintosh (GraphPad Software, San Diego, California, USA, www.graphpad.com), with a two-tailed p value of <0.05 considered significant.
MRI
In vivo MRI of the brain was performed on a 7 T Bruker Biospec (Billerica, MA) using a 40 mm inner diameter quadrature volume coil (Doty Scientific, Columbia, SC). For the first cohort of rats, MRI was performed on days 2, 9, and 30 post-CCI (n=23). To obtain information at other time points, depending on scanner availability, a second cohort of rats underwent MRI on day 0 (within an hour after CCI) or 1, day 3 or 4, Week 1 (day 7, 8, or 9), and week 4, 5, or 6 post-CCI (n=14). Seven healthy control rats were also scanned to determine variability in brain volumes. For comparison between the two cohorts, MRI scans were grouped as follows: initial scan (day 0, 1, or 2), Week 1 scan (day 7, 8, or 9), and final scan (week 4, 5, or 6). During MRI, physiological monitoring was performed on all animals. T2- and T2*-weighted images were acquired using a multi-echo spin echo or gradient echo sequence, respectively, to obtain images with high signal to noise and contrast by magnitude averaging the individual echo images. T2-weighted images were acquired with the following parameters: repetition time (TR)= 3500ms, effective echo time (TE) = 38.5 ms (10 echoes, 7 ms echo spacing), resolution of 112×112×500 μm3, and T2*-weighted 3D images were acquired with the following parameters: TR = 60ms, effective TE = 14.9 ms (6 echoes, 4.25 ms echo spacing), resolution of 117 μm isotropic, and 15° flip angle. Ex vivo MRI was performed on excised paraformaldehyde perfused brains using a 7 T Bruker vertical bore magnet with a 10 mm inner diameter birdcage coil. Brains were immersed in susceptibility matching fluid (Fomblin, Solvay Solexis, Inc., West Deptford, NJ) and imaged with a 3D multi-echo gradient echo sequence: TR = 200 ms, effective TE = 17.5 ms (6 echoes, 5 ms echo spacing), field of view = 3.0×1.5×1.25 cm3, 512×256×128 matrix, 4 averages, 30° flip angle.
Immunohistochemistry
Paraformaldehyde perfused brains were placed in a sucrose gradient, then transferred to optimum cutting temperature (OCT) media and frozen in liquid nitrogen. Cryosections were cut at 10μm thick in the coronal plane, mounted on glass slides and stored at −20°C. Representative sections underwent hematoxylin and eosin (H&E) staining using standard methods. For Prussian blue staining, brain sections were washed in deionized water then stained in 10% potassium hexacyanferrate (II) trihydrate (Sigma #P3289, St. Louis, MO) and 10% hydrochloric acid for 20 minutes at room temperature. Sections were then counterstained in Nuclear Fast Red Stain (NFS500, ScyTek Laboratories, Logan, UT) for 4 minutes. Slides were then dehydrated with ethanol and xylene prior to coverslip mounting in Permount (Fisher Scientific, Pittsburgh, PA).
For detection of autofluorescence, after rehydration and washing with phosphate buffered saline (PBS), brain slices were mounted in ProLong Gold antifade with DAPI (Invitrogen, Carlsbad, CA). Slides were visualized with a light and fluorescent microscope (Axioplan Imaging II; Zeiss, Oberkochen, Germany) and Axiovision software (Zeiss, Oberkochen, Germany).
Imaging and Statistical Analysis
Cortical and lesion volumes were determined using MEDx software (Medical Numerics, Germantown, MD). In brief, automated edge detection software was used to strip the skull from the T2-weighted MRI. The corpus callosum was identified and demarcated on T2w images and line was then drawn at the corpus callosum, and all brain structures beneath were removed. The identified white matter in the corpus callosum was also removed. The medial longitudinal fissure was then used to separate the TBI hemisphere from the contralateral hemisphere, and cortical volumes measured on both lesion side and contralateral side (Figure 1 depicts how the cortical volumes and lesion volumes were determined). Whole hemispheric volumes were not used in this study because of partial volume effects that would limit the ability to detect or would minimize changes resulting from CCI. When cyst formation occurred, these hyperintense volumes of interest were excluded from cortical volume measurements. To demarcate the lesion volumes a segmentation algorithm (FAST – FMRIB Automated Segmentation Tool v3.1, University of Oxford, United Kingdom) was applied to the T2-weighted MRI of CCI cortex in order to automatically delineate and determine the number of voxels that would have signal intensity consistent with cerebral spinal fluid from gray and white matter. Repeated cortical volume measurements were performed in 5 rats multiple times (n=5) to determine the coefficient of variation (COV) in the technique (BKL). To test correlation between percent changes in ipsilateral TBI versus contralateral volumes on different days, Pearson’s correlation coefficient was calculated using Microsoft Excel for Macintosh 2011(Microsoft, Redmond, Washington, USA), with a p value of <0.05 considered significant.
Figure 1.

To analyze MRI for cortical and CCI lesion volumes, the skull was first stripped away from the image using automated edge detection software. A line was then drawn at the corpus callosum, and everything beneath the line was removed. The corpus callosum was also then removed. The medial longitudinal fissure was used to separate the TBI and contralateral hemispheres. A segmentation algorithm (FAST – FMRIB’s Automated Segmentation Tool v3.1; http://www.fmrib.ox.ac.uk/) was applied only to the TBI side.
For qualitative analysis of hemorrhage, two independent observers with MRI experience (LCT, JAF) graded each day 2, 9, and 30 MRI in random order for the presence or absence of hemorrhage in and around the CCI lesion in order to determine how often hemorrhagic transformation occurred. For quantitative analysis of hemorrhage, the region of T2* signal voids were manually traced on T2*-weighted 3D gradient echo images. The observer (LJ) was blinded to the time point (day 2 or 9). The volume was calculated for each animal at each time point. A paired t-test was used to compare the signal void volumes between Day 2 and Day 9, with a p value of <0.05 considered significant using Microsoft Excel for Macintosh 2011(Microsoft, Redmond, Washington, USA). A separate analysis was performed as described above to determine whether any additional change in hemorrhage occurred between Day 9 and Day 30.
Results
The evolution of the moderate to severe CCI is depicted in Figure 2A, demonstrating the time course of comparable averaged slices from all rats from the registered MRIs on a given day. On serial MRIs, cortical lesions consistently extended over 12 to 14 out of 30 total 500 μm thick sections through the whole brain.
Figure 2.

The percent volume of injured side versus contralateral side changes over time after CCI. A) T2-weighted images were spatially registered to a common space and averaged among all available animals for each time point. The time course demonstrates the evolution of the injury over time. Substantial edema was apparent in the acute phase of injury, followed by an evolution to cortical atrophy in the subacute to chronic phase. B) Quantitative results pooled across all animals demonstrate an increase in the volume of the injured side relative to the uninjured side in the acute phase, consistent with injury related edema. As the edema resolves, cortical atrophy occurs on the injured side, with loss of approximately 10% on the lesion side versus the contralateral side. C) Lesion volumes (mm3) not including the cystic volume in injured animals mirror changes in cortical volume. Day 0 scans were obtained 1 hour post-injury. Week 1 includes all MRI obtained on days 7, 8, or 9. The number of animals represented by each time point is presented in Table 1.
Figure 2B plots the mean and standard deviation of the percent change in cortical volume from CCI to contralateral side on days post-injury. Figure 2C graphs the mean and standard deviation in CCI lesion volumes (mm3) over time, which mirrors the pattern of changes seen in Figure 2B. Analysis of control rats indicated that there were minimal differences in left to right cortical volumes (mean±standard deviation (SD): −1± 2%) prior to CCI injury (Table 1). MRI performed immediately following injury demonstrated an acute increase in CCI cortex compared to contralateral cortex on Days 0 through 4 secondary to increased swelling of the cortical lesion (percent change TBI/contralateral cortical volumes: Day 0=18%±13%; Day 1=35%±10%; Day 2=26%±11%; Day 3/4=17%±12%). Over time, the absolute cortical volume on the CCI side decreased, with the percent change in TBI versus contralateral cortical volumes changing from a mean of −1%±13% at 1 week after TBI to a −8%±14% loss by Week 4 and a −28%±11% loss by Week 5/6. The initial increase in mean percent ratio is consistent with acute peri-lesion swelling from vasogenic and cytotoxic edema and inflammation, subsequently leading to axonal/neuronal loss and cortical thinning resulting in hemispheric atrophy, ventricular enlargement and/or cerebrospinal fluid cyst formation, as indicated by the decreased mean percent ratio by Week 4.
Table 1.
Percentage change in the CCI side versus contralateral side cortical volumes over time.
| Time Point | % Change CCI Side/Contralateral Side ± SD | Number of rats (n) |
|---|---|---|
| Baseline | −1 ± 2 | 7 |
| Day 0 | 18 ± 13 | 9 |
| Day 1 | 35 ± 10 | 5 |
| Day 2 | 26 ± 11 | 23 |
| Day 3/4 | 17 ± 12 | 12 |
| Week 1 (Days 7, 8, 9) | −1 ± 13 | 37 |
| Week 4 (Days 29, 30) | −8 ± 14 | 27 |
| Week 5/6 (Days 35, 42) | −28 ±11 | 9 |
The MRI appearance and volume of CCI-induced lesions on initial scan, Week 1 scan, and final scan were variable as presented in Figure 3. For the first cohort of rats, there was no significant correlation between the percent change of CCI side cortex volume to contralateral side cortex volume on initial scan to subsequent exams at the middle time point and the final MRI time points (mean±SD: Cohort 1: initial=26±11%; middle = −2±14%; final = −10±14%) by Pearson’s correlation (initial versus middle Pearson’s r = −0.39, p = 0.12; initial versus final Pearson’s r = −0.25, p = 0.34) (Figures 3A and B, top). In the second cohort of rats, there was a correlation between percent change in cortical volumes of CCI side versus contralateral side (Cohort 2: initial=24±15%; middle=2±13%; final=−19±17%) on the initial and middle scan (Pearson’s r = 0.71, p < 0.01), but not between the initial and final scan (Pearson’s r = 0.40, p = 0.15). For both cohorts of rats, there was, however, a statistically significant correlation between percent change of the CCI side versus the contralateral side on the middle scan versus the final scan (Cohort 1: Pearson’s r = 0.76; p < 0.01; Cohort 2: Pearson’s r = 0.76; p < 0.01)(Figure 3B, bottom).
Figure 3.

Experimental TBI lesions with similar initial degrees of cortical injury and edema on initial time point MRI can appear markedly different on final scan. A) The variability seen in cortical volumes on initial scan increases by middle and final scans. The left graph displays the first cohort of rats, which had their scans on days 2, 9, and 30. The right graph depicts the results from the second cohort of rats (initial scan on day 0 or 1, middle scan on day 7 or 8, and final scan on day 29, 35, or 42). The lines on the scatter plot represent the mean±SD for each day’s percent cortical volume on the CCI side versus the contralateral side. B) A scatter plot of the percent change in cortical volumes of the CCI versus contralateral sides on initial scan versus final scan shows no correlation in either cohort of rats (Cohort 1: Pearson’s r = −0.25; p = 0.34; Cohort 2: Pearson’s r = 0.40; p = 0.15) (top). The percent change in cortical volumes on the middle scan versus the final scan is correlated (Cohort 1:Pearson’s r=0.76; p <0.01; Cohort 2: Pearson’s r = 0.76; p <0.01) (bottom). C) Marked variation can be observed in the appearance of similar injuries over time. The T2-weighted images, which had similar degrees of cortical injury on initial scan, are organized into three groups by the percent cortical loss observed by MRI at final scan: > −10%; <−10 to −20%; <−20%. The three representative rats depicted here all came from the first cohort of rats. Similar observations were made in rats from the second cohort.
Lesions that had similar cortical volumes on T2-weighted MRI on initial scan could vary dramatically by final scan (Figure 3C). The <10% loss observed on final MRI at week 4, 5, or 6 was seen in 42% of animals having both initial and final scans. The 10 to 20% loss pattern observed on final scan was seen in 19% of animals. The >20% loss pattern observed on final scan was seen in 39% of rats. The coefficient of variation of percent change CCI cortical volume/contralateral cortex measurements was 2.0%.
Behavioral analysis demonstrated a statistically significant increase (one way ANOVA p<0.05) in the NSS-R relative to baseline (NSS-R = 3.4±0.3) on Day 1 (NSS-R = 7.3±0.4) and Day 14 (NSS-R = 5.5±0.5) after injury (Figure 4). By Day 28 post-injury, NSS-R (4.7±0.4) was not different from baseline values (p>0.05). The NSS-R on Day 1 was significantly different from the days 14 and 28 NSS-R values (p<0.05). There was no statistical correlation between NSS-R and MRI lesion volume at comparable time points (NSS-R Day 1 and MRI Day 2; NSS-R Day 14 and MRI Day 9; NSS-R Day 28 and MRI Day 30) (data not shown).
Figure 4.

Behavioral testing of rats demonstrates a statistically significant initial increase in the Neurological Severity Score – Revised (NSS-R) on days 1 and 14 after injury, which subsequently decreases by Day 28, at which point there was no statistical difference from baseline values (* = p <0.05 by one-way ANOVA with post-hoc Tukey). The error bars for the NSS-R indicate the standard error of the mean, in accordance with behavioral testing standards.
While 29% of rats displayed hemorrhage (i.e., hypointense voxels on T2*-weighted images) by the first scan after injury in the first cohort of rats (with scans on days 2, 9, and 30), 45% of rats with no evidence of hypointense voxels at Day 2 developed hemorrhage by Day 9 (Figure 5). Rats that were negative for hemorrhage on T2*-weighted MRI on Day 9 did not develop hypointense voxels by Day 30. All rats in the second cohort had some evidence of hemorrhage on initial scan (day 0 or 1) and were excluded from further analysis of hemorrhagic conversion. To further quantify hemorrhage, T2*-weighted signal voids from all rats in the first cohort with MRI scans on both days 2 and 9 were manually traced and measured by an investigator blinded to day and rat. A statistically significant increase in hemorrhage-related T2*-weighted signal voids was seen, with 3.8±4.4 mm3 on Day 2 and 7.0±4.0 mm3 on Day 9 (p=0.006) (Figure 5B). There was no change in T2*-weighted signal voids on Day 30 (4.4±5.0 mm3; p=0.1) compared to Day 9. These regions of hemorrhage on the CCI lesion side demonstrated Prussian blue positive cells, and fluorescence microscopy at 10 days post-CCI revealed autofluorescence of Prussian blue positive cells in the cortex (Figure 6).
Figure 5.

Hemorrhagic conversion can occur in the days after initial CCI. A) Animals with little or no evidence of hemorrhage by MRI at 2 days after CCI can develop more hemorrhage by Day 9, as assessed by T2-weighted MRI and T2*-weighted 3D gradient echo MRI. B) Quantification of hemorrhage in manually traced T2* signal voids on days 2 and 9. Each grey line represents an individual rat’s T2* signal void on days 2 and 9. The black line indicates the mean and standard deviation values of all measured rats on those days.
Figure 6.
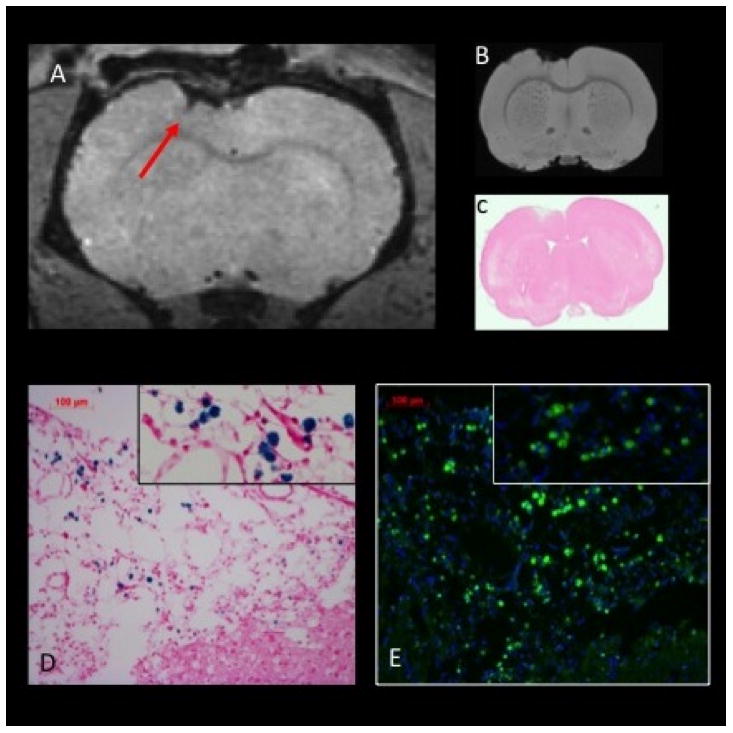
Potential confounding effects of hemorrhage in CCI lesions detected by MRI, Prussian blue, and fluorescence microscopy. A) In vivo T2*-weighted MRI at 9 days post-CCI depicts a region of hypointensity indicative of hemorrhage (arrow); B) Ex vivo T2*-weighted MRI depicts the similar pattern at 10 days post-injury; C) Hematoxylin and eosin stain of the slice matched section; D) Prussian blue staining in the regions shown in A demonstrates multiple staining foci that are solely the consequence of hemorrhage; E) Hemorrhagic products within the injured tissue at 10 days post-CCI are highly autofluorescent in the FITC channel (green) as shown in an antibody-naïve section rehydrated with PBS then counterstained with DAPI (blue).
Discussion
The major findings of this study were as follows: 1) variation occurs in the natural history of CCI lesions and cortical loss based on MRI as a result of the same impact parameters; and 2) hemorrhage can evolve on MRI between days 2 and 9 following CCI. In the current study, serial MRI was performed over 6 weeks following moderate to severe CCI in female rats over the left motor cortex, with observation of a wider variation in lesion volume, cortical loss and evidence of hemorrhage than was previously reported in this model.
The CCI model of TBI has been previously described as highly consistent when looking at endpoint analysis (22). Onyszchuk et al. reported a high correlation between MRI and histological lesion cavity volumes at 14 days post-injury in the mouse CCI model (29). Twenty-four hours after CCI in the mouse there were T2-weighted hyperintensities around and within the injury site that diminished by 48 hours, consistent with acute edema and its resolution (29,30). By 7 days, a ring of T2 signal hypointensity surrounded a hyperintense central area that converted entirely to a region of high signal intensity by Day 14 post-injury (29). These lesion-associated T2 hyperintense cavities persisted up to at least 2 months in mice (31).
The temporal evolution of CCI lesions by MRI in the rat has not been as well described. Three studies have used MRI to track lesion volumes after CCI in rats over time (14,17,32), two of which also focused upon cerebral blood flow while the third analyzed white matter changes by fractional anisotropy (32). Cross-sectional MRI studies performed at different time points out to 14 days in rats following moderate CCI revealed large intersubject variability in lesion size for similar impact settings (14). Serial MRI in a CCI rat model demonstrated T2 hyperintense lesions that increased in size one day after injury that subsequently decreased in volume out to 6 weeks while ventricular volumes increased (17). These results were similar to findings in the CCI mouse model (29,30). None of these studies formally addressed how consistent or variable the cortical injuries were by MRI.
The temporal evolution of other TBI models, such as lateral fluid percussion (LFP) in rats, has shown similar variability in lesion volume with time as compared to the CCI model. While Kharatishvili et al. observed correlation between 3 days post-LFP T2-weighted MRI lesion volumes and endpoint histology in male rats, there was significant variation in lesion volumes with overlap within their moderate and severe injury groups (11). Immonen et al. examined LFP in the rat with serial MRI up to 11 months post injury, and reported degrees of intersubject variability in lesion severity and size despite similar initial injury parameters (13). These authors subsequently divided the injured animals into three different subgroups (i.e., mild, moderate or severe lesions) based on MRI at 23 days post-injury (13).
In contrast to other studies that performed CCI posterior to Bregma in a cortical area over the hippocampus, the current study targeted the left frontal motor cortex for the CCI lesion. This location was chosen because an injury to the motor cortex might display more obvious neurological findings. In the current study, the behavioral results (Figure 4) revealed an increase in the NSS-R within 1 week after injury, predominantly on the basis of the motor cortex injury. However, the rats rapidly compensated for the left motor cortex neurological impairment with normalization of the NSS-R by Week 4 after injury. No correlations were observed between NSS-R and MRI lesion volumes at comparable time points in these experiments. Due to the neurological recovery 4 weeks post-CCI, we evaluated the percent change of TBI to contralateral cortical volumes as a potential MRI outcome measure. A possible limitation of using the percent change of the CCI to contralateral cortex is the lack of sensitivity to changes in the uninjured volumes.
In the present study, where initial scans were performed on Days 0 to 2 post-CCI, the standard deviations in the mean percent changes in TBI/contralateral cortical volumes were approximately 14%. The percent change in the ratio of cortical volume obtained from the initial MRI scans did not correlate with the ultimate lesion loss at 29 to 42 days post-injury. The craniotomy procedure itself can produce mild changes on MRI out to 14 days post-injury, with mean lesion volumes ranging from 2 to 10 mm3 (28). The size of the craniotomy-associated lesions is a small percentage (10 to 15%) of the lesion volumes produced by the CCI surgery itself as seen in the present study. Although the early variation (MRI on Days 0 to 2) in CCI lesions may be attributed to differences in surgical technique or technical variability inherent in the Leica CCI impactor device, the divergence of similar lesions in rats with initial, middle, and final time point MRI scans post-CCI clearly demonstrates the inherent biological variability in this model. Similar variability has been reported in the rat LFP model (11,13). The biological variability needs to be further evaluated and is observed in both sexes of rats used in LFP and CCI studies (11,13,14).
In the current study, gonadally intact female rats were used. Approximately half of the world’s human population is female, and TBI affects both men and women (1). In contrast, the vast majority of published experimental brain injury studies, including the few that have utilized MRI as an outcome measure, focus exclusively on male animals. We chose to study intact female rats to balance the experimental TBI MRI literature. The use of randomly cycling intact female rats most closely mimics the premenopausal human female population, in which there is no control over when TBI might occur.
We recognize that potential differences in ovarian hormone levels based on the phase of the estrus cycle may be contributing some additional variation in this study. Female rats housed in a room together, even in separate cages, can synchronize their estrous cycles (33). Combined with the short length of the rat’s estrus cycle (averaging 4.5 days in length (34,35)) and limitations on MRI access, ensuring that all intact female rats are at the same phase of the estrous cycle at the time of injury and/or scanning was difficult. In future studies the possible role of changes in ovarian hormone levels on MRI outcomes could be investigated by surgically or chemically ovariectomizing female rats with and without subsequent supplementation of estrogen and/or progesterone.
The fluctuating ovarian hormone levels seen during the cycle of the female rat during its reproductive years can affect the response to brain injury (36,37). Progesterone can reduce neuronal injury and edema in both focal (38–41) and diffuse injury (42) in TBI models. Whether or not progesterone or estrogen has any effect on the appearance of lesions by MRI is unknown. Some of the variation seen on initial MRI in this study may be related to differences in ovarian hormone levels in the gonadally intact female rats. Although the variation in progesterone levels may have resulted in different responses to injury on the Day 0 MRI, it would be an unlikely cause of similarly appearing lesions on Day 2 that ultimately resulted in the variability in cortical volumes observed on MRI at later time points. The outbred Wistar rat was used in this study and may have also contributed to the variability seen in the response to injury over time. The use of inbred strains would minimize genetic differences but would be less clinically relevant. It should be noted that large variability in MRI lesion volumes were observed in male rats in the LFP model using identical impact parameters (11,13) raising the question that the variability in lesion volumes observed in penetrating TBI models is due to gender differences.
The degree of variation in lesion volume observed in this cohort of animals has implications for the design of future studies using the CCI model in which MRI metrics such as lesion volume or cortical preservation would be used as an outcome measure or biomarker for novel cellular or drug therapies. Based on the standard deviations across all time points for the percent difference in TBI/contralateral cortex (14%), with an alpha of 0.05 (power of 0.80), and the ability to detect 10 to 20% difference as a result of treatment, future studies would require a minimum of 9–43 subjects per arm for two-treatment parallel group design (http://hedwig.mgh.harvard.edu/sample_size/js/js_parallel_quant.html), with additional animals required in case of technical difficulties (i.e., anesthesia deaths, extreme weight loss, or seizures requiring euthanasia of the animals). The number of animals per treatment arm needed to detect this difference is larger than most animal studies investigating treatment effects (of drugs or stem cells versus placebo, for example) in stroke studies (43). A survey of the TBI field demonstrates a similar preponderance of small subject numbers in recent preclinical trials (for example, see (17,32,44–47)). These findings suggest that most experimental studies reporting positive neuroregeneration results in response to treatment would be underpowered based on MRI metrics (43,48,49). Moreover, researchers should consider applying intention-to-treat analyses in these studies (49), as currently done in clinical research. In addition, as noted in the Cole et al. study (28), craniotomy itself can injure the surface of the brain, so investigators need to be sure to include the appropriate control groups (i.e. CCI plus treatment and CCI plus placebo for treatment studies; naïve control versus CCI and/or sham depending on study of other factors) for their particular study design.
Prior studies have noted that hemorrhage can occur after the initial injury in TBI models (12,50–54). MRI detected intracerebral hemorrhage within hours after injury in 89–100% of rats following CCI (14,17). Similar findings have been observed after LFP with hemorrhage being detected in 21–100% of rats (15). An assumption on the basis of endpoint analysis for the above studies was that the degree of hemorrhage remained static after the initial insult. In the current study, in the first cohort of rats, the evolution of intraparenchymal hemorrhage was observed between days 2 and 9 in 45% of rats without previous evidence of intracerebral blood after the initial MRI. In the present study, we are unable to address whether the degree of hemorrhage seen on initial scan changes over time because we excluded animals with evidence of intracerebral bleeding on initial MRI scan from further quantitative analysis of hemorrhage. The development of hypointense regions on T2*-weighted images over time was reminiscent of observations reported after ischemic stroke (55), and is consistent with IHC observation of progressive secondary hemorrhage in a rat contusion model (56,57). This finding suggests that the delayed hemorrhage in the penumbra of the traumatic CNS injury may result from secondary ischemia from edema or damaged/friable capillaries (55–57). Clinically, hemorrhagic conversion after TBI has not been well documented by MRI; however hemorrhagic progression after contusion (HPC) in the acute care setting has been described on the commonly used computerized tomography (56,58–61).
The possibility of intraparenchymal hemorrhagic evolution during the first week after experimental TBI has implications for interpreting results from studies tracking superparamagnetic iron oxide nanoparticle (SPION) labeled cells by MRI (17,32,62–64). Intracerebral hemorrhage and hemosiderin associated in CCI lesions have similar properties on T2 and T2*-weighted imaging, and result in Prussian blue positive staining within cells (65). Serial MRI has been used to investigate the homing of SPION labeled cells used as possible treatment in experimental TBI (17,63,64). Recently Li et al. reported that SPION-labeled cells showed persistent T2 and T2* hypointensity over time while old hemorrhage does not (17). This result is problematic in comparison to clinical situations, as chronic hemosiderin deposition in superficial siderosis demonstrates persistent T2 hypointensity with associated Prussian blue positive cells (66–69). T2 hypointensities were also observed in the cerebral microbleeds associated with risk of stroke recurrence (70) and in cerebral amyloid angiopathy (71). The persistence of hypointense voxels on T2 and T2*-weighted images has also been demonstrated to occur more often in experimental animals that reject labeled stem cell transplants (72), complicating the interpretation of MRI cell tracking studies using SPION-labeled cells. The current study underscores the need for a control group as well as for obtaining serial MRI in order to determine if new hypointense voxels on T2*-weighted images after TBI are due to hemorrhage and microbleeds versus the migration of magnetically labeled cells into the brain following an intravenous injection. More importantly, cell therapy experiments have utilized Prussian blue and immunohistochemistry to identify SPION-labeled cells within the lesion. As we have demonstrated in the absence of any cell therapy, hemorrhagic products within the lesion stain for Prussian blue. Moreover, these same foci were highly autofluorescent at the 488 nm excitation wavelength and could be misconstrued as positively stained exogenous cells. Therefore, in CNS injuries that result in hemorrhage, numerous potential confounds are present that need to be appropriately controlled for and examined in order to interpret the results from cell therapy studies. The use of T1 contrast agents such as gadolinium chelates (73–75) or gadolinium nanoparticles (76–78) for the labeling of cells in MRI tracking experiments would be an alternative approach to the use of SPION-labeled cells in diseases such as TBI where hemorrhage may be a confounder.
Conclusions
This study documented variability in the natural history on MRI of TBI lesions induced by similar initial CCI over time along with the delayed intracortical hemorrhagic conversion of contusions that were hemorrhage negative on initial MRI scan between days 2 and 9 after injury. Inclusion of serial MRI in studies to track lesion evolution over time would be invaluable to better understand the response to injury, rather than solely focusing on endpoint analysis.
Acknowledgments
This work was supported by funding from the Department of Defense through the Center for Neuroscience and Regenerative Medicine (Henry M. Jackson Foundation Award #300604-8.01-60855) and from the Intramural Research Program of the Clinical Center at the National Institutes of Health.
Abbreviations
- CCI
controlled cortical impact
- H & E
hematoxylin and eosin
- HPC
hemorrhagic progression after contusion
- IHC
immunohistochemistry
- LFP
lateral fluid percussion
- NSS-R
Neurological Severity Score – Revised
- PBS
phosphate buffered saline
- SD
standard deviation
- SEM
standard error of mean
- SPION
superparamagnetic iron oxide nanoparticle
- TBI
traumatic brain injury
Footnotes
Disclaimer
The opinions expressed herein belong solely to the authors. They do not nor should they be interpreted as representative of or endorsed by the Uniformed Services University of the Health Sciences, U.S. Army, U.S. Navy, Dept. of Defense or any other agency of the federal government.
Author Disclosure Statement
The authors have no financial conflicts of interest to disclose.
Author Contributions
Guarantors of integrity of entire study, LCT, MDB, NEG, WW, JAF; Study concepts/design, data acquisition, data analysis/interpretation, all authors; manuscript drafting or manuscript revision for important intellectual content, LCT, JAF; manuscript final approval, all authors; statistical analysis, LCT, AY; manuscript editing LCT, JAF.
References
- 1.Faul M, Xu L, Wald MM, Coronado VG. U.S. Department of Health and Human Services CfDCaP. Traumatic brain injury in the United States: Emergency department visits, hospitalizations and deaths 2002–2006. Atlanta, GA: Centers for Disease Control and Prevention, National Center for Injury Prevention and Control; 2010. wwwcdcgov/TraumaticBrainInjury. [Google Scholar]
- 2.Bell RS, Vo AH, Neal CJ, Tigno J, Roberts R, Mossop C, Dunne JR, Armonda RA. Military traumatic brain and spinal column injury: a 5-year study of the impact blast and other military grade weaponry on the central nervous system. J Trauma. 2009;66:S104–111. doi: 10.1097/TA.0b013e31819d88c8. [DOI] [PubMed] [Google Scholar]
- 3.Risdall JE, Menon DK. Traumatic brain injury. Philos Trans R Soc Lond B Biol Sci. 2011;366:241–250. doi: 10.1098/rstb.2010.0230. [DOI] [PMC free article] [PubMed] [Google Scholar]
- 4.Roberts I, Schierhout G, Alderson P. Absence of evidence for the effectiveness of five interventions routinely used in the intensive care management of severe head injury: a systematic review. J Neurol Neurosurg Psychiatry. 1998;65:729–733. doi: 10.1136/jnnp.65.5.729. [DOI] [PMC free article] [PubMed] [Google Scholar]
- 5.Marklund N, Hillered L. Animal modelling of traumatic brain injury in preclinical drug development: where do we go from here? Br J Pharmacol. 2011;164:1207–1229. doi: 10.1111/j.1476-5381.2010.01163.x. [DOI] [PMC free article] [PubMed] [Google Scholar]
- 6.Andriessen TM, Jacobs B, Vos PE. Clinical characteristics and pathophysiological mechanisms of focal and diffuse traumatic brain injury. J Cell Mol Med. 2010;14:2381–2392. doi: 10.1111/j.1582-4934.2010.01164.x. [DOI] [PMC free article] [PubMed] [Google Scholar]
- 7.Albensi BC, Knoblach SM, Chew BG, O’Reilly MP, Faden AI, Pekar JJ. Diffusion and high resolution MRI of traumatic brain injury in rats: time course and correlation with histology. Exp Neurol. 2000;162:61–72. doi: 10.1006/exnr.2000.7256. [DOI] [PubMed] [Google Scholar]
- 8.Kochanek PM, Hendrich KS, Dixon CE, Schiding JK, Williams DS, Ho C. Cerebral blood flow at one year after controlled cortical impact in rats: assessment by magnetic resonance imaging. J Neurotrauma. 2002;19:1029–1037. doi: 10.1089/089771502760341947. [DOI] [PubMed] [Google Scholar]
- 9.Thomale UW, Griebenow M, Mautes A, Beyer TF, Dohse NK, Stroop R, Sakowitz OW, Unterberg AW, Stover JF. Heterogeneous regional and temporal energetic impairment following controlled cortical impact injury in rats. Neurol Res. 2007;29:594–603. doi: 10.1179/016164107X166272. [DOI] [PubMed] [Google Scholar]
- 10.Obenaus A, Robbins M, Blanco G, Galloway NR, Snissarenko E, Gillard E, Lee S, Curras-Collazo M. Multi-modal magnetic resonance imaging alterations in two rat models of mild neurotrauma. J Neurotrauma. 2007;24:1147–1160. doi: 10.1089/neu.2006.0211. [DOI] [PubMed] [Google Scholar]
- 11.Kharatishvili I, Sierra A, Immonen RJ, Grohn OH, Pitkanen A. Quantitative T2 mapping as a potential marker for the initial assessment of the severity of damage after traumatic brain injury in rat. Exp Neurol. 2009;217:154–164. doi: 10.1016/j.expneurol.2009.01.026. [DOI] [PubMed] [Google Scholar]
- 12.Immonen RJ, Kharatishvili I, Grohn H, Pitkanen A, Grohn OH. Quantitative MRI predicts long-term structural and functional outcome after experimental traumatic brain injury. Neuroimage. 2009;45:1–9. doi: 10.1016/j.neuroimage.2008.11.022. [DOI] [PubMed] [Google Scholar]
- 13.Immonen RJ, Kharatishvili I, Niskanen JP, Grohn H, Pitkanen A, Grohn OH. Distinct MRI pattern in lesional and perilesional area after traumatic brain injury in rat--11 months follow-up. Exp Neurol. 2009;215:29–40. doi: 10.1016/j.expneurol.2008.09.009. [DOI] [PubMed] [Google Scholar]
- 14.Immonen R, Heikkinen T, Tahtivaara L, Nurmi A, Stenius TK, Puolivali J, Tuinstra T, Phinney AL, Van Vliet B, Yrjanheikki J, Grohn O. Cerebral blood volume alterations in the perilesional areas in the rat brain after traumatic brain injury--comparison with behavioral outcome. J Cereb Blood Flow Metab. 2010;30:1318–1328. doi: 10.1038/jcbfm.2010.15. [DOI] [PMC free article] [PubMed] [Google Scholar]
- 15.Bouilleret V, Cardamone L, Liu YR, Fang K, Myers DE, O’Brien TJ. Progressive brain changes on serial manganese-enhanced MRI following traumatic brain injury in the rat. J Neurotrauma. 2009;26:1999–2013. doi: 10.1089/neu.2009.0943. [DOI] [PubMed] [Google Scholar]
- 16.Hayward NM, Tuunanen PI, Immonen R, Ndode-Ekane XE, Pitkanen A, Grohn O. Magnetic resonance imaging of regional hemodynamic and cerebrovascular recovery after lateral fluid-percussion brain injury in rats. J Cereb Blood Flow Metab. 2011;31:166–177. doi: 10.1038/jcbfm.2010.67. [DOI] [PMC free article] [PubMed] [Google Scholar]
- 17.Li L, Jiang Q, Qu CS, Ding GL, Li QJ, Wang SY, Lee JH, Lu M, Mahmood A, Chopp M. Transplantation of marrow stromal cells restores cerebral blood flow and reduces cerebral atrophy in rats with traumatic brain injury: in vivo MRI study. J Neurotrauma. 2011;28:535–545. doi: 10.1089/neu.2010.1619. [DOI] [PMC free article] [PubMed] [Google Scholar]
- 18.Colgan NC, Cronin MM, Gobbo OL, O’Mara SM, O’Connor WT, Gilchrist MD. Quantitative MRI analysis of brain volume changes due to controlled cortical impact. J Neurotrauma. 2010;27:1265–1274. doi: 10.1089/neu.2009.1267. [DOI] [PubMed] [Google Scholar]
- 19.Dixon CE, Clifton GL, Lighthall JW, Yaghmai AA, Hayes RL. A controlled cortical impact model of traumatic brain injury in the rat. J Neurosci Methods. 1991;39:253–262. doi: 10.1016/0165-0270(91)90104-8. [DOI] [PubMed] [Google Scholar]
- 20.Kochanek PM, Marion DW, Zhang W, Schiding JK, White M, Palmer AM, Clark RS, O’Malley ME, Styren SD, Ho C, DeKosky ST. Severe controlled cortical impact in rats: assessment of cerebral edema, blood flow, and contusion volume. J Neurotrauma. 1995;12:1015–1025. doi: 10.1089/neu.1995.12.1015. [DOI] [PubMed] [Google Scholar]
- 21.Clark RS, Kochanek PM, Dixon CE, Chen M, Marion DW, Heineman S, DeKosky ST, Graham SH. Early neuropathologic effects of mild or moderate hypoxemia after controlled cortical impact injury in rats. J Neurotrauma. 1997;14:179–189. doi: 10.1089/neu.1997.14.179. [DOI] [PubMed] [Google Scholar]
- 22.Brody DL, Mac Donald C, Kessens CC, Yuede C, Parsadanian M, Spinner M, Kim E, Schwetye KE, Holtzman DM, Bayly PV. Electromagnetic controlled cortical impact device for precise, graded experimental traumatic brain injury. J Neurotrauma. 2007;24:657–673. doi: 10.1089/neu.2006.0011. [DOI] [PMC free article] [PubMed] [Google Scholar]
- 23.Shohami E, Novikov M, Bass R. Long-term effect of HU-211, a novel non-competitive NMDA antagonist, on motor and memory functions after closed head injury in the rat. Brain Res. 1995;674:55–62. doi: 10.1016/0006-8993(94)01433-i. [DOI] [PubMed] [Google Scholar]
- 24.Hamm RJ. Neurobehavioral assessment of outcome following traumatic brain injury in rats: an evaluation of selected measures. J Neurotrauma. 2001;18:1207–1216. doi: 10.1089/089771501317095241. [DOI] [PubMed] [Google Scholar]
- 25.Mahmood A, Lu D, Wang L, Li Y, Lu M, Chopp M. Treatment of traumatic brain injury in female rats with intravenous administration of bone marrow stromal cells. Neurosurgery. 2001;49:1196–1203. discussion 1203–1194. [PubMed] [Google Scholar]
- 26.Mahmood A, Lu D, Lu M, Chopp M. Treatment of traumatic brain injury in adult rats with intravenous administration of human bone marrow stromal cells. Neurosurgery. 2003;53:697–702. doi: 10.1227/01.neu.0000079333.61863.aa. discussion 702–693. [DOI] [PubMed] [Google Scholar]
- 27.Marti M, Mela F, Fantin M, Zucchini S, Brown JM, Witta J, Di Benedetto M, Buzas B, Reinscheid RK, Salvadori S, Guerrini R, Romualdi P, Candeletti S, Simonato M, Cox BM, Morari M. Blockade of nociceptin/orphanin FQ transmission attenuates symptoms and neurodegeneration associated with Parkinson’s disease. J Neurosci. 2005;25:9591–9601. doi: 10.1523/JNEUROSCI.2546-05.2005. [DOI] [PMC free article] [PubMed] [Google Scholar]
- 28.Cole JT, Yarnell A, Kean WS, Gold E, Lewis B, Ren M, McMullen DC, Jacobowitz DM, Pollard HB, O’Neill JT, Grunberg NE, Dalgard CL, Frank JA, Watson WD. Craniotomy: true sham for traumatic brain injury, or a sham of a sham? J Neurotrauma. 2011;28:359–369. doi: 10.1089/neu.2010.1427. [DOI] [PMC free article] [PubMed] [Google Scholar]
- 29.Onyszchuk G, Al-Hafez B, He YY, Bilgen M, Berman NE, Brooks WM. A mouse model of sensorimotor controlled cortical impact: characterization using longitudinal magnetic resonance imaging, behavioral assessments and histology. J Neurosci Methods. 2007;160:187–196. doi: 10.1016/j.jneumeth.2006.09.007. [DOI] [PMC free article] [PubMed] [Google Scholar]
- 30.Onyszchuk G, He YY, Berman NE, Brooks WM. Detrimental effects of aging on outcome from traumatic brain injury: a behavioral, magnetic resonance imaging, and histological study in mice. J Neurotrauma. 2008;25:153–171. doi: 10.1089/neu.2007.0430. [DOI] [PubMed] [Google Scholar]
- 31.Onyszchuk G, Levine SM, Brooks WM, Berman NE. Post-acute pathological changes in the thalamus and internal capsule in aged mice following controlled cortical impact injury: a magnetic resonance imaging, iron histochemical, and glial immunohistochemical study. Neurosci Lett. 2009;452:204–208. doi: 10.1016/j.neulet.2009.01.049. [DOI] [PMC free article] [PubMed] [Google Scholar]
- 32.Jiang Q, Qu C, Chopp M, Ding GL, Davarani SP, Helpern JA, Jensen JH, Zhang ZG, Li L, Lu M, Kaplan D, Hu J, Shen Y, Kou Z, Li Q, Wang S, Mahmood A. MRI evaluation of axonal reorganization after bone marrow stromal cell treatment of traumatic brain injury. NMR Biomed. 2011;24:1119–1128. doi: 10.1002/nbm.1667. [DOI] [PMC free article] [PubMed] [Google Scholar]
- 33.McClintock MK. Estrous synchrony and its mediation by airborne chemical communication (Rattus norvegicus) Hormones and behavior. 1978;10:264–275. doi: 10.1016/0018-506x(78)90071-5. [DOI] [PubMed] [Google Scholar]
- 34.Mandl AM. The phases of the oestrous cycle in the adult white rat. J Exp Biol. 1951;28:576–584. [Google Scholar]
- 35.Westwood FR. The female rat reproductive cycle: a practical histological guide to staging. Toxicol Pathol. 2008;36:375–384. doi: 10.1177/0192623308315665. [DOI] [PubMed] [Google Scholar]
- 36.Herson PS, Koerner IP, Hurn PD. Sex, sex steroids, and brain injury. Semin Reprod Med. 2009;27:229–239. doi: 10.1055/s-0029-1216276. [DOI] [PMC free article] [PubMed] [Google Scholar]
- 37.Turtzo LC, McCullough LD. Sex-specific responses to stroke. Future Neurol. 2010;5:47–59. doi: 10.2217/fnl.09.66. [DOI] [PMC free article] [PubMed] [Google Scholar]
- 38.Roof RL, Duvdevani R, Stein DG. Gender influences outcome of brain injury: progesterone plays a protective role. Brain Res. 1993;607:333–336. doi: 10.1016/0006-8993(93)91526-x. [DOI] [PubMed] [Google Scholar]
- 39.Roof RL, Duvdevani R, Braswell L, Stein DG. Progesterone facilitates cognitive recovery and reduces secondary neuronal loss caused by cortical contusion injury in male rats. Exp Neurol. 1994;129:64–69. doi: 10.1006/exnr.1994.1147. [DOI] [PubMed] [Google Scholar]
- 40.Roof RL, Duvdevani R, Heyburn JW, Stein DG. Progesterone rapidly decreases brain edema: treatment delayed up to 24 hours is still effective. Exp Neurol. 1996;138:246–251. doi: 10.1006/exnr.1996.0063. [DOI] [PubMed] [Google Scholar]
- 41.Bramlett HM, Dietrich WD. Neuropathological protection after traumatic brain injury in intact female rats versus males or ovariectomized females. J Neurotrauma. 2001;18:891–900. doi: 10.1089/089771501750451811. [DOI] [PubMed] [Google Scholar]
- 42.O’Connor CA, Cernak I, Johnson F, Vink R. Effects of progesterone on neurologic and morphologic outcome following diffuse traumatic brain injury in rats. Exp Neurol. 2007;205:145–153. doi: 10.1016/j.expneurol.2007.01.034. [DOI] [PubMed] [Google Scholar]
- 43.Sena ES, van der Worp HB, Bath PM, Howells DW, Macleod MR. Publication bias in reports of animal stroke studies leads to major overstatement of efficacy. PLoS Biol. 2010;8:e1000344. doi: 10.1371/journal.pbio.1000344. [DOI] [PMC free article] [PubMed] [Google Scholar]
- 44.Harting MT, Sloan LE, Jimenez F, Baumgartner J, Cox CS., Jr Subacute neural stem cell therapy for traumatic brain injury. J Surg Res. 2009;153:188–194. doi: 10.1016/j.jss.2008.03.037. [DOI] [PMC free article] [PubMed] [Google Scholar]
- 45.Meng Y, Xiong Y, Mahmood A, Zhang Y, Qu C, Chopp M. Dose-dependent neurorestorative effects of delayed treatment of traumatic brain injury with recombinant human erythropoietin in rats. J Neurosurg. 2011;115:550–560. doi: 10.3171/2011.3.JNS101721. [DOI] [PMC free article] [PubMed] [Google Scholar]
- 46.Walker PA, Harting MT, Jimenez F, Shah SK, Pati S, Dash PK, Cox CS., Jr Direct intrathecal implantation of mesenchymal stromal cells leads to enhanced neuroprotection via an NFkappaB-mediated increase in interleukin-6 production. Stem Cells Dev. 2010;19:867–876. doi: 10.1089/scd.2009.0188. [DOI] [PMC free article] [PubMed] [Google Scholar]
- 47.Walker PA, Shah SK, Jimenez F, Gerber MH, Xue H, Cutrone R, Hamilton JA, Mays RW, Deans R, Pati S, Dash PK, Cox CS., Jr Intravenous multipotent adult progenitor cell therapy for traumatic brain injury: preserving the blood brain barrier via an interaction with splenocytes. Exp Neurol. 2010;225:341–352. doi: 10.1016/j.expneurol.2010.07.005. [DOI] [PMC free article] [PubMed] [Google Scholar]
- 48.Ioannidis JP. Why most published research findings are false. PLoS Med. 2005;2:e124. doi: 10.1371/journal.pmed.0020124. [DOI] [PMC free article] [PubMed] [Google Scholar]
- 49.van der Worp HB, Howells DW, Sena ES, Porritt MJ, Rewell S, O’Collins V, Macleod MR. Can animal models of disease reliably inform human studies? PLoS Med. 2010;7:e1000245. doi: 10.1371/journal.pmed.1000245. [DOI] [PMC free article] [PubMed] [Google Scholar]
- 50.Cortez SC, McIntosh TK, Noble LJ. Experimental fluid percussion brain injury: vascular disruption and neuronal and glial alterations. Brain Res. 1989;482:271–282. doi: 10.1016/0006-8993(89)91190-6. [DOI] [PubMed] [Google Scholar]
- 51.McIntosh TK, Vink R, Noble L, Yamakami I, Fernyak S, Soares H, Faden AL. Traumatic brain injury in the rat: characterization of a lateral fluid-percussion model. Neuroscience. 1989;28:233–244. doi: 10.1016/0306-4522(89)90247-9. [DOI] [PubMed] [Google Scholar]
- 52.Sutton RL, Lescaudron L, Stein DG. Unilateral cortical contusion injury in the rat: vascular disruption and temporal development of cortical necrosis. J Neurotrauma. 1993;10:135–149. doi: 10.1089/neu.1993.10.135. [DOI] [PubMed] [Google Scholar]
- 53.Dietrich WD, Alonso O, Halley M. Early microvascular and neuronal consequences of traumatic brain injury: a light and electron microscopic study in rats. J Neurotrauma. 1994;11:289–301. doi: 10.1089/neu.1994.11.289. [DOI] [PubMed] [Google Scholar]
- 54.Iwamoto Y, Yamaki T, Murakami N, Umeda M, Tanaka C, Higuchi T, Aoki I, Naruse S, Ueda S. Investigation of morphological change of lateral and midline fluid percussion injury in rats, using magnetic resonance imaging. Neurosurgery. 1997;40:163–167. doi: 10.1097/00006123-199701000-00036. [DOI] [PubMed] [Google Scholar]
- 55.Rosell A, Foerch C, Murata Y, Lo EH. Mechanisms and markers for hemorrhagic transformation after stroke. Acta Neurochir Suppl. 2008;105:173–178. doi: 10.1007/978-3-211-09469-3_34. [DOI] [PubMed] [Google Scholar]
- 56.Kurland D, Hong C, Aarabi B, Gerzanich V, Simard JM. Hemorrhagic progression of a contusion after traumatic brain injury: a review. J Neurotrauma. 2012;29:19–31. doi: 10.1089/neu.2011.2122. [DOI] [PMC free article] [PubMed] [Google Scholar]
- 57.Simard JM, Kilbourne M, Tsymbalyuk O, Tosun C, Caridi J, Ivanova S, Keledjian K, Bochicchio G, Gerzanich V. Key role of sulfonylurea receptor 1 in progressive secondary hemorrhage after brain contusion. J Neurotrauma. 2009;26:2257–2267. doi: 10.1089/neu.2009.1021. [DOI] [PMC free article] [PubMed] [Google Scholar]
- 58.Oertel M, Kelly DF, McArthur D, Boscardin WJ, Glenn TC, Lee JH, Gravori T, Obukhov D, McBride DQ, Martin NA. Progressive hemorrhage after head trauma: predictors and consequences of the evolving injury. J Neurosurg. 2002;96:109–116. doi: 10.3171/jns.2002.96.1.0109. [DOI] [PubMed] [Google Scholar]
- 59.Sifri ZC, Homnick AT, Vaynman A, Lavery R, Liao W, Mohr A, Hauser CJ, Manniker A, Livingston D. A prospective evaluation of the value of repeat cranial computed tomography in patients with minimal head injury and an intracranial bleed. J Trauma. 2006;61:862–867. doi: 10.1097/01.ta.0000224225.54982.90. [DOI] [PubMed] [Google Scholar]
- 60.Flint AC, Manley GT, Gean AD, Hemphill JC, 3rd, Rosenthal G. Post-operative expansion of hemorrhagic contusions after unilateral decompressive hemicraniectomy in severe traumatic brain injury. J Neurotrauma. 2008;25:503–512. doi: 10.1089/neu.2007.0442. [DOI] [PubMed] [Google Scholar]
- 61.Alahmadi H, Vachhrajani S, Cusimano MD. The natural history of brain contusion: an analysis of radiological and clinical progression. J Neurosurg. 2010;112:1139–1145. doi: 10.3171/2009.5.JNS081369. [DOI] [PubMed] [Google Scholar]
- 62.Zhu J, Zhou L, XingWu F. Tracking neural stem cells in patients with brain trauma. N Engl J Med. 2006;355:2376–2378. doi: 10.1056/NEJMc055304. [DOI] [PubMed] [Google Scholar]
- 63.Foley LM, Hitchens TK, Ho C, Janesko-Feldman KL, Melick JA, Bayir H, Kochanek PM. Magnetic resonance imaging assessment of macrophage accumulation in mouse brain after experimental traumatic brain injury. J Neurotrauma. 2009;26:1509–1519. doi: 10.1089/neu.2008.0747. [DOI] [PMC free article] [PubMed] [Google Scholar]
- 64.Cheng JL, Yang YJ, Li HL, Wang J, Wang MH, Zhang Y. In vivo tracing of superparamagnetic iron oxide-labeled bone marrow mesenchymal stem cells transplanted for traumatic brain injury by susceptibility weighted imaging in a rat model. Chin J Traumatol. 2010;13:173–177. [PubMed] [Google Scholar]
- 65.Belayev L, Obenaus A, Zhao W, Saul I, Busto R, Wu C, Vigdorchik A, Lin B, Ginsberg MD. Experimental intracerebral hematoma in the rat: characterization by sequential magnetic resonance imaging, behavior, and histopathology. Effect of albumin therapy. Brain Res. 2007;1157:146–155. doi: 10.1016/j.brainres.2007.04.077. [DOI] [PubMed] [Google Scholar]
- 66.Kumar N. Superficial siderosis: associations and therapeutic implications. Arch Neurol. 2007;64:491–496. doi: 10.1001/archneur.64.4.491. [DOI] [PubMed] [Google Scholar]
- 67.Kakeda S, Korogi Y, Ohnari N, Nishimura J, Moriya J, Yamamoto J, Nishizawa S. Superficial siderosis associated with a chronic subdural hematoma: T2-weighted MR imaging at 3T. Acad Radiol. 2010;17:871–876. doi: 10.1016/j.acra.2010.02.014. [DOI] [PubMed] [Google Scholar]
- 68.Nanda S, Sharma SG, Longo S. Superficial siderosis - mechanism of disease: an alternative hypothesis. Ann Clin Biochem. 2010;47:275–278. doi: 10.1258/acb.2010.009226. [DOI] [PubMed] [Google Scholar]
- 69.Kellermier H, Wang G, Wiley C. Iron localization in superficial siderosis of the central nervous system. Neuropathology. 2009;29:187–195. doi: 10.1111/j.1440-1789.2008.00943.x. [DOI] [PMC free article] [PubMed] [Google Scholar]
- 70.Imaizumi T, Horita Y, Hashimoto Y, Niwa J. Dotlike hemosiderin spots on T2*-weighted magnetic resonance imaging as a predictor of stroke recurrence: a prospective study. J Neurosurg. 2004;101:915–920. doi: 10.3171/jns.2004.101.6.0915. [DOI] [PubMed] [Google Scholar]
- 71.Dierksen GA, Skehan ME, Khan MA, Jeng J, Nandigam RN, Becker JA, Kumar A, Neal KL, Betensky RA, Frosch MP, Rosand J, Johnson KA, Viswanathan A, Salat DH, Greenberg SM. Spatial relation between microbleeds and amyloid deposits in amyloid angiopathy. Ann Neurol. 2010;68:545–548. doi: 10.1002/ana.22099. [DOI] [PMC free article] [PubMed] [Google Scholar]
- 72.Berman SC, Galpoththawela C, Gilad AA, Bulte JW, Walczak P. Long-term MR cell tracking of neural stem cells grafted in immunocompetent versus immunodeficient mice reveals distinct differences in contrast between live and dead cells. Magn Reson Med. 2011;65:564–574. doi: 10.1002/mrm.22613. [DOI] [PMC free article] [PubMed] [Google Scholar]
- 73.Giesel FL, Stroick M, Griebe M, Troster H, von der Lieth CW, Requardt M, Rius M, Essig M, Kauczor HU, Hennerici MG, Fatar M. Gadofluorine m uptake in stem cells as a new magnetic resonance imaging tracking method: an in vitro and in vivo study. Invest Radiol. 2006;41:868–873. doi: 10.1097/01.rli.0000246147.44835.4c. [DOI] [PubMed] [Google Scholar]
- 74.Agudelo CA, Tachibana Y, Noboru T, Iida H, Yamaoka T. Long-term in vivo magnetic resonance imaging tracking of endothelial progenitor cells transplanted in rat ischemic limbs and their angiogenic potential. Tissue Eng Part A. 2011;17:2079–2089. doi: 10.1089/ten.TEA.2010.0482. [DOI] [PubMed] [Google Scholar]
- 75.Agudelo CA, Tachibana Y, Hurtado AF, Ose T, Iida H, Yamaoka T. The use of magnetic resonance cell tracking to monitor endothelial progenitor cells in a rat hindlimb ischemic model. Biomaterials. 2012;33:2439–2448. doi: 10.1016/j.biomaterials.2011.11.075. [DOI] [PubMed] [Google Scholar]
- 76.Faucher L, Guay-Begin AA, Lagueux J, Cote MF, Petitclerc E, Fortin MA. Ultra-small gadolinium oxide nanoparticles to image brain cancer cells in vivo with MRI. Contrast Media Mol Imaging. 2011;6:209–218. doi: 10.1002/cmmi.420. [DOI] [PubMed] [Google Scholar]
- 77.Anderson SA, Lee K, Frank JA. Gadolinium Fullerenol as a paramagnetic contrast agent for cell labeling. Investigative Radiology. 2006;41:332–338. doi: 10.1097/01.rli.0000192420.94038.9e. [DOI] [PubMed] [Google Scholar]
- 78.Faucher L, Tremblay M, Lagueux J, Gossuin Y, Fortin MA. Rapid Synthesis of PEGylated Ultra-small Gadolinium Oxide Nanoparticles for Cell Labeling and Tracking with MRI. ACS Appl Mater Interfaces. 2012 doi: 10.1021/am3006466. [DOI] [PubMed] [Google Scholar]