

Abstract
Purpose
Membrane transporters mediate many biological effects of chemicals and play a major role in pharmacokinetics and drug resistance. The selection of viable drug candidates among biologically active compounds requires the assessment of their transporter interaction profiles.
Methods
Using public sources, we have assembled and curated the largest, to our knowledge, human intestinal transporter database (>5,000 interaction entries for >3,700 molecules). This data was used to develop thoroughly validated classification Quantitative Structure-Activity Relationship (QSAR) models of transport and/or inhibition of several major transporters including MDR1, BCRP, MRP1-4, PEPT1, ASBT, OATP2B1, OCT1, and MCT1.
Results & Conclusions
QSAR models have been developed with advanced machine learning techniques such as Support Vector Machines, Random Forest, and k Nearest Neighbors using Dragon and MOE chemical descriptors. These models afforded high external prediction accuracies of 71–100% estimated by 5-fold external validation, and showed hit retrieval rates with up to 20-fold enrichment in the virtual screening of DrugBank compounds. The compendium of predictive QSAR models developed in this study can be used for virtual profiling of drug candidates and/or environmental agents with the optimal transporter profiles.
Keywords: membrane transport proteins, ADMET, drug transport, permeability, efflux
INTRODUCTION
Membrane transport proteins, such as ATP-binding cassette (ABC) superfamily and solute carrier (SLC) family members, are commonly present in all cellular organisms. Transporters are known to affect membrane permeability of many xenobiotic and endogenous chemicals by controlling their cellular influx or efflux (1). The importance of active transport proteins (such as P-glycoprotein) in multidrug resistance, pharmacokinetics and drug-drug interactions has long been recognized (2, 3). Membrane transporters are very diverse and ubiquitously expressed in all tissues and organs; ABC and SLC families only account for nearly 600 transport proteins in the human genome (4, 5). The true complexity of processes regulating permeability of small molecules across biological membranes become apparent when one considers interdependencies between membrane transporters as well as their interrelations with various metabolic systems (1, 6). Studying transporter interaction profiles for large series of chemicals represents an important challenge that can be critical both for understanding of the aforementioned complexity as well as for the optimization of ADMET properties to enhance drug discovery.
Several large-scale efforts have been initiated to systematically organize the growing body of the “transportome” data; examples include “TP-Search” (www.tp-search.jp) by Ozawa et al. (7), TCDB (www.tcdb.org) by Saier et al. (4), TransporterDB (www.membranetransport.org) described by Ren et al. (8), UCSF pharmacogenetics database (pharmacogenetics.ucsf.edu) reported by Giacomini et al. (5) and International Transporter Consortium (1). These databases attempt to capture rich and rapidly growing experimental data on chemical-transporter interactions; however, for the most part, the underlying data collections have not been curated, integrated and explored from cheminformatics prospective in the context of linking transporter data to explicitly represented chemical structure of tested molecules. Thus, the full potential of utilizing published transporter data in pharmaceutical research is yet to be realized (2).
Since three-dimensional structures of human transporter proteins remain unknown, various ligand-based modeling approaches, such as pharmacophore mapping, QSAR modeling, and three-dimensional ligand-alignment methods (CoMFA, CoMSIA), have been explored(9–12). To the best of our knowledge, no systematic modeling of intestinal transporters has been reported in the literature: most modeling studies were limited to individual transporters and mainly to the inhibition of transport. A brief overview of most recent modeling efforts is provided in Table I, with a focus on the data set size, type of the experimental activity and model’s external performance, if available.
Table I.
Representative computational models for intestinal transporters.
| Transporter | Model description | Performance a | Train/test set sizes | Refs. |
|---|---|---|---|---|
| MDR1 | Classification of substrates | 78% | 206/23 | (33) |
| 75% | 163/40 | (34) | ||
|
| ||||
| Classification of inhibitors at 15μM | 85% | 772/418 | (27) | |
| Classification of inhibitors (no cut-off) | 87% | 268/30 | (33) | |
|
| ||||
| BCRP | Classification of inhibitors at 50μM | 80% | 80/43 | (35) |
| Inhibition, IC50 | R2=0.63 | 28/13 | (28) | |
|
| ||||
| MRP2 | Binding affinity, Ki | R2=0.82 | 20/5 | (36) |
| Classification of inhibitors (no cut-off) | 74–77% | 257/61 | (37) | |
| Classification of inhibitors at 80μM | 72% | 79/39 | (38) | |
|
| ||||
| PEPT1 | Binding affinity, Ki | R2=0.72 | 76/38 | (39) |
| Q2=0.83 | 98/1 b | (11) | ||
| Classification of inhibitors at 1mM | 87% | 138/46 | (40) | |
|
| ||||
| ASBT | Inhibition, Ki | Q2=0.89 | 32/1 b | (41) |
| Classification of inhibitors at 100μM | 54–88% | 38/19–30 | (42) | |
|
| ||||
| MRP1 | Inhibitition, IC50 | Q2=0.68 | 60/20 | (43) |
| Classification of inhibitors at 0.25μM | 88% | 82/0 c | (44) | |
|
| ||||
| OCT1 | Classification of inhibitors at 100μM | 82–88% | 95/96 | (45) |
External validation performance (test set): for classification models CCR (%) is shown, R2 - coefficient of determination, Q2 – predictive squared correlation coefficient;
leave-one-out (LOO) validation;
only training set results are available.
In this study, we have compiled, integrated and curated all available transporter interaction data for small molecules focusing on major human intestinal transporters shown in Figure 1. The final curated database comprises 3,768 unique chemicals and their associated interaction data for 12 membrane transport proteins, making this data set, to the best of our knowledge, the largest collection of this kind in the public domain. Importantly, the entire database was curated at two different levels: first, to ensure correct representation of chemical structures, and second, to harmonize and assess reliability of experimental data. Using this data, we have developed a series of externally validated Quantitative Structure-Activity Relationship (QSAR) classification models of several individual transporters. These models can be used both individually and in concert; in the latter case, the entire compendium of models amounts to the QSAR-based virtual screening platform that can afford a reliable prediction of transporter interaction profiles of chemicals. We discuss the process of data collection and curation, QSAR model building and validation, and opportunities for facilitating drug discovery offered by this platform.
Figure 1.
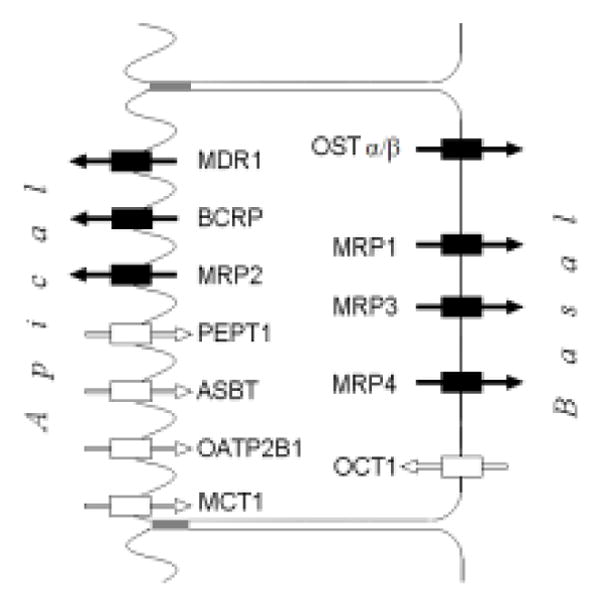
Localization of major intestinal transporters on enterocytes. Rectangles with arrows represent efflux (black) and influx (white) transporters.
MATERIALS AND METHODS
Experimental data curation
For each chemical, experimental data expressing its interaction with membrane transporters were collected from multiple available public sources (see Supplementary Results), then compared and harmonized into a single data record (see Supplementary Methods for the detailed procedure). Inhibitors were defined based on a potency threshold set to 10μM except for the PEPT1, OCT1, and OATP2B1 transporters, for which 100μM threshold was used due to lower levels of affinity of reported inhibitors. During the manual inspection, a probability-like substrate (inhibitor) score ranging from 0 to 1 was assigned to each compound to represent the likelihood of being a substrate (inhibitor), based on the quality and consistency of underlying data (scoring scheme description is provided in the Supplementary Methods). Substrate scores equal to 1 and 0 imply high-confidence substrate and non-substrate respectively, whereas a score of 0.5 indicates ambiguous data. Only data entries with substrate and inhibitor scores ≤0.1 or ≥0.9 were used for QSAR modeling (capturing about 80% of all entries).
Chemical structure curation
Chemical structures were standardized using PipelinePilot ver.6.15 (Accelrys) and the Standardizer module (ChemAxon) according to the guidelines we published recently (13). Briefly, entries with organometallic and poorly defined chemical structures (e.g., natural extracts, complex mixtures) were excluded. Remaining structures were standardized and converted into canonical tautomeric forms, with neutral representation and explicit hydrogens. In the case of stereoisomers, the one with the highest activity was retained. Moreover, based on molecular weight (MW) distribution (mean±SD of 450±233g/mol and median of 414g/mol, n =3768 compounds) we have excluded all outliers with MW higher than 1130g/mol (e.g., polymers, surfactants).
Transporter data sets
For each transporter, two binary classification data sets were prepared: substrates vs. non substrates (“substrate data sets”), and inhibitors vs. non-inhibitors (“inhibition data sets”). Substrate data sets of OST-α/β and MCT1, and inhibition data sets of OST-α/β and MRP3 were too small to enable statistically significant model development; therefore, they were not pursued here. Furthermore, because the number of reported non-substrates in the substrate data sets for MRP3, MRP4, and ASBT was too small, making the datasets extremely unbalanced, we sampled the passive diffusion data set of Hou et al.(14) to pick putative non-substrates. To ensure that selected compounds are likely to be non-substrates, we excluded ca. 170 molecules with some evidence of transport existing in our database. Then we chose molecules most chemically similar to experimentally known non-substrates from the remaining part of this dataset (472 molecules) (based on Tanimoto similarity coefficient (Tc) and MACCS structural keys, see Table II). Finally, because ASBT, PEPT1, MRP2 inhibition and PEPT1 substrate data sets were unbalanced (i.e., size difference between the two classes was 2–4 fold) and since such imbalance is known to result in poor QSAR models {Chawla, 2005 37/id}, down-sampling was required. For each of these data sets, we down-sampled the majority class by retaining only compounds most similar (by Tc on MACCS keys) to the minority class. All these final sets that were employed for QSAR modeling are shown in Table II.
Table II.
Intestinal transporters data sets for QSAR modeling.
| Transporter | Substrate data sets | Inhibition data sets | ||||
|---|---|---|---|---|---|---|
|
| ||||||
| Substrates a | Non-substrates | Tc b | Inhibitors c | Non-inhibitors | Tc | |
|
| ||||||
| BCRP | 76 | 70 | 0.73 | 167 | 215 | 0.76 |
| MDR1 | 294 | 250 | 0.71 | 743 | 828 | 0.80 |
| MRP2 | 101 | 87 | 0.69 | 48 | 48 | 0.77 |
|
| ||||||
| PEPT1 | 79 | 79 | 0.79 | 40 d | 40 | 0.81 |
| ASBT | 50 | 50 e | 0.82 | 75 | 75 | 0.82 |
| OATP2B1 | 30 | 23 | 0.61 | 70 d | 66 | 0.65 |
| OCT1 | 39 | 39 e | 0.61 | 87 d | 112 | 0.62 |
| MCT1 | - | - | - | 47 | 20 | 0.76 |
|
| ||||||
| MRP1 | 87 | 81 | 0.70 | 224 | 194 | 0.82 |
| MRP3 | 31 | 31 e | 0.67 | - | - | - |
| MRP4 | 46 | 46 e | 0.70 | 32 | 32 | 0.65 |
Substrates are compounds that are confirmed to be transported by respective protein.
Tc is the Tanimoto similarity coefficient (based on MACCS keys) averaged over all pairs of k-nearest neighbors (shown k=10 estimates local diversity, additional estimations are given in Supplementary Materials).
Inhibitors defined based on 10 M threshold (unless specified otherwise).
Inhibitors defined based on 100 M threshold.
Due to insufficient number of non-substrates, 22, 25, 37, and 42 assumed non-substrates (for MRP3, MRP4, OCT1 and ASBT, respectively) were sampled from the passive diffusion data set of Hou et al.(14), by Tanimoto similarity (on MACCS keys) to respective known non-substrates.
DrugBank library
373 unique medicinal chemicals in DrugBank3.0 (16) (www.drugbank.ca, last accessed on 01.15.2012) had 742 binary data entries (i.e., 294 “substrate” and 448 “inhibitor” flags) for the described intestinal transporters. Our collection contained 334 of these pharmaceuticals (~90%), and only 60 “substrate” and 63 “inhibitor” data entries were not included in it. Subsets of these new entries were used as “hits” for virtual screening against individual transporters, while those of the 373 drugs with no interaction data for particular transporter were used as its decoys (i.e., presumed “non-hits”). This yielded between 2–19 hits and 111 – 191 decoys per transporter (see Supplementary Table IX).
QSAR modeling
Molecular descriptors
Two sets of 2D chemical structural descriptors were computed independently: 2030 Dragon descriptors (constitutional, topological, functional group counts, atom-centered fragments, molecular properties, 2D binary and frequency fingerprints) using Dragon ver.5.5 (Talete SRL, Milano, Italy), and 185 2D MOE descriptors (surface areas, molecular properties) using MOE ver.2009.10 (Chemical Computing Group, Montreal, Canada). After removal of redundant descriptors, i.e., those with low variance (when for all but x compounds the descriptor values are constant, x < 5) and high correlation (if pairwise linear R2>0.99, one from the pair was randomly removed), there were 286–650 Dragon and 136–148 MOE descriptors remaining for various transporter data sets; these descriptors were range scaled from 0 to 1. Descriptor removal and scaling was done independently for each cross-validation fold.
Modeling workflow
We have employed several modeling techniques described below. Models were developed following the predictive QSAR modeling workflow (17) that includes several steps: (i) data preparation/analysis (selection of compounds and descriptors), (ii) model training, (iii) model validation/selection (e.g., n-fold cross-validation, Y-randomization, evaluation of model’s Applicability Domain), and (iv) application of the selected models to the external validation set compounds.
Five-fold external validation
To ensure that statistically significant and externally predictive classification QSAR models are generated (18), each transporter data set (see Table II) was divided, by random selection, into five nearly equal subsets. Setting one subset aside as external set (20%), the other four subsets (80%) were used for modeling following the above workflow; and the procedure was repeated five times such that each subset was employed as an external set for model validation once.
Modeling algorithms and metrics
Three modeling methods were applied independently: Random Forest (RF) (19) as implemented in R.2.7.1, k-Nearest Neighbors (kNN), (20) and Support Vector Machines (SVM) implemented within the internally developed WinSVM software based on libSVM core (21). The predictive power of QSAR models was characterized by the coverage (the fraction of compounds that received prediction, which is dictated by the applicability domain) and by associated correct classification rate (CCR = 0.5 sensitivity+0.5 specificity) for the covered compounds.
Robustness of QSAR models
Y-randomization (randomization of response) (22) was applied to randomly shuffle class labels of the modeling set, which was then used to derive “random” models, whose performance was evaluated on the external set. Model training procedure was the same as for modeling real data (including internal variable selection steps in case of RF and kNN methods). This randomization was repeated five times and the one-tailed t-test p-value was calculated, which is the probability to obtain the CCR value with the random models as high as in case of models built with real activities. If the “p-value < 0.05” condition was not satisfied, models built with the real data for this modeling set were considered not reliable and were discarded.
Applicability Domain (AD) of QSAR Models
A similarity threshold is introduced to avoid making classifications for compounds that differ substantially from the training set molecules. Briefly, the similarity threshold is defined based on the distribution of Euclidean distances between compounds in the modeling set:
| (1) |
Where <d> and σ are average and standard deviation, respectively, of distances taken between all pairs of nearest neighbors in the modeling set; z is a user-controlled parameter, which was set to 1.0 during external prediction. A more detailed description of applicability domain is available elsewhere (18).
RESULTS AND DISCUSSION
Figure 1 shows the localization of membrane transporters at enterocytes’ surface (1–3, 23). Both expression levels and affinity of these transporters could be significant and should thus be taken into account to decide which transporters to consider for intestinal drug uptake and efflux studies.
For the transporters shown in Figure 1 we have assembled over 3,700 unique chemical structures with reported substrate properties (i.e., Km, Kd, experimental evidence of transport) and/or inhibition data (IC50, Ki, % inhibition at a given concentration, etc.), in total, over 5,000 data entries (see Supplementary Results). The core of the collection (i.e., ~33% of all compounds) was based on the historical data (before 2007) from the “TP-search” database (7), while more recent reports were taken from ChEMBL (www.ebi.ac.uk/chembl/) and individual publications (see Supplementary Table II). The overview of the curated database, including its chemical composition and relative data content are shown in Figure 2. Drugs and related compounds (i.e., “drug candidate series”) constitute roughly half of the database, whereas the remaining portion is represented by naturally occurring chemicals (alkaloids, food ingredients, endogenous molecules, etc.) as well as by industrial and environmental compounds (e.g., pesticides, dyes, surfactants, reagents). The overall sparsity of the database is 88% (on average, one compound has interaction records with 1.75 transporters, see also Supplementary Fig. 1).
Figure 2.
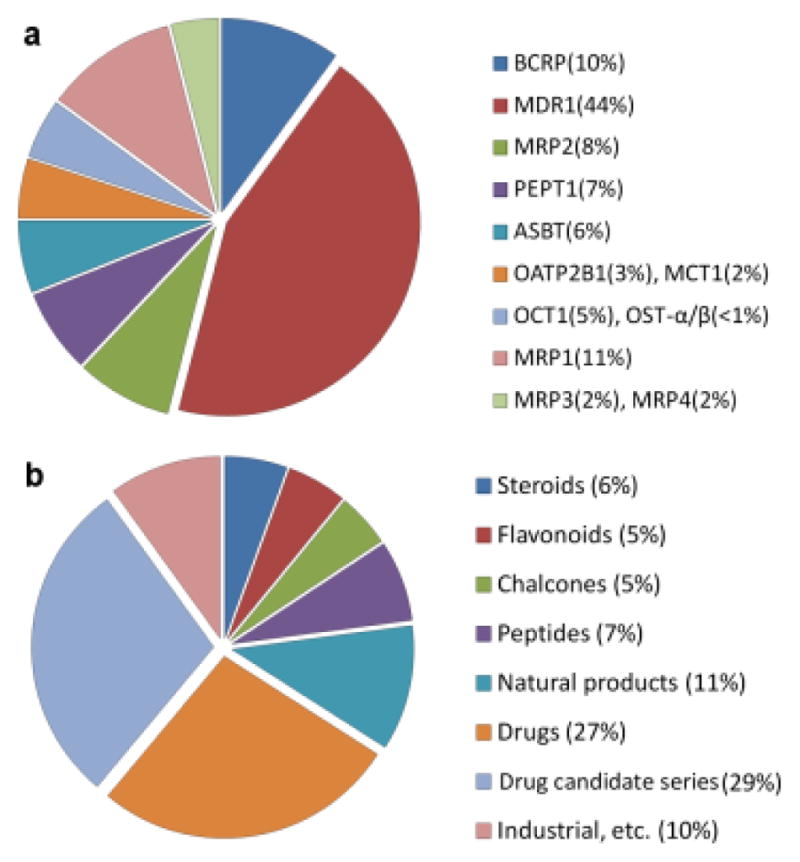
Relative data content by database entries per transporter (a) and chemical classes in the database (b).
Based on the assembled data, an estimate of overlap in substrate specificities between intestinal transporters can be obtained by examining subsets of compounds with completely defined substrate properties for the compared transporters (Fig. 3). Except for taurocholic acid (a substrate of both ASBT and OATP2B1), the influx transporters PEPT1, ASBT, and OATP2B1 did not share any common substrates in the database. All three major apical efflux transporters (Fig. 3a) have a substantial number of common substrates (see Supplementary Table IV). Interestingly, there were no explicit MDR1-specific substrates in the database (i.e., reported as non-substrates for MRP2 and BCRP). Likewise, the basal efflux transporters MRP1 and MRP3 have 19 common substrates, the only diverging compounds were Glyburide, as MRP3 substrate, and dehydroepiandrosterone-3-sulfate and glutathione, as MRP1 substrates (see Supplementary Results). A broader review describing substrates of ABC-transporters can be found in the study by Marquez et al(2).
Figure 3.
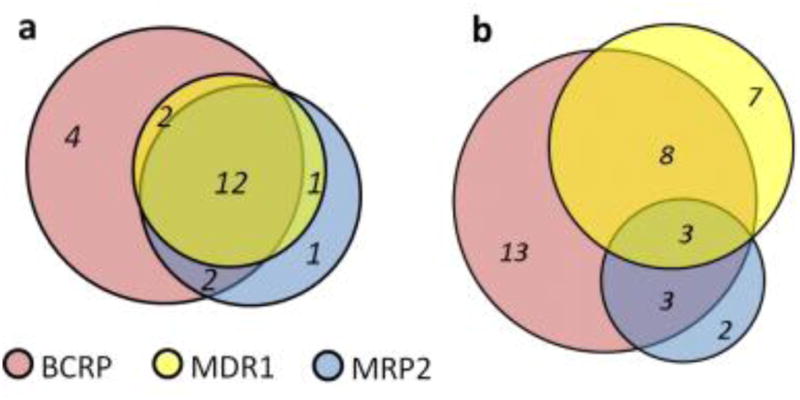
Overlap in known substrates (a) and inhibitors (b) of efflux transporters on the apical side.
In Supplementary Table V, we characterize substrates by the direction of their transport (e.g., a substrate of any of the influx transporters would be marked as “influx substrate”; see Fig. 1). The interplay between different groups of transporters can be viewed as a significant factor in deciding the net flux of the compound, which is particularly relevant in case of the permeability experiments in cell monolayers (24).
Likewise, the analysis of selective inhibitors is shown in Figure 3b for the apical efflux transporters MDR1, BCRP, and MRP2 (at 10μM potency threshold). A recent study by Matsson et al (25) provides MDR1/BCRP/MRP2 comparison based on inhibition profiles of 122 drugs screened at 50μM threshold. Based on these 122 drugs the authors also developed multivariate classification models for MDR1, BCRP, and MRP2 inhibition with balanced accuracy (CCR) values in 77–83% range both for training and test sets.
For the basal efflux transporters MRP1 and MRP3, we found 18 inhibitors of both and only three selective inhibitors: nevirapine as MRP3-selective, and benzbromarone and indomethacin as MRP1-selective. Among the apical influx transporters only ASBT and OATP2B1 had some overlap in their inhibition data: the statins mevastatin, simvastatin and lovastatin were ASBT-selective, bromosulfophthalein was OATP2B1-selective, while latanoprost and indomethacin were inhibitors of both (see Supplementary Results).
While the interpretation of substrate selectivity is generally straightforward, the analysis of selective inhibitors can be complicated due to multiple possible mechanisms. Inhibition may occur by direct binding to active or allosteric sites, or by indirect depletion of required endogenous agents (e.g., ATP, glutathione, H+). Given that, the above selectivity comparisons testify to the general lack of known selective substrates and inhibitors (especially for less studied transporters) that could serve as specific molecular probes in biological studies.
As shown in Table I, there are several critical limitations for transporter modeling: limited availability of data, especially substrates; data compatibility issues (e.g., experimental values from different assay conditions), which limit quantitative modeling to small congeneric data sets; and apparent lack of standards in defining inhibitors for classification modeling (i.e., different cell lines and various threshold concentrations used for classifying inhibitors). We have addressed the above issues by compiling and manually curating the present intestinal transporter database (see Methods) in line with previously published guidelines (24, 26, 27). Moreover, to define inhibitors, we chose a 10μM threshold as our standard, as it is physiologically more relevant than higher concentrations (1) and is often adopted for in vitro screening (28, 29); we chose a 100μM threshold for PEPT1, a low-affinity influx transporter, located on the apical side and exposed to high concentrations of ingested chemicals (10). Moreover, 100μM threshold was also used for OATP2B1 and for OCT1, because, as in case of PEPT1, these transporters have very few potent inhibitors reported. Consequently, eleven transporters (MDR1, BCRP, MRP1-4, PEPT1, ASBT, OATP2B1, OCT1, MCT1) listed in Table II had sufficient data for building statistically significant classification QSAR models. A recent work of Broccatelli et al.(27) provides another example of constructing a large classification data set (Table I) from multiple sources, where different endpoints and experimental conditions are employed.
The same modeling approach was applied to each data set in Table II, i.e., using two descriptor sets (Dragon and MOE) and three modeling methods (kNN, SVM, and Random Forest), six types of models in total were developed. Importantly, the five-external cross-validation splits were kept the same for the proper comparison of these six types of models. A uniform study design is essential in order to obtain standardized QSAR models for individual transporters. We speculate that a set of standardized models employed in consensus fashion for external prediction is expected to be more robust when predicting entire transporter interaction profiles, and as such, ultimately, more relevant to experimental data of higher complexity, such as permeability assays in cell monolayers, oral absorption and pharmacokinetics.
The external validation results are shown in Table III. All transporter models achieved CCR in the range of 71–98% and were significantly better than the Y-randomization models (p-value < 0.05 by one-tailed t-test, n=5), except for several models of PEPT1 and MRP4 inhibition as well as OATP2B1 substrate. Most likely, especially for the two latter cases, these unsatisfactory results were due to very small and diverse data sets employed for model development (Table II). Overall, transporter models developed with Dragon descriptors achieved similar external prediction accuracy as those based on MOE descriptors, despite the smaller size of the MOE descriptor set. Very high external accuracy was observed for the ASBT and MRP3 transporters (CCR=88–98%); this is likely due to limited diversity of their substrates, many of which are bile acid derivatives. Similarly, the MDR1 and MRP1 inhibition data sets that are less diverse than other transporters (Tc =0.80–0.82; Table II) exhibit higher external performance (CCR=84–92%; Table III). The PEPT1 inhibition data set is a notable exception from this trend, showing poor accuracy (CCR=56–75%) for a dataset including compounds with comparably high degree of structural similarity (Tanimoto coefficient, Tc =0.81; Table II). High external accuracy of MCT1 inhibition model is likely too optimistic due to the small data set and rather congeneric set of actives (most are thienopyrimidine analogues (30)). Direct comparison of our models with those published previously (Table I) is difficult due to differences in the endpoint definitions, in the size of the employed data sets and in the validation procedure. We can only remark that most of the models listed in Table I have reported accuracy of 72–88%, which is comparable with the performance range of our models. However, our models are based on larger datasets, more consistent in their endpoint definitions, and were subjected to the same validation procedure.
Table III.
External validation results (CCR, %) for transporter models. a
| Dragon descriptors | MOE descriptors | Consensus | Cover age, % | |||||
|---|---|---|---|---|---|---|---|---|
|
| ||||||||
| Transporter | kNN | RF | SVM | kNN | RF | SVM | ||
|
| ||||||||
| Substrate data sets | ||||||||
|
| ||||||||
| BCRP | 76±9 | 75±9 | 79±6 | 78±3 | 77±8 | 79±7 | 80±7 | 76 |
| MDR1 | 73±3 | 72±2 | 71±1 | 74±3 | 75±4 | 68±3 | 76±2 | 82 |
| MRP2 | 86±8 | 86±10 | 84±8 | 85±7 | 85±6 | 87±9 | 87±8 | 76 |
|
| ||||||||
| PEPT1 | 80±6 | 82±10 | 77±8 | 76±6 | 78±11 | 77±6 | 84±9 | 81 |
| ASBT | 87±2 | 90±3 | 86±9 | 94±6 | 92±5 | 93±4 | 93±4 | 84 |
| OATP2B1 | 64±12b | 75±12 | 63±13b | 75±15 | 72±17 | 68±13 | 75±14 | 83 |
| OCT1 | 85±11 | 85±9 | 89±7 | 80±15 | 77±12 | 84±11 | 89±6 | 83 |
|
| ||||||||
| MRP1 | 90±2 | 90±4 | 86±10 | 88±4 | 88±6 | 87±3 | 91±2 | 82 |
| MRP3 | 97±4 | 97±4 | 98±3 | 96±8 | 89±7 | 94±8 | 98±3 | 84 |
| MRP4 | 87±8 | 81±14 | 89±5 | 85±4 | 87±8 | 86±5 | 92±5 | 82 |
|
| ||||||||
| Inhibition data sets | ||||||||
|
| ||||||||
| BCRP | 80±5 | 79±4 | 80±3 | 78±7 | 80±3 | 80±5 | 83±4 | 78 |
| MDR1 | 90±2 | 91±1 | 90±2 | 92±2 | 92±2 | 92±1 | 94±1 | 89 |
| MRP2 | 84±11 | 89±8 | 87±9 | 82±15 | 85±13 | 87±6 | 89±9 | 90 |
|
| ||||||||
| PEPT1 | 69±15 | 62±15b | 75±6 | 56±11b | 67±6 | 72±11 | 72±15 | 75 |
| ASBT | 88±6 | 88±6 | 85±5 | 88±4 | 88±3 | 86±6 | 92±5 | 79 |
| OATP2B1 | 79±9 | 78±11 | 76±10 | 77±9 | 79±6 | 77±7 | 80±6 | 72 |
| OCT1 | 87±6 | 90±7 | 90±5 | 86±6 | 89±6 | 83±7 | 92±6 | 79 |
| MCT1 | 100±0 | 100±0 | 100±0 | 100±0 | 100±0 | 100±0 | 100±0 | 84 |
|
| ||||||||
| MRP1 | 86±5 | 87±4 | 84±6 | 86±3 | 87±4 | 84±1 | 90±4 | 84 |
| MRP4 | 61±13b | 62±10b | 67±11 | 58±9b | 62±7 | 63±15b | 70±8 | 81 |
These results are mean±st.dev across 5 cross-validation folds; consensus results (of kNN, RF, and SVM) were based only on those compounds, predicted at least with 60% agreement by the models of that transporter type (i.e., 60% consensus activity threshold); CCRs are shown for the covered fractions of the respective datasets; “Coverage” column is for consensus, prediction coverage of individual models was 80–90% (except MRP3 with 76%) due to the applicability domain restriction (see Methods); all models were significantly better than y-randomized models (one-tailed t-test at α= 0.05, see Methods) except if denoted otherwise;
not significant.
We have also analyzed the overall agreement between the transporter models of the same kind (i.e., all models built for the same target property, but with different descriptors and/or modeling techniques). Resulting consensus prediction (Table III) shows even higher accuracy of CCR=76–100% (and CCR=70–75% for the outliers PEPT1, MRP4, and OATP2B1 that were discussed above), but at the expense of reduced prediction coverage (72–90%). Most of the prediction errors in the above consensus (Table III) are the cases of so-called “activity cliffs”(31), when structurally very similar compounds belong to opposite activity classes; when such a pair of compounds is split between modeling and external test sets, this usually leads to misprediction. Examples of some activity cliffs in the substrate transporter data sets are given in Supplementary Table VI. Activity cliffs can point to unreliable experimental data (13), they can also indicate problematic areas in the chemical space where more compounds are needed for proper representation and model training. Therefore, the models from all the cross-validation folds have to be used to ensure that each compound in the activity cliff has a chance to affect the prediction outcome; for the test compounds that fall near activity cliffs, averaging across the cross-validation models will usually result in a marginal (low-confidence) prediction.
As can be seen from the overview of the literature (Table II), while the MDR1 transporter is historically the most studied target, some models for other transporters in this study are realized for the first time, such as substrate classification models for BCRP and MRP1-4 transporters. Overall, most of the transporter data sets are sufficiently diverse (Table II) to ensure broad applicability of the corresponding models (i.e., high prediction coverage as seen in Tables 3–4). Moreover, since drugs and drug-like derivatives constitute around 70% of the transporter database (Fig. 2), we expect that the majority of drug-like compounds should be covered by the transporter models presented in this study.
Certain insights into the structural composition of compounds that makes them more susceptible to be substrates or inhibitors of particular transporters can be obtained from the analysis of important descriptors in the respective models. As a representative case of such analysis, descriptors most frequently used in kNN models (with z-score > 2.0 for normalized frequency, see Supplementary Methods) are summarized in Supplementary Table VII. Because important descriptors may still substantially correlate to a different degree for different data sets, we have further mapped these descriptors (both MOE and Dragon), based on our understanding, onto several broader structural features as shown in Figure 4. For example, nCrq and C-004 Dragon descriptors that represent quaternary carbon have high relevance to ASBT transporter, as they mostly reflect the steroid scaffold of bile acids.
Figure 4.
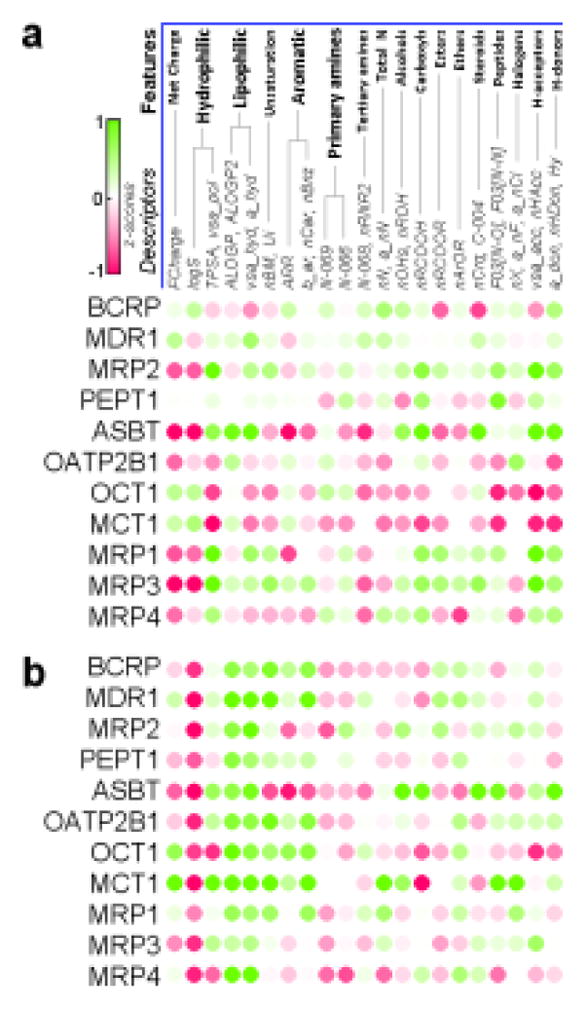
Structural profiles of intestinal transporters for substrate (a) and inhibition (b) datasets. Green color represents descriptors with higher values in the active class, red – in the inactive class. Two datasets, MCT1 (in a) and MRP3 (in b), have too few compounds (31 and 36, respectively) and were not used for modeling.
Although several prior studies (9, 10, 32) investigated structural constraints for individual transporters, a systematic comparison of such constraints across multiple transporters has not been undertaken. Here we attempt to address this question by constructing the profiles of important structural clues (Fig. 4), which provide a useful summary of structural and physicochemical property requirements for different transporters. Our observations reflect some of the earlier established facts, such as hydrophobicity of MDR1 binding pocket and importance of conjugation groups for MRP transporters. In case of BCRP substrates, the presence of nitrogen as well as other potential hydrogen-bond donors (such as hydroxyls and carboxyls, Fig. 4) highlights the importance of hydrogen-bonding interactions (9). Net charge (Fig. 4, calculated at pH=7.4) well corresponds to characterized endogenous substrates of respective transporters (e.g., organic cations for OCT1, bile acids for ASBT), while in case of MCT1 many non-substrates are polycarboxylates that have greater negative charge than monocarboxylic substrates.
To additionally evaluate performance of the derived transporter models we have tested them on those compounds of DrugBank3.0 database (16) that had relevant transporter data, but were not used in deriving the corresponding transporter models (see Methods). Briefly, each model was applied to its own corresponding virtual screening set, whose compounds were ranked by predicted values (see Supplementary Fig. 2). These rank lists were then concatenated to create two “total” lists: one for substrates and another for inhibitors. The overall distribution of hits in these lists was then estimated by the ROC curve (see Fig. 5). Notably, substrates are better retrieved than inhibitors both overall (AUCs of 0.70±0.02 vs. 0.65±0.02), and in the top few percent of the screened lists: 20- vs. 9-fold in the top 0.5% and 12- vs. 5-fold in the top 1%, respectively (see Supplementary Table VIII). This is likely due to absence of potency data for DrugBank compounds labeled as “inhibitors”, which, consequently, may or may not correspond to the potency thresholds of the inhibition models developed in this study. Nevertheless, the overall high performance demonstrated on the DrugBank collection indicates that these transporter models can be useful as a virtual screening panel for practical applications. It would be especially interesting to apply them in search for new molecular probes (inhibitors or substrates) with desired selectivity profiles.
Figure 5.
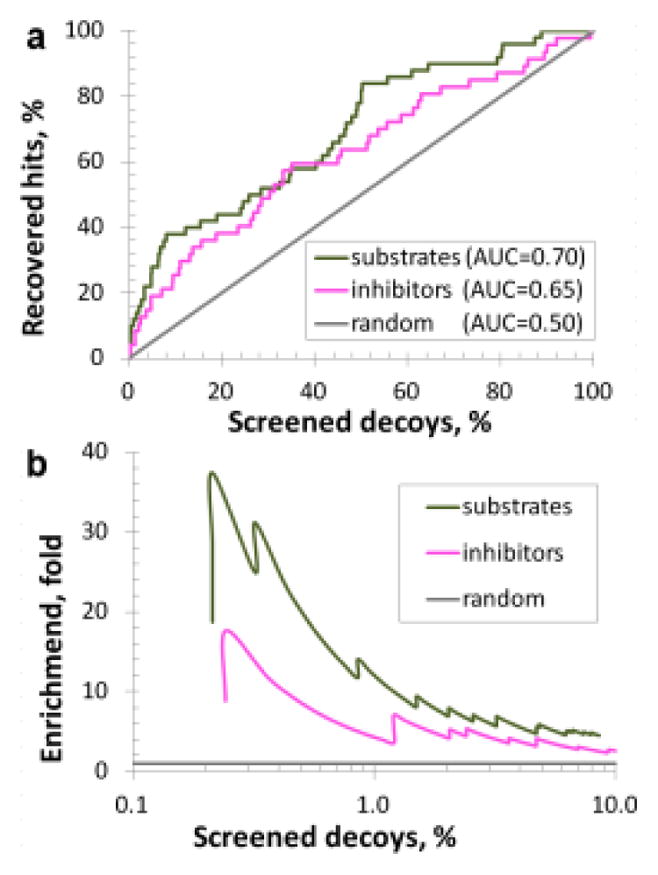
Cumulative (a) and early (b) enrichment of hits in the virtual screening of DrugBank compounds, green curve represents retrieval of substrate hits, magenta–inhibitor hits, gray – expected performance by random guess.
CONCLUSION
We envision several promising directions for the integrative modeling of intestinal transporters. One future approach could be based on developing “unilateral” substrate models, representing all transporters working in the same direction, such as apical efflux, apical influx, or basal efflux (see Fig. 1). However, proper scaling of the active transport contribution to overall intestinal permeability (in comparison to passive diffusion component) will require knowledge of transporters’ differential expression and accurate prediction of binding affinities for each transporter-compound pair. Another interesting approach to consider is multi-task learning, a joint model training of related transporters, which could afford acceptable models for the underrepresented transporters. Considering the complexity of in vivo drug transporter interactions, it is likely that the significant role of a particular transporter may not be easily unraveled without simultaneous consideration of its partners and competitors. Therefore, prediction profiles from key individual transporter models could be employed as new inputs in the modeling of higher-order endpoints, such as cells monolayer permeability, intestinal absorption, and oral bioavailability.
This study describes the largest published collection of extensively curated data on interactions of small molecules with human intestinal transporters up-to-date. The database comprises many pharmaceutically important classes of chemicals (Fig. 2) and has an important and independent value for all researchers interested in drug transporters. Combinatorial QSAR modeling (i.e., different descriptor sets combined with different machine learning methods) in this study resulted in the externally predictive panel of transporter models (MDR1, BCRP, MRP1-4, PEPT1, ABST, OATP2B1, OCT1 and MCT1), which were either entirely novel or based on larger data sets than any previous studies (cf. Tables 1 and 2). Substrates vs. non-substrates classification QSAR models for the ten transporters (Table III) had external 5-fold prediction accuracy of 63–98% with 76–90% prediction set coverage. Inhibitors vs. non-inhibitors classification models for eight transporters (except poorly performing MRP4 and PEPT1) showed 76–100% accuracy and 80–90% coverage. The consensus of the QSAR models built for the same target property led to further improvement in the prediction accuracy (Table III) to 75–98% at 76–84% coverage for the substrate models and to 70–100% at 72–90% coverage for the inhibition models. Moreover, these transporter models were successful in retrieving substrate and inhibitor hits during virtual screening of DrugBank compounds (Supplementary Tables VIII–IX).
In summary, we have developed the largest publicly available human intestinal transporter database and an associated panel of individual transporter models forming a unique virtual transportome. This panel of models that we plan to update and enlarge when additional data becomes available can be employed as a useful tool for predicting compound interaction profiles with major intestinal transporters. The knowledge of such profiles should be helpful for selecting viable drug candidates from libraries of bioactive compounds. Furthermore, these profiles could serve as valuable inputs for modeling higher-order ADMET effects mediated by complex transporter interactions. All data and models discussed in this study will be publicly released via Chembench web portal established at UNC (cheembench.mml.unc.edu).
Supplementary Material
Acknowledgments
We thank Dr. Tingjun Hou (University of California at San Diego, USA) and Dr. Kazuya Maeda (The University of Tokyo, Japan) for sharing their data, Dr. Dhiren Thakker, Dr. Kim Brouwer and Kathleen Köck (all - University of North Carolina at Chapel Hill, USA), Dr. Alexander Böcker and Dr. Sanjay Srivastava (Boehringer Ingelheim (Canada) Ltd) for helpful discussions, Dr. Nancy Baker for her assistance with ChemoText, and Dr. Fabio Broccatelli (University of Perugio, Italy) for the comments on MDR1 inhibition. This work was supported, in part, by grants from NIH (GM66940 and R21GM076059), The Johns Hopkins Center for Alternatives to Animal Testing (20011-21) and Boehringer Ingelheim (Canada) Ltd.
ABBREVIATIONS
- ABC transporters
ATP binding cassette family of transporters
- ADMET
Absorption, distribution, metabolism, excretion, toxicity
- ASBT
Apical sodium-dependent bile acid transporter
- AUC
Area under curve
- BCRP
Breast cancer resistance protein
- CCR
Correct classification rate
- kNN
k nearest neighbors
- MCT1
Monocarboxylate transporter 1
- MDR1
Multidrug resistance protein 1
- MRP1-4
Multidrug resistance-associated proteins 1-4
- MW
Molecular weight
- OATP2B1
Organic anion transporting polypeptide 2B1
- OCT1
Organic cation transporter 1
- OST-α/β
Organic solute transporter alpha/beta
- PEPT1
Peptide transporter 1
- QSAR
Quantitative structure-activity relationships
- RF
Random forest
- ROC
Receiver operating characteristic
- SAR
Structure-activity relationship
- SLC transporters
Solute carrier family of transporters
- SVM
Support vector machines
- Tc
Tanimoto (similarity) coefficient
- VS
Virtual screening
References
- 1.Giacomini KM, Huang SM, Tweedie DJ, Benet LZ, Brouwer KLR, Chu X, et al. Membrane transporters in drug development. Nat Rev Drug Discovery. 2010;9:215–236. doi: 10.1038/nrd3028. [DOI] [PMC free article] [PubMed] [Google Scholar]
- 2.Marquez B, Van Bambeke F. ABC multidrug transporters: target for modulation of drug pharmacokinetics and drug-drug interactions. Curr Drug Targets. 2011;12:600–620. doi: 10.2174/138945011795378504. [DOI] [PubMed] [Google Scholar]
- 3.Shugarts S, Benet LZ. The role of transporters in the pharmacokinetics of orally administered drugs. Pharm Res. 2009;26:2039–2054. doi: 10.1007/s11095-009-9924-0. [DOI] [PMC free article] [PubMed] [Google Scholar]
- 4.Saier MH, Jr, Yen MR, Noto K, Tamang DG, Elkan C. The transporter classification database: recent advances. Nucleic Acids Res. 2009;37:D274–D278. doi: 10.1093/nar/gkn862. [DOI] [PMC free article] [PubMed] [Google Scholar]
- 5.Yee SW, Chen L, Giacomini KM. Pharmacogenomics of membrane transporters: past, present and future. Pharmacogenomics. 2010;11:475–479. doi: 10.2217/pgs.10.22. [DOI] [PMC free article] [PubMed] [Google Scholar]
- 6.Sarkadi B, Szakacs G. Understanding transport through pharmacological barriers--are we there yet? Nat Rev Drug Discov. 2010;9:897–898. doi: 10.1038/nrd3187-c1. [DOI] [PubMed] [Google Scholar]
- 7.Ozawa N, Shimizu T, Morita R, Yokono Y, Ochiai T, Munesada K, et al. Transporter database, TP-Search: a web-accessible comprehensive database for research in pharmacokinetics of drugs. Pharm Res. 2004;21:2133–2134. doi: 10.1023/b:pham.0000048207.11160.d0. [DOI] [PubMed] [Google Scholar]
- 8.Ren Q, Chen K, Paulsen IT. TransportDB: a comprehensive database resource for cytoplasmic membrane transport systems and outer membrane channels. Nucleic Acids Res. 2007;35:D274–D279. doi: 10.1093/nar/gkl925. [DOI] [PMC free article] [PubMed] [Google Scholar]
- 9.Gandhi YA, Morris ME. Structure-activity relationships and quantitative structure-activity relationships for breast cancer resistance protein (ABCG2) AAPS J. 2009;11:541–552. doi: 10.1208/s12248-009-9132-1. [DOI] [PMC free article] [PubMed] [Google Scholar]
- 10.Vig BS, Stouch TR, Timoszyk JK, Quan Y, Wall DA, Smith RL, Faria TN. Human PEPT1 pharmacophore distinguishes between dipeptide transport and binding. J Med Chem. 2006;49:3636–3644. doi: 10.1021/jm0511029. [DOI] [PubMed] [Google Scholar]
- 11.Biegel A, Gebauer S, Hartrodt B, Brandsch M, Neubert K, Thondorf I. Three-dimensional quantitative structure-activity relationship analyses of beta-lactam antibiotics and tripeptides as substrates of the mammalian H+/peptide cotransporter PEPT1. J Med Chem. 2005;48:4410–4419. doi: 10.1021/jm048982w. [DOI] [PubMed] [Google Scholar]
- 12.Chang C, Swaan PW. Computational approaches to modeling drug transporters. Eur J Pharm Sci. 2006;27:411–424. doi: 10.1016/j.ejps.2005.09.013. [DOI] [PubMed] [Google Scholar]
- 13.Fourches D, Muratov E, Tropsha A. Trust, but verify: on the importance of chemical structure curation in cheminformatics and QSAR modeling research. J Chem Inf Model. 2010;50:1189–1204. doi: 10.1021/ci100176x. [DOI] [PMC free article] [PubMed] [Google Scholar]
- 14.Hou T, Wang J, Zhang W, Xu X. ADME evaluation in drug discovery. 7. Prediction of oral absorption by correlation and classification. J Chem Inf Model. 2007;47:208–218. doi: 10.1021/ci600343x. [DOI] [PubMed] [Google Scholar]
- 15.Chawla NV. Data mining for imbalanced datasets: an overview. In: Rokach L, Maimon O, editors. The data mining and knowledge discovery handbook. New York: Springer US; 2005. pp. 853–867. [Google Scholar]
- 16.Knox C, Law V, Jewison T, Liu P, Ly S, Frolkis A, et al. DrugBank 3.0: a comprehensive resource for ‘omics’ research on drugs. Nucleic Acids Res. 2011;39:D1035–D1041. doi: 10.1093/nar/gkq1126. [DOI] [PMC free article] [PubMed] [Google Scholar]
- 17.Tropsha A. Best practices for QSAR model development, validation, and exploitation. Mol Inf. 2010;29:476–488. doi: 10.1002/minf.201000061. [DOI] [PubMed] [Google Scholar]
- 18.Tropsha A, Golbraikh A. Predictive QSAR modeling workflow, model applicability domains, and virtual screening. Curr Pharm Des. 2007;13:3494–3504. doi: 10.2174/138161207782794257. [DOI] [PubMed] [Google Scholar]
- 19.Breiman L. Random Forests. Machine learning. 2001;41:5–32. [Google Scholar]
- 20.Shen M, LeTiran A, Xiao Y, Golbraikh A, Kohn H, Tropsha A. Quantitative structure-activity relationship analysis of functionalized amino acid anticonvulsant agents using k nearest neighbor and simulated annealing PLS methods. J Med Chem. 2002;45:2811–2823. doi: 10.1021/jm010488u. [DOI] [PubMed] [Google Scholar]
- 21.Chang C, Lin C. LIBSVM. ACM transactions on intelligent systems and technology. 2011;2:1–39. [Google Scholar]
- 22.Ruecker C, Ruecker G, Meringer M. y-Randomization and its variants in QSPR/QSAR. J Chem Inf Model. 2007;47:2345–2357. doi: 10.1021/ci700157b. [DOI] [PubMed] [Google Scholar]
- 23.Ming X, Thakker DR. Role of basolateral efflux transporter MRP4 in the intestinal absorption of the antiviral drug adefovir dipivoxil. Biochem Pharmacol. 2010;79:455–462. doi: 10.1016/j.bcp.2009.08.029. [DOI] [PubMed] [Google Scholar]
- 24.Jin H, Di L. Permeability--in vitro assays for assessing drug transporter activity. Curr Drug Metab. 2008;9:911–920. doi: 10.2174/138920008786485056. [DOI] [PubMed] [Google Scholar]
- 25.Matsson P, Pedersen JM, Norinder U, Bergstroem C, Artursson P. Identification of novel specific and general inhibitors of the three major human ATP-binding cassette transporters P-gp, BCRP and MRP2 among registered drugs. Pharm Res. 2009;26:1816–1831. doi: 10.1007/s11095-009-9896-0. [DOI] [PubMed] [Google Scholar]
- 26.Polli JW, Wring SA, Humphreys JE, Huang L, Morgan JB, Webster LO, et al. Rational use of in vitro P-glycoprotein assays in drug discovery. J Pharmacol Exp Ther. 2001;299:620–628. [PubMed] [Google Scholar]
- 27.Broccatelli F, Carosati E, Neri A, Frosini M, Goracci L, Oprea TI, et al. Novel approach for predicting P-glycoprotein (ABCB1) inhibition using molecular interaction fields. J Med Chem. 2011;54:1740–1751. doi: 10.1021/jm101421d. [DOI] [PMC free article] [PubMed] [Google Scholar]
- 28.Pick A, Mueller H, Mayer R, Haenisch B, Pajeva IK, Weigt M, et al. Structure-activity relationships of flavonoids as inhibitors of breast cancer resistance protein (BCRP) Bioorg Med Chem. 2011;19:2090–2102. doi: 10.1016/j.bmc.2010.12.043. [DOI] [PubMed] [Google Scholar]
- 29.Weiss J, Theile D, Ketabi-Kiyanvash N, Lindenmaier H, Haefeli WE. Inhibition of MRP1/ABCC1, MRP2/ABCC2, and MRP3/ABCC3 by nucleoside, nucleotide, and non-nucleoside reverse transcriptase inhibitors. Drug Metab Dispos. 2007;35:340–344. doi: 10.1124/dmd.106.012765. [DOI] [PubMed] [Google Scholar]
- 30.Murray CM, Hutchinson R, Bantick JR, Belfield GP, Benjamin AD, Brazma D, et al. Monocarboxylate transporter MCT1 is a target for immunosuppression. Nat Chem Biol. 2005;1:371–376. doi: 10.1038/nchembio744. [DOI] [PubMed] [Google Scholar]
- 31.Maggiora GM. On outliers and activity cliffs--why QSAR often disappoints. J Chem Inf Model. 2006;46:1535. doi: 10.1021/ci060117s. [DOI] [PubMed] [Google Scholar]
- 32.Chang C, Ekins S, Bahadduri P, Swaan PW. Pharmacophore-based discovery of ligands for drug transporters. Adv Drug Delivery Rev. 2006;58:1431–1450. doi: 10.1016/j.addr.2006.09.006. [DOI] [PMC free article] [PubMed] [Google Scholar]
- 33.Hammann F, Gutmann H, Jecklin U, Maunz A, Helma C, Drewe J. Development of decision tree models for substrates, inhibitors, and inducers of P-glycoprotein. Curr Drug Metab. 2009;10:339–346. doi: 10.2174/138920009788499021. [DOI] [PubMed] [Google Scholar]
- 34.Cabrera MA, Gonzalez I, Fernandez C, Navarro C, Bermejo M. A topological substructural approach for the prediction of P-glycoprotein substrates. J Pharm Sci. 2006;95:589–606. doi: 10.1002/jps.20449. [DOI] [PubMed] [Google Scholar]
- 35.Matsson P, Englund G, Ahlin G, Bergstroem C, Norinder U, Artursson P. A global drug inhibition pattern for the human ATP-binding cassette transporter breast cancer resistance protein (ABCG2) J Pharmacol Exp Ther. 2007;323:19–30. doi: 10.1124/jpet.107.124768. [DOI] [PubMed] [Google Scholar]
- 36.Ng C, Xiao YD, Lum BL, Han YH. Quantitative structure-activity relationships of methotrexate and methotrexate analogues transported by the rat multispecific resistance-associated protein 2 (rMrp2) Eur J Pharm Sci. 2005;26:405–413. doi: 10.1016/j.ejps.2005.07.008. [DOI] [PubMed] [Google Scholar]
- 37.Zhang H, Xiang ML, Zhao YL, Wei YQ, Yang SY. Support vector machine and pharmacophore-based prediction models of multidrug-resistance protein 2 (MRP2) inhibitors. Eur J Pharm Sci. 2009;36:451–457. doi: 10.1016/j.ejps.2008.11.014. [DOI] [PubMed] [Google Scholar]
- 38.Pedersen JM, Matsson P, Bergstroem C, Norinder U, Hoogstraate J, Artursson P. Prediction and identification of drug interactions with the human ATP-binding cassette transporter multidrug-resistance associated protein 2 (MRP2; ABCC2) J Med Chem. 2008;51:3275–3287. doi: 10.1021/jm7015683. [DOI] [PubMed] [Google Scholar]
- 39.Larsen SB, Jorgensen FS, Olsen L. QSAR Models for the Human H+/peptide symporter, hPEPT1: affinity prediction using alignment-independent descriptors. J Chem Inf Model. 2008;48:233–241. doi: 10.1021/ci700346y. [DOI] [PubMed] [Google Scholar]
- 40.Kamphorst J, Cucurull-Sanchez L, Jones B. A performance evaluation of multiple classification models of human PEPT1 inhibitors and non-inhibitors. QSAR Comb Sci. 2007;26:220–226. [Google Scholar]
- 41.Rais R, Acharya C, Tririya G, MacKerell AD, Jr, Polli JE. Molecular switch controlling the binding of anionic bile acid conjugates to human apical sodium-dependent bile acid transporter. J Med Chem. 2010;53:4749–4760. doi: 10.1021/jm1003683. [DOI] [PMC free article] [PubMed] [Google Scholar]
- 42.Zheng X, Ekins S, Raufman JP, Polli JE. Computational models for drug inhibition of the human apical sodium-dependent bile acid transporter. Mol Pharmaceutics. 2009;6:1591–1603. doi: 10.1021/mp900163d. [DOI] [PMC free article] [PubMed] [Google Scholar]
- 43.Tawari NR, Bag S, Degani MS. Pharmacophore mapping of a series of pyrrolopyrimidines, indolopyrimidines and their congeners as multidrug-resistance-associated protein (MRP1) modulators. J Mol Model. 2008;14:911–921. doi: 10.1007/s00894-008-0330-z. [DOI] [PubMed] [Google Scholar]
- 44.Lather V, Madan AK. Topological model for the prediction of MRP1 inhibitory activity of pyrrolopyrimidines and templates derived from pyrrolopyrimidine. Bioorg Med Chem Lett. 2005;15:4967–4972. doi: 10.1016/j.bmcl.2005.08.011. [DOI] [PubMed] [Google Scholar]
- 45.Ahlin G, Karlsson J, Pedersen JM, Gustavsson L, Larsson R, Matsson P, et al. Structural requirements for drug inhibition of the liver specific human organic cation transport protein 1. J Med Chem. 2008;51:5932–5942. doi: 10.1021/jm8003152. [DOI] [PubMed] [Google Scholar]
Associated Data
This section collects any data citations, data availability statements, or supplementary materials included in this article.