Abstract
The effect of subglottic stenosis on vocal fold vibration is investigated. An idealized stenosis is defined, parameterized, and incorporated into a two-dimensional, fully-coupled finite element model of the vocal folds and laryngeal airway. Flow-induced responses of the vocal fold model to varying severities of stenosis are compared. The model vibration was not appreciably affected by stenosis severities of up to 60% occlusion. Model vibration was altered by stenosis severities of 90% or greater, evidenced by decreased superior model displacement, glottal width amplitude, and flow rate amplitude. Predictions of vibration frequency and maximum flow declination rate were also altered by high stenosis severities. The observed changes became more pronounced with increasing stenosis severity and inlet pressure, and the trends correlated well with flow resistance calculations. Flow visualization was used to characterize subglottal flow patterns in the space between the stenosis and the vocal folds. Underlying mechanisms for the observed changes, possible implications for human voice production, and suggestions for future work are discussed.
Keywords: voice production, vocal folds, subglottic stenosis, finite-element model, flow-induced vibration, fluid-structure interaction
1 INTRODUCTION
Subglottic stenosis (SGS) is a narrowing of the airway within the subglottal region of the larynx or upper trachea (see Fig. 1). In most patients it results from damage to the airway lumen caused by prolonged intubation and/or tracheotomy. It can also occur congenitally, as a result of external trauma, from disease, or idiopathically (Giudice et al., 2003; George et al., 2005; Herrington et al., 2006). Symptoms include respiratory problems such as dyspnea, stridor, and croup (Lesperance and Zalzal, 1998; Bailey et al., 2003; Poetker et al., 2006). It can also be associated with changes in voice quality, in which case it can present as hoarseness and/or dysphonia (Giudice et al., 2003; Poetker et al., 2006). Symptoms generally worsen as the severity (i.e., greater narrowing) of the stenosis increases.
Fig. 1.
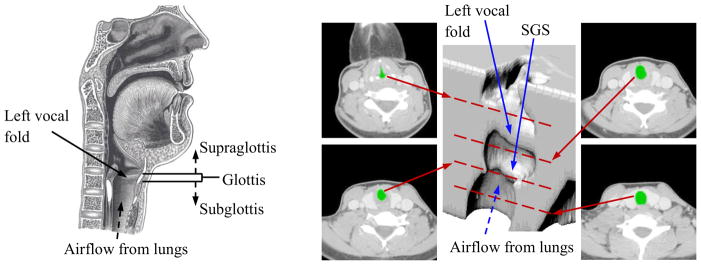
Left: Sagittal view of the human larynx, including the vocal folds and subglottal, glottal, and supraglottal regions (adapted from Gray’s Anatomy of the Human Larynx, www.bartleby.com, used with permission). Right: CT images at four different elevations of a patient with subglottic stenosis (SGS) and corresponding 3D reconstruction. In the CT images the airway is colored green. Red dashed lines overlaid on the 3D reconstruction denote approximate vertical location of each slice.
The Myer-Cotton grading scale is used to classify SGS severity according to the percent occlusion of the airway (Grade I: 0 to 50% occlusion; Grade II: 51 to 70%; Grade III: 71 to 99%; Grade IV: 100%) (Myer et al., 1994). Lower grades (Grade I or mild Grade II) may require little to no treatment, but more severe cases require more prompt and extensive treatment. Initial treatment for such cases often involves tracheostomy (placement of a tracheal tube) in order to ease respiration, but when the airway is severely compromised, surgery is required. While simple operations can be performed for Grades II and III, Grades III and IV call for open reconstructive surgeries, with tracheal resection and partial cricotracheal resection being the most effective (Bailey et al., 2003; Herrington et al., 2006). These types of surgeries have been shown to affect voice quality (Smith et al., 1993; Smith et al., 2008).
Understandably, research related to SGS has focused primarily on treatments that will effectively obtain the goals of restoring airway patency and decannulation (tube removal). A subject less studied in relation to SGS, however, has been the management of laryngeal function, particularly the voice. A number of studies have considered voice quality due to SGS before surgery (Zalzal, 1988; Cotton, 1991; Zalzal et al., 1993), but the purpose of the assessments was for simple comparison with postoperative voice quality, and, therefore, no detailed qualitative or quantitative data about voice quality in the patients were reported. Ettema et al. (2006) sought to quantify voice quality in SGS patients through a perceptual voice analysis. According to their assessment, roughly 50% of their SGS patients had moderately to extremely affected voice quality. However, the majority of these patients had other negative risk factors besides SGS that would contribute to poor voice quality, including multiple stenoses, vocal fold impairment, and previous airway surgery. Thus, it is unknown whether effects on the voice were due to the subglottic stenosis or other factors. Furthermore, some patients with higher grade stenoses retained normal voice quality, suggesting that SGS may affect some voices and not others. Because of the uncertainty about the connection of SGS to voice quality, it is of interest to further study the subject.
While a few studies have focused on airway models with a subglottic stenosis, to the best of the authors’ knowledge, none have explored the effect of SGS on vocal fold vibration. In three studies (Cebral and Summers, 2004; Brouns et al., 2007; Mihaescu et al., 2008) the airway with SGS was modeled using three-dimensional geometry from human image data sets. Computational simulations of respiratory airflow were performed. Brouns et al. (2007) parametrically varied the severity of the stenosis. However, these studies focused solely on the effects of SGS on respiration and did not include vocal fold vibration.
Other studies related to subglottal geometry have explored how subglottal shape influences vocal fold motion and other factors related to phonation. It was proposed by Li et al. (2006) that the pre-vibratory inferior vocal fold surface angle has little effect on the intraglottal pressure distributions that provide the driving force for vocal fold oscillation. A follow-up study was recently performed by Smith and Thomson (2012) which showed that inferior vocal fold surface angle does directly affect vocal fold motion. Specifically, it was concluded that changing the angle influenced vocal fold motion by altering vocal fold stiffness and net flow-solid energy transfer. Grisel et al. (2010) recently found that changes in the subglottal shape after medialization thyroplasty surgery can significantly increase turbulence through the glottis, which may cause an abnormal voice, breathiness, and chaotic vocal fold vibrations. They showed that turbulence can be reduced with medialization of the subglottis.
While these prior studies have provided insight into the influence of subglottal geometry on phonation, further exploration is needed to understand this interaction. In the present study, the influence of varying subglottal geometry due to SGS on vocal fold vibration was considered using a two-dimensional, fully-coupled finite element model of the vocal folds and laryngeal airway. The model enabled identification of the effects of the stenosis itself, absent other contributing factors. Systematic changes to subglottal geometry were made by varying the severity of a parameterized subglottic stenosis.
2 METHODS
2.1 Computational Model
A computational model simulating two-dimensional laryngeal air flow and the resulting vocal fold flow-induced vibration was developed. A stenotic region was included in order to simulate an airway with SGS. The model was created and solved using ADINA (ADINA R&D, Inc., Watertown, MA), a commercial finite element software package which specializes in solving systems that involve fluid-structure interactions and which has been employed in previous studies of biological fluid-structure interactions, including those of the vocal folds and airway (e.g., Bertram, 2009; Pickup and Thomson, 2011; Pei and Yu, 2011; Wang et al., 2012).
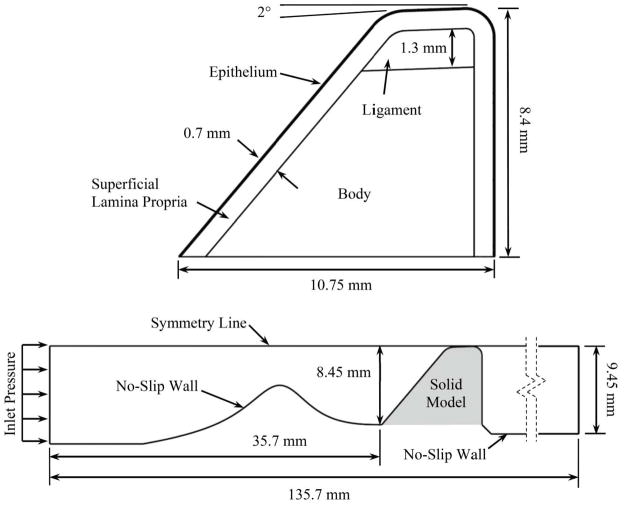
The model consisted of separate and distinct, but fully-coupled, fluid and solid domains which represented the airway and vocal folds, respectively (see Fig. 2). The solid domain was defined using an idealized exterior vocal fold geometry similar to that which has been used in previous experimental and computational studies (e.g., Scherer et al., 2001; Thomson et al., 2005). For reasons of meshing convenience and model simplicity, the inferior edge of the vocal fold rose from the subglottic region at a fixed angle; i.e., there was a slope discontinuity at the junction of the subglottic region and the inferior edge of the vocal fold. Regarding this feature, it is noted that many previous computational and experimental vocal fold studies have included a similar slope discontinuity (e.g., Scherer et al., 2001; Thomson et al., 2005; Erath and Plesniak, 2006). Second, and more importantly, it has been recently shown that the inferior surface angle does not significantly change the transglottal pressure distribution, but that it does change model response by effectively changing the vocal fold bending stiffness (Smith and Thomson, 2012). Thus the smooth transition could, in theory, influence the model response. However, smoothing this transition would only involve changing the geometry in a very small region close to the base of the vocal folds. Consequently, the change in the model bending stiffness and hence model vibration would likely be minimal.
Fig. 2.
Solid (top) and fluid (bottom) domains. The shaded area corresponds to the region occupied by the undeformed solid model.
The solid domain was comprised of four material layers representing the (1) epithelium, (2) superficial layer of the lamina propria (SLLP), (3) intermediate and deep layers of the lamina propria (ligament), and (4) muscle (body) (Hirano et al., 1981).
The body, ligament, and SLLP material stiffness characteristics were defined using nonlinear stress vs. strain curves based on the equation
| (1) |
where σ and ε are scalar values for stress and strain, respectively, and A and B are constants that govern the stress-strain curve shape. This material response equation has been used elsewhere (Alipour-Haghighi and Titze, 1991) to approximate the high strain portion of the stress-strain curve for vocal fold tissue. A value of B = 10.5 was used for each material. Values of A = 22.5, 112.7, and 839.4 Pa for the SLLP, ligament, and body layers were chosen. These corresponded to elastic moduli of 0.4, 2, and 14.9 kPa at a strain of ε = 0.05 for the three respective layers. The epithelium was defined as a material with a linear stress-strain curve and a Young’s modulus of 50 kPa. Stress-strain data points from Eq. (1) for the three nonlinear SLLP, ligament, and body layers were input into ADINA. Similarly, points from a linear stress-strain curve with a slope of 50 kPa were input for the epithelium layer. Stress values for compressive (negative) strains were defined using σ(−ε) = −σ (ε). The solid domain solver employed the strain energy density-based hyperelastic Ogden material model with the total Lagrangian formulation to relate the two-dimensional stress and strain tensors (see Bathe, 1996 and ADINA, 2010 for details). The model allowed for large deformation and large strain. The model used a 6th order least squares fit to the input stress-strain data points, resulting in uniaxial stress-strain curves for each material layer based on the resulting Ogden material constants.
Damping was estimated using the Rayleigh scheme (e.g., Bathe, 1996; Hunter et al., 2004), which forms the damping matrix (D) in the equations of motion from a linear combination of the mass (M) and stiffness (K) matrices,
| (2) |
The coefficients α and β are parameters that define a material’s damping ratio (ζ) as a function of frequency (f in Hz) according to the relation
| (3) |
For the present model damping coefficients of α = 56.549 and β = 3.979 × 10⁻⁵ were used, yielding a damping ratio in the range of 0.0475 to 0.0575 over the frequency range of 100 to 300 Hz. All solid layers had densities of 1070 kg/m3 and Poisson’s ratios of 0.49.
A parameterized stenosis profile (described in Sec. 2.2) was incorporated into the wall of the fluid domain directly upstream of the vocal fold, connecting to the inferior-most point of the vocal fold profile. The stenosis profile was rigid. The fluid was defined as air with a density of 1.2 kg/m3 and a viscosity of 1.8×10⁻⁵ Pa·s. The flow was governed by the unsteady, laminar, incompressible Navier-Stokes equations and driven by a pressure applied to the inlet. The outlet boundary pressure was set to zero. A fluid-structure interaction boundary condition was employed along the fluid-solid interface to couple the fluid and solid domains. Under this condition the fluid and solid domain equations were solved such that the displacement and stress distributions in the fluid domain along the interface were equal to the displacement and stress distributions along the interface in the solid domain. The symmetry line was a slip wall boundary condition. No-slip wall boundary conditions were applied to the remaining domain edges.
The fluid domain grid was comprised of quadrilateral 4-node elements. The number of nodes in all of the cases was the same (around 45 000), with biased meshing in the stenotic region (finer mesh for higher severity) in order to maintain reasonable aspect ratios in the narrowest region and to resolve the flow across the stenosis. The solid model was meshed uniformly with 3-node triangular elements, resulting in around 51 000 nodes.
The initial gap between the vocal fold and the symmetry line was 0.05 mm. To prevent collapse of the fluid domain mesh, a rigid contact line was placed 0.03 mm above the solid model medial surface, prohibiting motion of the vocal fold model closer than 0.02 mm to the symmetry line. This maintained a minimum total effective gap width of 0.04 mm. This contact line location was selected based on a recent study using a very similar vocal fold model (Shurtz, 2011; Thomson and Shurtz, in review). It was shown that reducing the minimum gap width from 0.05 mm to 0.001 mm resulted in the vibration frequency changing by less than 1%, the glottal width and flow rate waveforms being largely unaffected (except for lower flow rates during “closure”), and minimal changes to the model vibratory motion. It was also shown that a minimum gap width greater than 0.01 mm was desirable in order to avoid introducing spurious intraglottal pressures caused by extreme aspect ratios during closure.
Fluid-structure interaction (FSI) simulations were performed in ADINA beginning with the coupled fluid and solid models in their undeformed configurations as shown in Fig. 2. The initial condition was a zero inlet pressure, which was linearly increased to the desired driving pressure in 0.01 s. As the pressure increased and the solid domain deformed, the fluid boundary deformed with the solid domain via the FSI boundary condition along the FSI interface. The interior fluid mesh deformation was updated using an Arbitrary-Lagrangian-Eulerian (ALE) scheme. The solution was allowed to proceed with a time step size of 2.5×10⁻⁵ s at inlet pressures of 300, 600, and 900 Pa for each case of stenosis. The 99% case was run for 10 000 time steps to allow for plenty of time for steady-state vibration to be reached. For the other cases 6000 time steps were sufficient. Reynolds numbers corresponding to these three inlet pressures, calculated using glottal flow rate and glottal width at each time step of an oscillation cycle and then averaged over the cycle, were approximately 650, 1500, and 2500, respectively.
2.2 Stenosis Definition
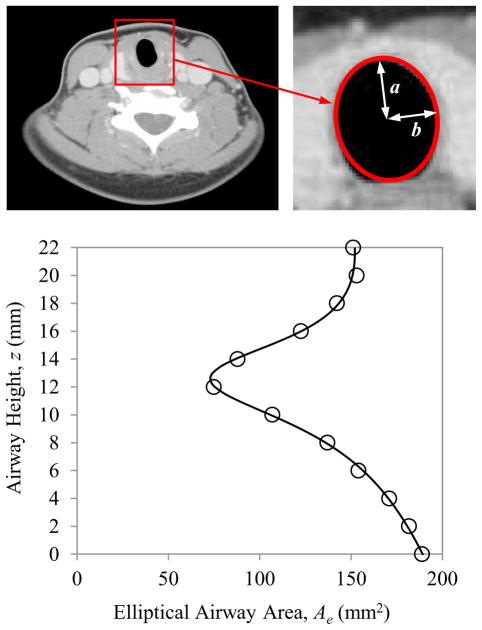
As illustrated in Fig. 3, the SGS geometry was derived from computed tomography (CT) data from a patient presenting with subglottic stenosis. The CT images had a pixel resolution of 0.45×0.45 mm in the transverse plane with 2 mm spacing between images. Twelve images, starting approximately at the inferior edge of the vocal folds and extending inferiorly through the stenosis to where the trachea returned to an approximately constant cross-section, were used to define the stenosis. The images were imported into a custom MATLAB code in which each luminal cross section was approximated as an ellipse. The major and minor radii of each ellipse were determined, from which the elliptical area (Ae) of each cross section was calculated. To determine the error in approximating the cross-sectional area as an ellipse, the actual area of the airway was estimated for each slice using MATLAB code and compared to the area found by the elliptical approximations. The resulting error in the elliptical area ranged from 0.15% to 5.86% of the actual area for individual slices, with an average error of 2.44%. A rational polynomial curve was fit to the area data points in order to obtain an expression for Ae as a function of distance z along the airway, yielding
Fig. 3.
Stenosis definition process. Top left: CT image from a patient with SGS. Top right: Luminal cross-section approximated as an ellipse. Bottom: Elliptical airway areas (circles) at different airway elevations and rational polynomial curve fit (solid line).
| (4) |
where z is the inferior-superior height of the airway, ranging from z = 0 (inferior) to z = 22 (superior) for the profile. Here z and Ae have units of mm and mm2, respectively.
Because the stenosis was incorporated into a two-dimensional computational model, the elliptical area profile was converted to an equivalent profile for a rectangular airway, where the profile represented the lateral airway width (vertical dimension of fluid domain in Fig. 2) and a constant out-of-plane depth was assumed. The profile was then scaled and parameterized (for further details, see Smith, 2011). Using this stenosis definition, six models with increasing degrees of stenosis severity (0%, 30%, 60%, 90%, 95%, and 99%) were created and are shown in Fig. 4. A 0% case corresponded to an airway without a stenosis. The 30%, 60%, and 90% cases corresponded to stenosis grades I, II, and III, respectively, according to the above-mentioned Myer-Cotton grading scale (Myer et al., 1994). Two additional grade III stenosis cases, 95% and 99%, were created in anticipation of more sensitive changes in this region of high stenosis severity. While the Myer-Cotton grading scale is based on the percent occlusion in three-dimensional area of the laryngeal airway, the percentage here represents the reduction in lateral airway width which equivalently reduces the area based on a unit out-of-plane depth.
Fig. 4.
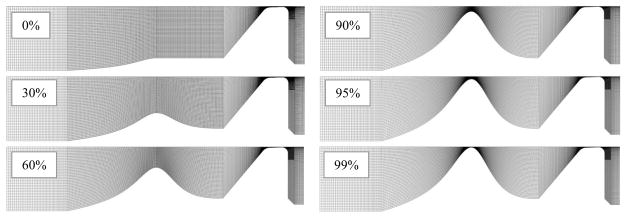
Fluid domains for each severity of stenosis.
2.3 Verification
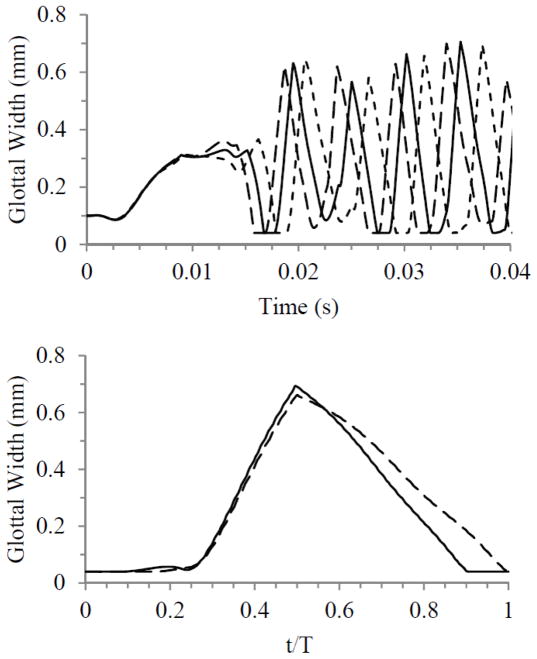
Simulations were performed to ensure that the results were reasonably independent of grid density, time step size, and convergence criteria. These were first performed using the 0% case with a 600 Pa inlet pressure. The study included sequentially varying the grid density by factors of two, the time step size by factors of two, and solver convergence criteria by factors of ten. Results were compared by analyzing glottal width waveforms, where glottal width was defined as twice the minimum lateral distance between the vocal fold medial surface and the symmetry line. Oscillation frequency was also considered in comparing the waveforms and was calculated using the time between consecutive glottal width peaks. Figure 5 shows the results of the time-dependence and grid-independence studies. While there was minimal difference between waveforms from the model time step and the time step-halved simulations, more variation was present between waveforms from the grid-independence simulations. Compared to the model grid simulation, the grid-doubled simulation only yielded a change of up to about 2.5% in glottal amplitude and 1.2% in frequency. The waveforms were therefore deemed to be satisfactorily close. Results of the convergence criteria independence studies (not shown) showed even less variation than the time step independence study results.
Fig. 5.
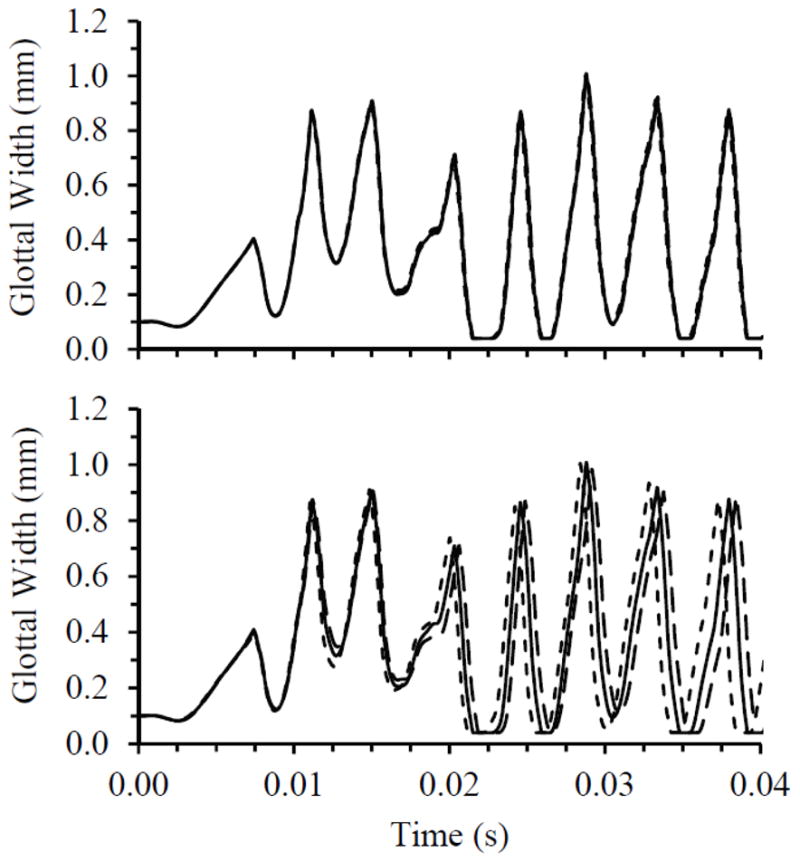
Top: Time step independence study results for model with 0% stenosis, comparing glottal width for three time step sizes during the first 0.04 sec of the simulations. ––––– Model time step, - - - - - - - Doubled time step, – – – – - Halved time step. Bottom: Grid independence study results for model with 0% stenosis, comparing glottal width for three grid densities. ––––– Model grid density, - - - - - - - Grid-halved density, – – – – - Grid-doubled density.
The same independence studies were also carried out on the model with 90%, 95%, and 99% stenoses, again at 600 Pa inlet pressure. Time step and convergence criteria studies for all three degrees of stenosis gave similar outcomes to 0% stenosis. Grid independence study results for the 95% case were also similar to those for the 0% case, and the 90% case had even less variation between grid densities. As seen in Fig. 6, the model with 99% stenosis yielded more variation. Much of the variation is manifest as a phase difference. During the transient state the simulations resulted in greater differences among the waveforms than with no stenosis. As the model achieved steady vibration, there was less variation between the model grid and grid-doubled waveforms, as shown in the bottom plot of Fig. 6, with about 5% and 3% differences in glottal amplitude and frequency, respectively. It can also be seen that there are differences in the waveforms between the two grid densities.
Fig. 6.
Top: Grid independence study results for model with 99% stenosis, comparing glottal width for three grid densities during the first 0.04 sec of the simulations: ––––– Model grid density, - - - - - - - Grid-halved density, – – – – - Grid-doubled density. Bottom: Glottal width waveforms plotted over a steady state cycle, comparing two grid densities for the model with 99% stenosis: ––––– Model grid density, – – – – - Grid-doubled density.
To further examine the effects of grid refinement on model response, flow patterns in the subglottis were visualized and compared for varying grid densities. Figure 7 shows velocity vector fields for the 0% and 99% stenosis cases using the model grid and grid-doubled densities. The plots show the flow at the same phase of the oscillatory cycle (during glottal opening, t/T ≈ 0.375, where the time during the cycle, t, is normalized by the oscillation period, T). While the 0% case showed essentially the same flow patterns for both grid densities, the 99% stenosis case resolved flow features differently with a finer grid. As opposed to a large recirculation zone dominating the space between the stenosis and the vocal folds, the grid-doubled density model showed multiple smaller recirculation zones in the same area. Also, the finer grid resolved a vortex that shed off of the narrowest portion of the stenosis and traveled downstream, whereas there was no distinct vortex shed off of the stenosis in the model grid density simulation. Most of these flow differences were upstream of the medial-most region of the vocal fold that experienced the bulk of vibration.
Fig. 7.
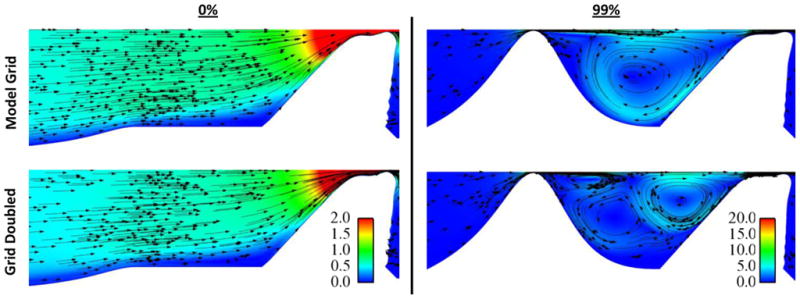
Subglottal flow velocity plots, comparing flow patterns using two different grid densities (top: model grid; bottom: grid-doubled), for the model with 0% stenosis (left) and 99% stenosis (right). Color represents velocity magnitude and arrows show velocity direction. Color legend values are for velocity in meters per second. Images show flow at t/T ≈ 0.375.
While it is thus apparent that a finer grid for the 99% case brought about some changes in the overall model response, the measures discussed here, such as glottal width waveforms and frequencies, were still generally similar in terms of shapes and trends between the different grid density model results. Importantly, as is shown below (Sections 3.1 and 3.2), the differences observed here are smaller than the effects of increasing stenosis severity from 95% to 99% at 600 Pa. Thus while some quantitative changes would result from using a finer grid, particularly with respect to flow rate-related quantities, it is not expected that the basic conclusions about the influence of SGS on vocal fold vibration would change.
3 RESULTS
3.1 Overview of Model Responses
For all of the stenosis cases and inlet pressures, the models eventually reached a steady-state vibration. For most it was reached by approximately 4000 time steps (0.1 sec), an exception being the models with the 99% stenosis that achieved steady vibration by approximately 6000 time steps (0.15 sec). Once steady-state vibration was considered to have been reached, there was less than 0.7% change in frequency and glottal width amplitude between oscillation cycles.
Figure 8 shows model motion for the 0%, 95%, and 99% cases at 600 Pa. Eight phases at even intervals of the oscillatory cycle are shown. Phase times are normalized by the oscillation period T. Motion profiles for the 0% case showed that the glottis was “closed” (i.e., at its maximum allowed closure) at t/T = 0 and 0.125. At these phases the point of contact was moving superiorly in a wavelike fashion, and the glottis was beginning to take on an overall convergent profile. The next three phases captured glottal opening with a convergent glottal profile. At t/T = 0.625 the glottis was near its maximum opening, and the last two phases were of glottal closing with a divergent profile. As the profiles are followed throughout the cycle, motion resembling a mucosal wave is apparent across the medial surface.
Fig. 8.
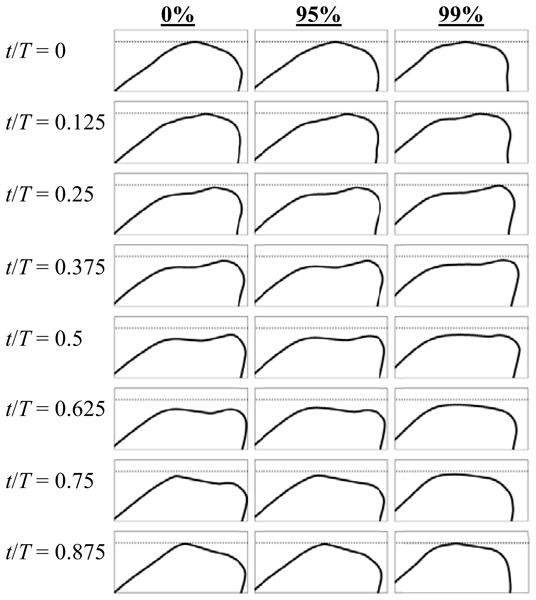
Profiles of the model medial surface for 0%, 95%, and 99% stenosis cases at 600 Pa inlet pressure at eight phases of the oscillation cycle.
Motion was essentially identical for the 0%, 30%, 60%, and 90% cases at 600 Pa. The 95% case exhibited slightly different motion in that it appeared that glottal opening occurred slightly earlier in the cycle such that the glottis reached its maximum opening sooner (somewhere around t/T = 0.5). At t/T = 0.625 the glottis was somewhat divergent, indicating that it was in the closing phase by this point. At t/T = 0.75 the glottis displayed a noticeably flatter divergent profile. Superior (streamwise) deformation of the model for the 95% case was somewhat less than the 0% case. All of these changes, however, were very subtle. The 99% case, on the other hand, yielded significantly different motion than any of the other cases. The glottis appeared to stay closed longer (until t/T = 0.25), but then it clearly reached its point of maximum opening sooner, around t/T = 0.5. It then closed with a more rounded divergent profile than the other cases. Both the amplitude of the glottal opening and the superior deformation of the model were visibly less for the 99% case.
Model oscillation frequency, averaged over ten steady-state cycles, is shown for all cases in Fig. 9. For the lesser severities of stenosis, the frequency remained fairly constant at about 201, 229, and 246 Hz with inlet pressures of 300, 600, and 900 Pa, respectively. Frequency was not affected until the stenosis severity reached at least 90%. The change between 90% and 95% was evident but relatively minor, as the frequency only dropped at most by about 10 Hz for any of the inlet pressures. Frequency decreased more considerably between the 95% and 99% stenosis cases, with reductions of around 20 Hz and 45 Hz at 600 and 900 Pa, respectively.
Fig. 9.
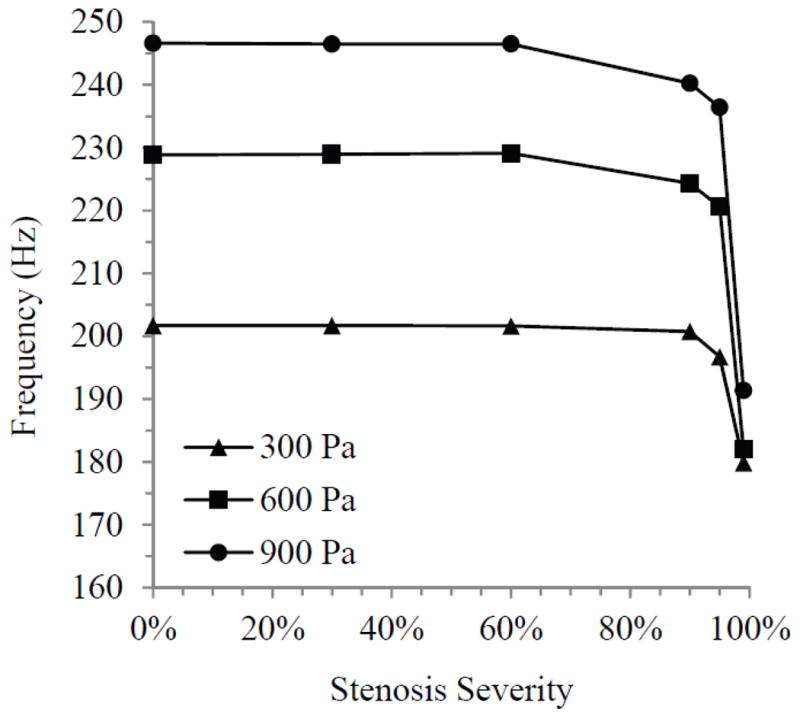
Model oscillation frequency for all stenosis cases at three inlet pressures.
3.2 Glottal Width
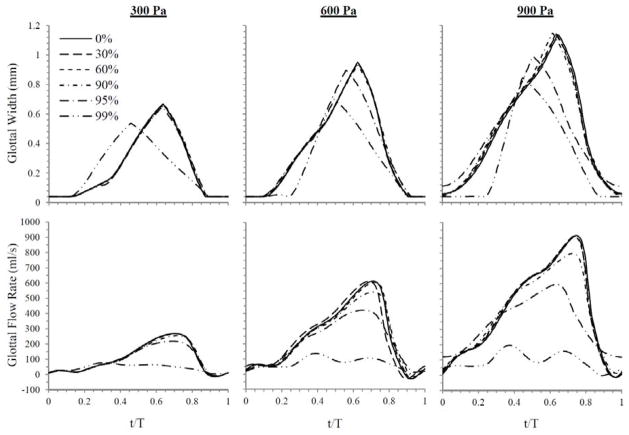
Glottal width was measured by calculating twice the minimum distance between the medial surface and the symmetry line. Figure 10 contains plots of glottal width waveforms over a steady-state cycle for all cases and inlet pressures. At an inlet pressure of 300 Pa, glottal width waveforms for the 0% to 95% cases were essentially the same as the 0% case throughout the entire cycle. Peak values were about 0.67 mm. The 99% case, however, yielded a peak that was 20% lower in magnitude and that occurred considerably sooner in the cycle. At 600 Pa, the 99% case again had a significantly lower peak glottal width (26% less) than the 0% case, which peaked at about 0.95 mm. The peak glottal width occurred at about t/T = 0.5, rather than t/T = 0.625 as in the rest of the cases. The 95% case at 600 Pa also differed somewhat from the lesser severities with a 6% drop in the peak value and a temporal shift in the location of peak glottal width. These results for both the 95% and 99% cases are consistent with the model behavior seen from the motion profiles. For an inlet pressure of 900 Pa, again the 95% and 99% cases were most affected. As with the results at 600 Pa, the differences between these and the 0% case consisted of smaller peak glottal width values and shifts in where the peak occurred. The trend was increasing change with increasing stenosis severity. Here the peaks for the 95% and 99% cases dropped 13% and 26%, respectively, from the 1.14 mm maximum glottal width of the other cases. Minimum values for glottal width at 900 Pa showed that the 95% case did not appear to completely close, while the 99% case was closed for a longer portion of the cycle than the cases of lesser severity.
Fig. 10.
Glottal width waveforms (top) and flow rate waveforms (bottom) over a normalized steady-state cycle for all stenosis cases at the three inlet pressures.
3.3 Flow Rate
Flow rate was measured by calculating twice the integral of the velocity across the glottal jet and multiplying it by 2.135 cm (corresponding to a scaled characteristic depth; see Smith, 2011). Flow rate waveforms, corresponding to the same cycles as the glottal width plots, are also shown in Fig. 10. The 0% case yielded peak flow rates of 269, 614, and 915 ml/s and average flow rates of 108, 250, and 421 ml/s at 300, 600, and 900 Pa, respectively. The flow rate trends closely followed the patterns of the glottal width waveforms. Again, essentially no change occurred until 90% or greater stenosis severity. As with glottal width, significant decreases in peak flow rates occurred for the 99% case at 300 Pa, and for the 95% and 99% cases at 600 and 900 Pa. The decreases were substantially greater than for glottal width. For the 95% stenosis case, peak flow was reduced by 31% and 35% at 600 and 900 Pa, respectively, and for the 99% stenosis case, peak flow decreased by 71%, 78%, and 79% at each of the three respective pressures. Flow rate was more sensitive to the stenosis than glottal width, as evidenced by slight decreases in the peak flow rate which occurred for the 95% case at 300 Pa (19%) and 90% case at 600 and 900 Pa (12% and 13%). As also seen in the glottal width waveforms, the flow rate peaks for the differing cases occurred earlier in the cycle than for the 0% case and lower severities of stenosis. One effect not seen in the glottal width waveforms is that the flow rate waveforms for the 99% cases take on a very different shape than the waveforms for the other cases. Additionally, the 95% case at 900 Pa showed high minimum flow rates compared to the other cases, which were all grouped around the same minimum values.
Maximum flow declination rate (MFDR), defined as the slope of the flow rate waveform at its steepest descent, was noticeably different for the cases which deviated from the 0% case. This parameter has significance in terms of radiated sound production as briefly discussed in Sec. 4. Figure 11 shows how MFDR changed with stenosis severity. MFDR was fairly steady up until 90% stenosis, at which point it began to decrease. The decrease in MFDR became greater with increasing stenosis severity at each inlet pressure, and the amount of change between severities also increased as pressure increased. At both 600 and 900 Pa inlet pressure the decreases in MFDR were substantial, with reductions of one order of magnitude occurring by the 95% case.
Fig. 11.
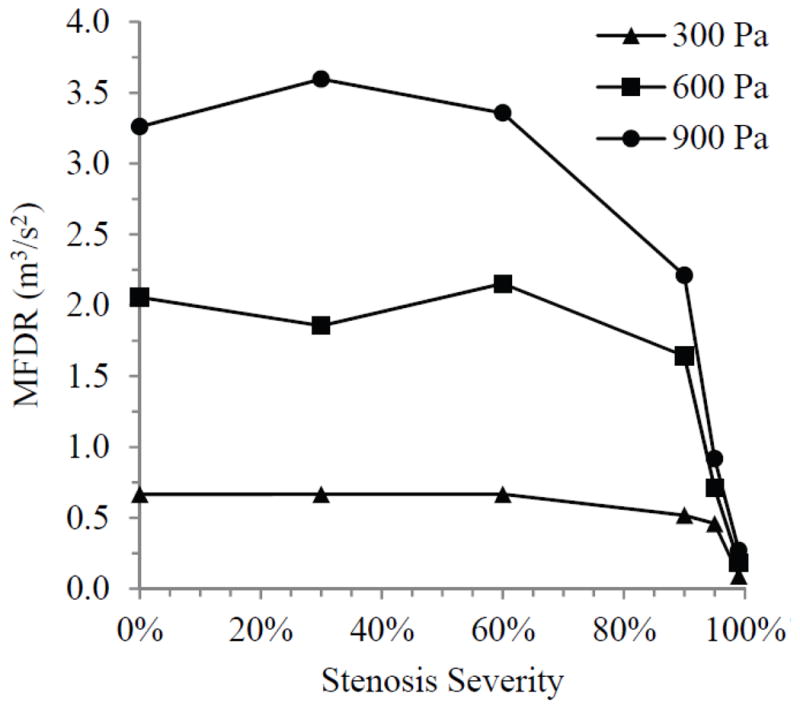
Maximum flow declination rate (MFDR) for each stenosis case at three inlet pressures.
3.4 Flow Resistance
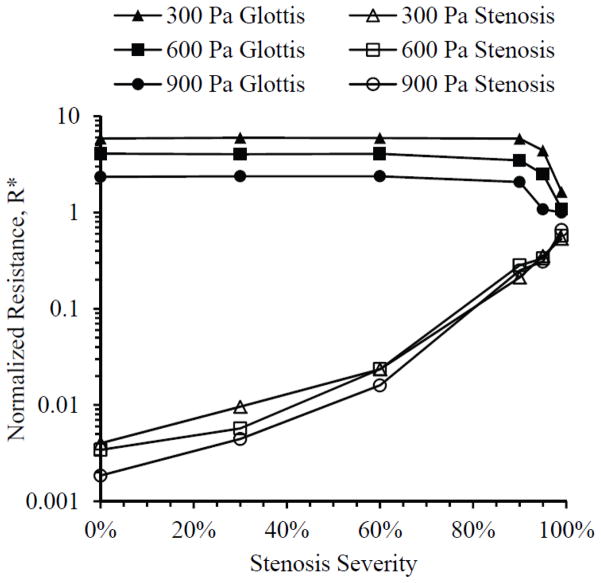
Airway resistance was calculated to compare the relative effects of the stenosis and of the glottis on the flow. Airflow resistance over a given segment length is calculated as a ratio of the associated pressure drop to the flow rate (ΔP/Q). The pressure drop in this case was taken as the pressure difference across a section of airway (the stenotic region or the glottis), and the flow rate used for both sections was measured directly in the glottis. Resistance was normalized by dividing the pressure difference by the inlet pressure, and the instantaneous flow rate at each time step in a steady state cycle by the average flow rate (averaged over the steady state cycle), as follows:
| (5) |
Average normalized resistance R* (also averaged over the steady state cycle) for all cases is given in Fig. 12. Resistance across the stenosis steadily increased with increasing stenosis severity, gaining two orders of magnitude by 90% stenosis. Resistance across the glottis, on the other hand, was essentially the same until 90% or greater stenosis severities, at which point it decreased as stenosis severity increased. At 90% and 95% stenosis severities, resistance values across the stenosis and glottis were approximately of the same order of magnitude, and at 99% the two resistance magnitudes were very close.
Fig. 12.
Average normalized resistance R* across the glottis (solid symbols) and stenosis (hollow symbols) for three inlet pressures.
3.5 Subglottal Flow Visualization
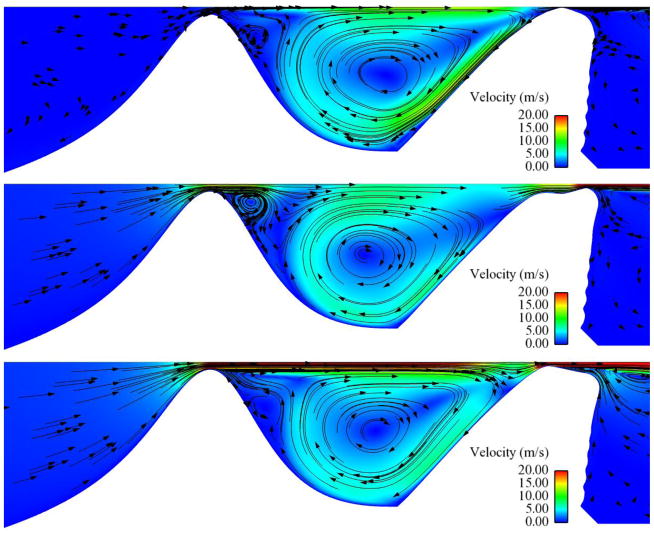
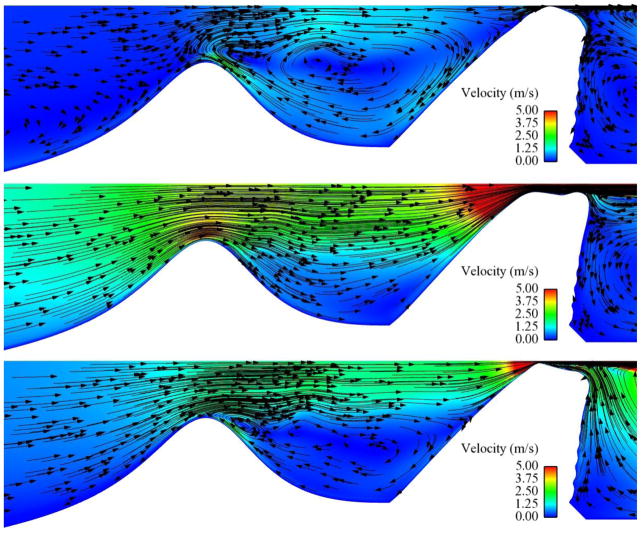
Subglottal flow was visualized in order to characterize the effects of the stenosis on the flow patterns. Figures 13 through 15 show important flow features for select cases (animations of these cases are available as supplementary content on the journal website). Note the different velocity scale in each figure. The visualizations show the degree to which the subglottal flow was altered as the severity of the stenosis increased. The 0% case (Fig. 13) exhibited smooth, relatively undisturbed flow through most of the oscillatory cycle, with a small recirculation zone upstream of the vocal fold as the flow was obstructed by the closing of the glottis. At 60% stenosis (Fig. 14) the recirculation zone during glottal closing was significantly larger, spanning most of the airway when the glottis was closed, and the velocities in the subglottis, particularly through the stenotic region, increased to around 5 m/s (from around 1.5 m/s in the 0% case). A vortex appeared just downstream of the stenosis peak during glottal closing. This vortex did not travel downstream and eventually dissipated as the glottis reopened. In the 95% case (Fig. 15) even more significant change in the flow was seen. Velocities near the stenosis increased to values in the range of 20 m/s, recirculation existed during the entire cycle, and a stronger vortex in the flow was created as the flow separated off the stenosis peak. The vortex in this case appeared during the opening phase and traveled downstream, dissipating somewhat but still remaining present throughout the cycle. These flow features were also similarly present in the 90% and 99% cases.
Fig. 13.
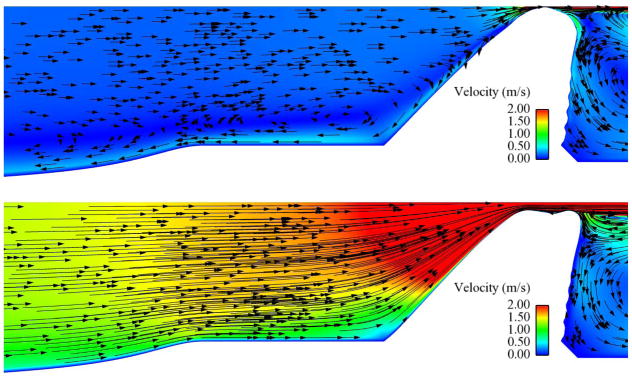
Subglottal flow velocity magnitude (color) and direction (arrows) for the 0% stenosis case at 600 Pa. Upper image shows flow at t/T ≈ 0 (closed glottis). Lower image shows flow at t/T ≈ 0.6 (around maximum glottal opening).
Fig. 15.
Subglottal flow velocity magnitude (color) and direction (arrows) for the 95% stenosis case at 600 Pa. Upper image shows flow at t/T = 0 (closed glottis). Center image shows flow at t/T = 0.375 (during glottal opening). Lower image shows flow at t/T ≈ 0.75 (during glottal closing).
Fig. 14.
Subglottal flow velocity magnitude (color) and direction (arrows) for the 60% stenosis case at 600 Pa. Upper image shows flow at t/T = 0 (closed glottis). Center image shows flow at t/T = 0.625 (maximum glottal opening). Lower image shows flow at t/T ≈ 0.82 (during glottal closing).
On the superior surface of the models, towards the lateral wall, some “rippling” of the surface is seen. This is attributed to compression of the extremely soft cover layer against the rigid lateral boundary. Such an effect is likely not present in the actual vocal folds (perhaps because there may be a more gradual transition between tissue types in this region), but it may appear in experimental models. The deformations are generally stationary (i.e., do not oscillate), and because the vocal fold vibration mainly occurs in the medial surface of the model, these artifacts are not expected to significantly affect the model vibratory response.
4 DISCUSSION
In general, the vocal fold model used for this study exhibited motion that compared well with that of the human vocal folds. The mucosal wave-like motion of the medial surface is a characteristic feature of vocal fold vibration and has been shown to be an important factor in sustained vocal fold self-oscillation (e.g., Hirano, 1981; Titze, 1988; Boessenecker et al., 2007). In addition, quantifiable values such as glottal width, flow rate, and frequency were in the range of those measured during human phonation (e.g., Jiang and Titze, 1993; Schuberth et al., 2002; Doellinger and Berry, 2006).
The purpose of this study was to explore how the presence of subglottic stenosis affected vocal fold vibration. The results showed that only with stenosis severities of around 90% and above were the responses of the vocal fold model and airflow significantly altered. In particular, glottal width, flow rate, frequency, and vertical deformation of the model tended to decrease with increasing stenosis severity. Flow resistance across the glottis also decreased with stenosis severities above 90%, becoming comparable in magnitude to the trans-stenosis resistance. These changes were more sensitive at higher inlet pressures (i.e., change was introduced at a lesser severity of stenosis as inlet pressure increased). These observations suggest the possibility that only patients with the most severe cases of SGS would experience voice-related changes directly caused by SGS-induced flow disturbances. This may support the idea Ettema et al. (2006) put forth that other negative factors associated with SGS, such as multiple stenoses, vocal fold motion impairment, and previous airway surgery play a more significant role in affecting the voice in SGS patients than the stenosis itself.
A primary cause of many of these changes was the flow resistance caused by the stenosis. The steady increase in flow resistance across the stenosis was due to an increasing pressure difference across the stenosis as the degree of stenosis severity increased. As the pressure decreased across the stenosis, the pressure difference across the glottis also decreased. At higher severities of stenosis, the decrease in pressure difference across the glottis was significant enough in relation to flow rate that it caused glottal resistance to decrease substantially. Additionally, a decrease in the pressure gradient across the glottis also decreased the driving force on the vocal folds, thus contributing to the smaller glottal width and reduced vertical deformation of the vocal fold model.
Disturbances in subglottal flow were apparent with 60% stenosis and increased with increasing stenosis severity. The disturbed flow features included recirculation, vortex shedding, and increased velocities. This is consistent with the findings of previous research on the effect of SGS on respiration, which showed decreased pressure, turbulent flow, and increased shear stress in the stenotic region (Cebral and Summers, 2004; Brouns et al., 2007; Mihaescu et al., 2008). The presence of vortices and other turbulence in glottal flow can contribute to hoarseness or breathiness in the voice (e.g., Grisel et al., 2010). However, the subglottal flow pattern alterations seen in this study were likely less significant in influencing vocal fold motion than the increased flow resistance caused by the stenotic constriction. It is important to note that this study was based on a two-dimensional, laminar flow model. As stated above, the Reynolds numbers calculated within the glottis and averaged over the oscillation cycle ranged from 650 to 2500 for the three inlet pressures. However, the maximum instantaneous Reynolds numbers reached between 1700 and 5400 for the three pressures. Consequently, subsequent studies with three-dimensional flow, including possible turbulence effects, are recommended.
The decrease in frequency with increasing stenosis severity was likely caused by the lower amplitude motion. Because the model materials were defined using nonlinear stress-strain curves, its stiffness increased with increasing deformation. At increased stenosis severities, the model exhibited reduced vibration amplitude and deformation. With decreased deformation the effective stiffness of the model was also reduced, resulting in a lower vibration frequency. This also likely explains the reason for the frequency of the models increasing with increasing inlet pressure.
The changes in model vibration suggest that the voice can be affected by the presence of subglottic stenosis. Certain factors are a good measure of how the voice may change. First, vibration frequency is a key characteristic of the sound of the voice. With stenosis severities of about 95% and above, changes in frequency were substantial enough to be recognized as a change in pitch of the voice. In addition, MFDR is related to vocal acoustic power (Titze and Sundberg, 1992; Titze, 2000) and intensity (Titze, 2000; Titze, 2006). The considerable decrease in MFDR for high stenosis severities would potentially be manifest as a lowered intensity of the voice or as a difficulty in speaking loudly.
A few considerations regarding this model’s response and suggestions for future research are here presented. First, it is possible that the low sensitivity of the model’s response at lesser SGS severities is related to factors specific to this model. One factor that affects model response is geometry. The present model employed simplified two-dimensional geometry. Using a three-dimensional model with more realistic geometry could allow for additional phenomena to be manifest. A few examples are here discussed, starting with the basic difference in percent airway reduction between two- and three-dimensional models. The relationship between width reduction and area reduction in a two-dimensional model is different than in a three dimensional model, especially in cases where the SGS is circular or elliptically-shaped. The presently discussed results suggest that it is the reduction in area, rather than the reduction in width alone, that is of primary importance in altering flow resistance and hence vocal fold vibration, and this should be taken into consideration in future work with three-dimensional models. Another possible three-dimensional effect may be found in a three-dimensional vocal fold model that exhibits anterior-posterior vibratory asymmetry like that which has been observed in experiments (Pickup and Thomson, 2010). A glottis that is opening and closing in a spatially asymmetric manner will yield a different area waveform than that of a symmetric glottis. The nature of the difference between area waveforms of such a symmetric vs. an asymmetric glottis would need to be determined on a case-specific basis, but it is conceivable that the maximum area during glottal opening could be somewhat reduced for the asymmetric case. Since the degree to which the stenosis affects vocal fold vibration is largely dependent on the relative flow resistance across the stenosis compared with that across the glottis, a glottis with anterior-posterior asymmetry and thus reduced maximum glottal area could exhibit reduced sensitivity to the presence of SGS. Finally, three-dimensional models would contain different flow patterns due the presence of out-of-plane wall boundaries as well as three-dimensional flow motion. For example, vortices generated at the endpoints of the major axis of an elliptically-shaped stenosis could lead to jet axis switching. Additional asymmetric flow features (e.g., the Coanda effect) may arise in the space between the stenosis and the vocal folds. Phenomena such as these would result in different velocity and pressure profiles than what would be predicted by two-dimensional simulations. The degree to which they would be both present and significant depends on factors such as the stenosis shape, Reynolds number, and distance between the stenosis and the vocal folds.
While the above-mentioned phenomena may be observed in a three-dimensional model, it is here speculated that such changes would not result in substantially different conclusions than those presented here. As seen in this model, altered flow patterns (e.g., by introducing a stenosis) produce little effect on model response. As discussed above, the changes in vibration with increasing stenosis severity are largely due to increased flow resistance, which is primarily due to reduced area. In a three-dimensional scenario, a reduction in area will likely affect a similar change in flow resistance. However, this hypothesis would benefit from further study using three-dimensional simulations and/or experiments.
A second consideration is that the model response is very sensitive to material properties. The human vocal folds are similarly highly sensitive to changes in tissue properties. While the stress-strain properties of the present model are generally similar to previously published data for vocal fold tissue, human tissue properties vary widely, and the present model represents only one case. By changing parameters of the material definition, vocal fold model response could change. For example, a more flexible SLLP would be expected to yield a model with increased amplitude. This may result in a less severe SGS being able to alter the model response due to lower flow resistance across the more open glottis. While material property differences would yield some quantitative differences in model response, it is not expected that the basic conclusions of this study would change.
Furthermore, varying the position and properties of the stenosis may result in more or less model sensitivity. If the stenosis were to be physically connected (and much closer) to the vocal folds, the actual vocal fold geometry would be modified, and model vibration would be affected. Using a material model for the stenosis, rather than a rigid profile, could create a more compliant stenosis that may be sufficiently deformable so as to alter the nature of the trans-stenosis and trans-glottal flow resistances. In such a case, phasing between stenosis and vocal fold vibration would be important.
The above discussion suggests the need for further exploration of the role of SGS on voice production. Future work including three-dimensional models, excised larynges, and physical experiments using synthetic models will be useful approaches. Other subjects of interest include an in-depth investigation of the extent to which the changes in vibration can be solely attributed to pressure drop across the stenosis (e.g., by comparing stenotic models with non-stenotic models driven by lung pressures equivalent to the trans-glottal pressures in the stenotic cases); an examination of the influence of varying position, geometry, and material properties of the stenosis; and an analysis of the effects on vibration of acoustic resonances in the space between the stenosis and vocal folds. Regarding the latter, exploring the relationships between stenosis position relative to the vocal folds, acoustic resonances, and model output would be of interest.
5 CONCLUSIONS
A two-dimensional finite element model was used to simulate the flow-induced vibration of the vocal folds with varying degrees of subglottic stenosis. The results showed that the presence of up to a 60% stenosis did not significantly alter model response, while a stenosis of 90% or greater influenced several factors related to vocal fold vibration. Superior model displacement, glottal width amplitude, and flow rate amplitude decreased with increasing stenosis severity above 90%. The model sensitivity to subglottic stenosis increased with increasing pressure, and changes in vibration correlated with changes in flow resistance. Subglottic stenosis caused a substantial pressure drop in the subglottis, which appeared to be a significant contributing factor to changes in output variables such as flow resistance and glottal width. A stenosis significantly altered the subglottal flow patterns with as low as 60% stenosis. The flow pattern alterations increased with increasing stenosis severity, although the changes in flow patterns did not appear to be directly responsible for changes in model vibration. Rather, the changes in model response were attributed to increased flow resistance. Very high (95% to 99%) severities of stenosis led to significant decreases in frequency and maximum flow declination rate, suggesting that at these severities, subglottic stenosis may directly contribute to changes in voice sound level and quality.
Supplementary Material
HIGHLIGHTS.
Subglottic stenosis included in vocal fold fluid-structure interaction model.
Model flow-induced response to varying severities of stenosis investigated.
Model response significantly affected only by severe stenosis.
Changes in model response attributed to increased flow resistance.
Stenosis-induced flow patterns shown.
Acknowledgments
This project was supported by Award Number R01DC009616 from the National Institute on Deafness and Other Communication Disorders (NIDCD). Its content is solely the responsibility of the authors and does not necessarily represent the official views of the NIDCD or the National Institutes of Health. SLT gratefully acknowledges support as a visiting professor from the Friedrich-Alexander University Erlangen-Nürnberg Graduate School in Advanced Optical Technologies.
Footnotes
Publisher's Disclaimer: This is a PDF file of an unedited manuscript that has been accepted for publication. As a service to our customers we are providing this early version of the manuscript. The manuscript will undergo copyediting, typesetting, and review of the resulting proof before it is published in its final citable form. Please note that during the production process errors may be discovered which could affect the content, and all legal disclaimers that apply to the journal pertain.
Contributor Information
Simeon L. Smith, Email: simeonlsmith@gmail.com.
Scott L. Thomson, Email: thomson@byu.edu.
References
- ADINA. Theory and Modeling Guide Volume I: ADINA. ADINA R&D Inc; 2010. pp. 415–423. [Google Scholar]
- Alipour-Haghighi F, Titze IR. Elastic models of vocal fold tissues. Journal of the Acoustical Society of America. 1991;90 (3):1326–1331. doi: 10.1121/1.401924. [DOI] [PubMed] [Google Scholar]
- Austin SF, Titze IR. The effect of subglottal resonance upon vocal fold vibration. Journal of Voice. 1997;11 (4):391–402. doi: 10.1016/s0892-1997(97)80034-3. [DOI] [PubMed] [Google Scholar]
- Bailey M, Hoeve H, Monnier P. Paediatric laryngotracheal stenosis: a consensus paper from three European centres. European Archives of Oto-Rhino-Laryngology. 2003;260:118–123. doi: 10.1007/s00405-002-0526-2. [DOI] [PubMed] [Google Scholar]
- Bathe KJ. Finite Element Procedure. Prentice-Hall; Englewood Cliffs, NJ: 1996. pp. 561–594.pp. 796–800. [Google Scholar]
- Bertram CD. A numerical investigation of waves propagating in the spinal cord and subarachnoid space in the presence of a syrinx. Journal of Fluids and Structures. 2009;25:1189–1205. [Google Scholar]
- Boessenecker A, Berry DA, Lohscheller J, Eysholdt U, Doellinger M. Mucosal wave properties of a human vocal fold. Acta Acustica united with Acustica. 2007;93:815–823. [Google Scholar]
- Brouns M, Jayaraju ST, Lacor C, De Mey J, Noppen M, Vincken W, Verbanck S. Tracheal stenosis: a flow dynamics study. Journal of Applied Physiology. 2007;102:1178–1184. doi: 10.1152/japplphysiol.01063.2006. [DOI] [PubMed] [Google Scholar]
- Cebral JR, Summers RM. Tracheal and central bronchial aerodynamics using virtual bronchoscopy and computational fluid dynamics. IEEE Transactions on Medical Imaging. 2004;23 (8):1021–1033. doi: 10.1109/TMI.2004.828680. [DOI] [PubMed] [Google Scholar]
- Cotton RT. The problem of pediatric laryngotracheal stenosis: a clinical and experimental study on the efficacy of autogenous cartilaginous grafts placed between the vertically divided halves of the posterior lamina of the cricoid cartilage. The Laryngoscope. 1991;101 (Suppl 56):1–34. [PubMed] [Google Scholar]
- Doellinger M, Berry DA. Visualization and quantification of the medial surface dynamics of an excised human vocal fold during phonation. Journal of Voice. 2006;20 (3):401–413. doi: 10.1016/j.jvoice.2005.08.003. [DOI] [PubMed] [Google Scholar]
- Erath BD, Plesniak MW. An investigation of bimodal jet trajectory in flow through scaled models of the human vocal tract. Experiments in Fluids. 2006;40:683–696. [Google Scholar]
- Ettema SL, Tolejano CJ, Thielke RJ, Toohill RJ, Merati AL. Perceptual voice analysis of patients with subglottic stenosis. Otolaryngology-Head and Neck Surgery. 2006;135:730–735. doi: 10.1016/j.otohns.2006.06.1249. [DOI] [PubMed] [Google Scholar]
- George M, Lang F, Pasche P, Monnier P. Surgical management of laryngotracheal stenosis in adults. European Archives of Oto-Rhino-Laryngology. 2005;262:609–615. doi: 10.1007/s00405-004-0887-9. [DOI] [PubMed] [Google Scholar]
- Giudice M, Piazza C, Foccoli P, Toninelli C, Cavaliere S, Peretti G. Idiopathic subglottic stenosis: management by endoscopic and open-neck surgery in a series of 30 patients. European Archives of Oto-Rhino-Laryngology. 2003;260:235–238. doi: 10.1007/s00405-002-0554-y. [DOI] [PubMed] [Google Scholar]
- Grisel J, Khosla S, Murugappan S, Lakhamraju R, Aubry J, Gutmark E, Huntress G. How does the absence or presence of subglottal medialization affect glottal airflow? Annals of Otology, Rhinology and Laryngology. 2010;119 (8):559–566. doi: 10.1177/000348941011900809. [DOI] [PubMed] [Google Scholar]
- Herrington HC, Weber SM, Anderson PE. Modern management of laryngotracheal stenosis. The Laryngoscope. 2006;116:1553–1557. doi: 10.1097/01.mlg.0000228006.21941.12. [DOI] [PubMed] [Google Scholar]
- Hirano M. Clinical Examination of Voice. Springer-Verlag; New York: 1981. [Google Scholar]
- Hirano M, Kurita S, Nakashima T. The structure of the vocal folds. In: Stevens KN, Hirano M, editors. Vocal Fold Physiology. University of Tokyo Press; Tokyo: 1981. pp. 33–43. [Google Scholar]
- Hunter EJ, Titze IR, Alipour F. A three-dimensional model of vocal fold abduction/adduction. Journal of the Acoustical Society of America. 2004;115 (4):1747–1759. doi: 10.1121/1.1652033. [DOI] [PMC free article] [PubMed] [Google Scholar]
- Jiang JJ, Titze IR. A methodological study of hemilaryngeal phonation. The Laryngoscope. 1993;103 (8):872–882. doi: 10.1288/00005537-199308000-00008. [DOI] [PubMed] [Google Scholar]
- Lesperance MM, Zalzal GH. Laryngotracheal stenosis in children. European Archives of Oto-Rhino-Laryngology. 1998;255:12–17. doi: 10.1007/s004050050014. [DOI] [PubMed] [Google Scholar]
- Li S, Scherer RC, Wan M, Wang S, Wu H. Numerical study of the effects of inferior and superior vocal fold surface angles on vocal fold pressure distributions. Journal of the Acoustical Society of America. 2006;119:3003–3010. doi: 10.1121/1.2186548. [DOI] [PubMed] [Google Scholar]
- Mihaescu M, Gutmark E, Murugappan S, Elleru R, Cohen A, Willging JP. Modeling flow in a compromised pediatric airway breathing air and heliox. The Laryngoscope. 2008;118:2205–2211. doi: 10.1097/MLG.0b013e3181856051. [DOI] [PubMed] [Google Scholar]
- Myer CL, O’Connor DM, Cotton RT. Proposed grading system for subglottic stenosis based on endotracheal tube sizes. Annals of Otology, Rhinology and Laryngology. 1994;103 (1):319–323. doi: 10.1177/000348949410300410. [DOI] [PubMed] [Google Scholar]
- Pei Z, Yu C. Numerical study on the effect of nozzle pressure and yarn delivery speed on the fiber motion in the nozzle of Murata vortex spinning. Journal of Fluids and Structures. 2011;27:121–133. [Google Scholar]
- Pickup BA, Thomson SL. Flow-induced vibratory response of idealized vs. magnetic resonance imaging-based synthetic vocal fold models. Journal of the Acoustical Society of America. 2010;128(3):EL124–EL129. doi: 10.1121/1.3455876. [DOI] [PMC free article] [PubMed] [Google Scholar]
- Pickup BA, Thomson SL. Identification of geometric parameters influencing the flow-induced vibration of a two-layer self-oscillating computational vocal fold model. Journal of the Acoustical Society of America. 2011;129:2121–2132. doi: 10.1121/1.3557046. [DOI] [PMC free article] [PubMed] [Google Scholar]
- Poetker DM, Ettema SL, Blumin JH, Toohill RH, Merati AL. Association of airway abnormalities and risk factors in 37 subglottic stenosis patients. Otolaryngology-Head and Neck Surgery. 2006;135:434–437. doi: 10.1016/j.otohns.2006.04.013. [DOI] [PubMed] [Google Scholar]
- Scherer RC, Shinwari D, DeWitt KJD, Zhang C, Kucinschi BR, Afjeh AA. Intraglottal pressure profiles for a symmetric and oblique glottis with a divergence angle of 10 degrees. Journal of the Acoustical Society of America. 2001;109:1616–1630. doi: 10.1121/1.1333420. [DOI] [PubMed] [Google Scholar]
- Schuberth S, Hoppe U, Doellinger M, Lohscheller J, Eysholdt U. High-precision measurement of the vocal fold length and vibratory amplitudes. The Laryngoscope. 2002;112:1043–1049. doi: 10.1097/00005537-200206000-00020. [DOI] [PubMed] [Google Scholar]
- Shurtz TE. Master’s thesis. Brigham Young University; Provo, UT, USA: 2011. Influence of supraglottal geometry and modeling choices on the flow-induced vibration of a computational vocal fold model. [Google Scholar]
- Shurtz TE, Thomson SL. Influence of numerical model selections on the flow-induced vibration of a computational vocal fold model. Computers and Structures. doi: 10.1016/j.compstruc.2012.10.015. In press. [DOI] [PMC free article] [PubMed] [Google Scholar]
- Smith ME, Marsh JH, Cotton RT, Myer CM., III Voice problems after laryngotracheal reconstruction: videolaryngostroboscopic, acoustic, and perceptual assessment. International Journal of Pediatric Otorhinolaryngology. 1993;25 (1–3):173–181. doi: 10.1016/0165-5876(93)90051-4. [DOI] [PubMed] [Google Scholar]
- Smith ME, Roy N, Stoddard K, Barton M. How does cricotracheal resection affect the female voice? Annals of Otology, Rhinology and Laryngology. 2008;117 (2):85–89. doi: 10.1177/000348940811700202. [DOI] [PubMed] [Google Scholar]
- Smith SL. Master’s thesis. Brigham Young University; Provo, UT, USA: 2011. Influence of subglottic geometry on computational and synthetic vocal fold model vibration. [Google Scholar]
- Smith SL, Thomson SL. Effect of inferior angle on the self-oscillation of a computational vocal fold model. Journal of the Acoustical Society of America. 2012;131(5):4062–4075. doi: 10.1121/1.3695403. [DOI] [PMC free article] [PubMed] [Google Scholar]
- Thomson SL, Mongeau L, Frankel SH. Aerodynamic transfer of energy to the vocal folds. Journal of the Acoustical Society of America. 2005;118:1689–1700. doi: 10.1121/1.2000787. [DOI] [PubMed] [Google Scholar]
- Titze IR. The physics of small-amplitude oscillation of the vocal folds. Journal of the Acoustical Society of America. 1988;83:1536–1552. doi: 10.1121/1.395910. [DOI] [PubMed] [Google Scholar]
- Titze IR, Sundberg J. Vocal intensity in speakers and singers. Journal of the Acoustical Society of America. 1992;91 (5):2936–2946. doi: 10.1121/1.402929. [DOI] [PubMed] [Google Scholar]
- Titze IR. Principles of Voice Production, Second Printing. National Center for Voice and Speech; Iowa City, IA: 2000. pp. 245–251. [Google Scholar]
- Titze IR. Theoretical analysis of maximum flow declination rate versus maximum area declination rate in phonation. Journal of Speech, Language, and Hearing Research. 2006;49:439–447. doi: 10.1044/1092-4388(2006/034). [DOI] [PubMed] [Google Scholar]
- Wang JD, Lo SH, Zhou D. Liquid sloshing in rigid cylindrical container with multiple rigid annular baffles: Free vibration. Journal of Fluids and Structures. 2012;34:138–156. [Google Scholar]
- Zalzal GH. Rib cartilage grafts for the treatment of posterior glottic and subglottic stenosis in children. Annals of Otology, Rhinology and Laryngology. 1988;97:506–511. doi: 10.1177/000348948809700513. [DOI] [PubMed] [Google Scholar]
- Zalzal GH, Loomis SR, Fischer M. Laryngeal reconstruction in children: assessment of voice quality. Archives of Otolaryngology-Head & Neck Surgery. 1993;119:504–507. doi: 10.1001/archotol.1993.01880170028005. [DOI] [PubMed] [Google Scholar]
- Zhang Z, Neubauer J, Berry DA. The influence of subglottal acoustics on laboratory models of phonation. Journal of the Acoustical Society of America. 2006a;120 (3):1558–1569. doi: 10.1121/1.2225682. [DOI] [PubMed] [Google Scholar]
- Zhang Z, Neubauer J, Berry DA. Aerodynamically and acoustically driven modes of vibration in a physical model of the vocal folds. Journal of the Acoustical Society of America. 2006b;120 (5):2841–2849. doi: 10.1121/1.2354025. [DOI] [PubMed] [Google Scholar]
Associated Data
This section collects any data citations, data availability statements, or supplementary materials included in this article.


