Abstract
Artificial talkers and speech synthesis systems have long been used as a means of understanding both speech production and speech perception. The development of an airway modulation model is described that simulates the time-varying changes of the glottis and vocal tract, as well as acoustic wave propagation, during speech production. The result is a type of artificial talker that can be used to study various aspects of how sound is generated by humans and how that sound is perceived by a listener. The primary components of the model are introduced and simulation of words and phrases are demonstrated.
Keywords: vocal tract, vocal folds, modulation, speech simulation, speech synthesis
1. Introduction
Speech is produced by transforming the motion of anatomical structures into an acoustic wave embedded with the distinctive characteristics of speech. This transformation can be conceived as a modulation of the human airway system on multiple time scales. For example, the rapid vibration of the vocal folds modulates the airspace between them (i.e., the glottis) on the order of 100–400 cycles per second to generate a train of flow pulses that excites the acoustic resonances of the trachea, vocal tract, and nasal passages. Simultaneous, but much slower movements of the tongue, jaw, lips, velum, and larynx can be executed to modulate the shape of the pharyngeal and oral cavities, coupling to the nasal system, and space between the vocal folds by adduction and abduction maneuvers. These relatively slow modulations shift the acoustic resonances up or down in frequency and valve the flow of air through the system, thus altering the characteristics of the radiated acoustic wave over time, and providing the stimulus from which listeners can extract phonetic information.
The view that human speech is produced by a modulation system was expressed by Dudley (1940) in an article called “The carrier nature of speech.” In it he referred to the relatively high-frequency excitation provided by phonation or noise generation as “carrier waves” that are modulated by slowly-varying, and otherwise inaudible, movements of the vocal tract called “message waves.” He based this view on experience in developing both the VOCODER (Dudley, 1939) and the human-operated VODER (Dudley et al., 1939), and, in the conclusion, made a curious point that a wide variety of carrier signals - even nonhuman sounds such as instrumental music - could be modulated by the “message waves” and still produce intelligible “speech.” This points to the importance of understanding articulatory movement in terms of how it modulates the shape of pharyngeal and oral airspaces over time which, in turn, modulates the acoustic characteristics of the speech signal. Traunmüller (1994) also proposed a modulation theory in which speech signals are considered to be the result of articulatory gestures, common across speakers, to modulate a “carrier” signal that is unique to the speaker. In this theory, however, the carrier signal is not simply the excitation signal, but includes any aspects of the system that are phonetically neutral and descriptive of the “personal quality” of the speaker. This suggests that embedded within the carrier would be contributions of the biological structure of the vocal tract as well as any idiosyncratic vocal tract shaping patterns, all of which would be modulated during speech production by linguistically meaningful gestures.
Studying speech as a modulation system can be aided by models that allow for enough control of relevant parameters to generate speech or speech-like sounds. Within such models, the shape of the trachea, vocal tract, and nasal passages is usually represented as a tubular system, quantified by a set of area functions (cf., Fant, 1960; Baer et al., 1991; Story et al., 1996). This permits computing the acoustic wave propagation through the system with one-dimensional methods in the time domain (cf., Kelly & Lochbaum, 1962; Maeda, 1982; Strube, 1982; Lil-jencrants, 1985; Smith, 1992) or frequency domain (Sondhi & Schroeter, 1987). Typically for speech, only the vocal tract portion, along with the nasal coupling region, is considered to be time-varying. Thus, the challenge for developing a model that can “speak” is to define a set of parameters that allow efficient, time-dependent control of the shape of the vocal tract area function and coupling to the nasal system.
An articulatory synthesizer is perhaps the most intuitively-appealing approach to controlling the vocal tract because the model parameters consist of positions and movements of the tongue, jaw, lips, velum, etc. These are often represented in the two-dimensional midsagittal plane (cf., Lindblom & Sundberg, 1971; Mermelstein, 1973; Coker, 1976; Maeda, 1990; Scully, 1990) or as more complex three-dimensional models of articulatory structures (Dang & Honda, 2004; Birkholz et al., 2006, 2007), where, in either case, articulatory motion can be simulated by specifying the temporal variation of the model parameters. At any given instant of time, however, the articulatory configuration must be converted to an area function by empirically-based rules in order to calculate acoustic wave propagation, and ultimately produce an acoustic speech signal suitable for analysis or listening (e.g., Rubin & Baer, 1981; Birkholz, et al., 2010; Bauer et al., 2010).
Other approaches consist of parameterizing the area function directly, rather than attending specifically to the anatomical structures. These are particularly useful when precise control of the vocal tract shape is desired. Early examples of this approach are the three-parameter models of Fant (1960) and Stevens and House (1955) in which the area function was described by a parabola controlled by a primary constriction location, cross-sectional area at that location, and a ratio of lip opening length to its area. These models were later modified to include various enhancements (Atal et al., 1978; Lin, 1990; Fant, 1992, 2001). Another type of area function model was proposed by Mrayati, Carré, and Guerin (1988). The model parameters were not directly related to articulation but rather to portions of the area function determined to be acoustically-sensitive to changes in cross-sectional area.
Using any of these types of models to produce connected, coarticulated speech requires that the parameters allow for blending of the vowel and consonant contributions to the vocal tract shape. Ohman (1966, 1967) suggested that a consonant gesture (localized constriction) is superimposed on an underlying vowel substrate, rather than considering consonant and vowel to be separate, linearly sequenced gestures. Based on this view, Båvegård (1995) and Fant and Båvegård (1997) detailed an area function model in which the vowel contribution was represented by a three-parameter model (Fant, 1992), as mentioned previously, and a consonant constriction function that could be superimposed on the vowel configuration to alter the shape of the area function at a particular location. Ohman’s notion of vowel and consonant overlap has also influenced theoretical views of speech motor control. Gracco (1992), for instance, suggested that the vocal tract be considered the smallest unit of functional behavior for speech production, and that the movements of the vocal tract could be classified into “shaping” and “valving” actions. Relatively slow changes of overall vocal tract geometry coincide with the shaping category and would generally be associated with vowel production, whereas valving actions would impose and release localized constrictions, primarily for consonants.
Story (2005a) introduced an area function model conceptually similar to that of Båvegård (1995) and Fant and Båvegård (1997). That is, the model operates under the assumption that consonantal, or more accurately, obstruent-like constrictions can be superimposed on an underlying vowel-like area function to momentarily produce an occlusion or partial occlusion at some location in the vocal tract. It is different, however, in that the vowel substrate is generated by superimposing two shaping patterns, called modes (Story & Titze, 1998), on an otherwise neutral vocal tract configuration. Thus, at any instant in time, the shape of the area function and the subsequent acoustic output include contributions from multiple layers of modulation: 1) idiosyncratic characteristics of the neutral vocal tract, 2) the overall shaping influence of the modes, and 3) possible valving (constriction) functions that force some part of area function to become zero or nearly so. The framework for the model is supported by work based on analysis of data from both MRI and x-ray microbeam articulography (Westbury, 1994). Story (2005b & 2007) has shown that the two shaping modes seem to be fairly similar across talkers for vowel production, whereas, the mean or neutral vocal tract shape is generally unique to a talker. In addition, Story (2009b) has shown that a time-varying vocal tract shape representative of a VCV utterance can be separated into a vowel-like substrate and contributions from the obstruent-like constriction.
The purpose of this article is to describe an airway modulation model of speech production based on the parametric system reported in Story (2005a), and to demonstrate that it can be used to simulate word-level and phrase-level utterances. The components of the model consist of kinematic representations of the medial surfaces of the vocal folds (Titze, 1984, 2006) and the shape of vocal tract as an area function (Story, 2005a), as well as static representations of the nasal passages and sinuses, and trachea. The assembly of these components into a system that can generate simulated speech has been used recently to investigate the acoustics and perception of vowels, consonants, and various voice qualities (Bunton & Story, 2009, 2010, 2011; Story & Bunton, 2010; Samlan & Story, 2011). These studies, however, have focused on simple utterances such as isolated vowels and VCVs which are fairly straightforward to simulate with systematic variation of model parameters. The present aim is to present a pilot study of several cases in which the model parameters are varied in more complex fashion to simulate a small collection of words and phrases. In the first part, the background and main components of the model are briefly described. The use of the model to generate words and phrases will be demonstrated in the second part.
2. Airway Modulation Model
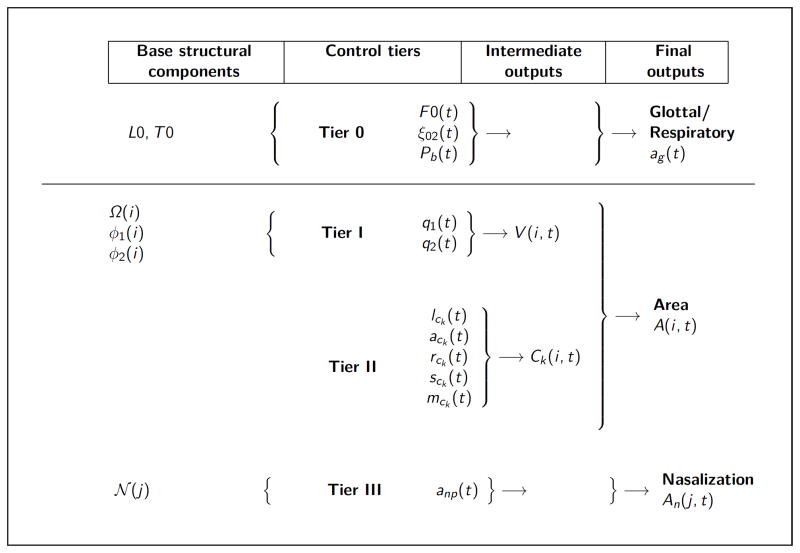
The airway modulation model is constructed such that a baseline configuration of the laryngeal, vocal tract, and nasal systems would, without any imposed control, produce a neutral, monotone vowel sound. The model parameters can then be activated such that they alter the baseline configuration in some desired manner such that the acoustic properties of the generated signal is changed. The parameters of the model are controlled by a set of hierarchical tiers as shown in Fig. 1. The leftmost column indicates quantities that define the basic physical structure of the system, the second column contains all the time-varying control parameters, the third column shows the covert intermediate quantities, and the rightmost column indicates the output quantities needed for sound production. Thus, the input parameters in the control tiers impose time-dependent deformations on the shape of the glottis and vocal tract to produce speech. Each control tier will be described in the following sections.
Figure 1.
Diagram of the four-tier model. Tier 0 controls the kinematic vocal folds model; the L0 and T 0 are the initial length and thickness of the vocal folds, respectively. Tier I produces a vowel substrate and Tier II generates a superposition function for a consonant constriction. Time-dependent nasal coupling can be specified in Tier III. The base structural components are dependent only on a spatial dimension (i.e., i and j are indexes corresponding to spatial location), whereas the final outputs are dependent on both space and time.
2.1. Kinematic model of the medial surfaces of the vocal folds
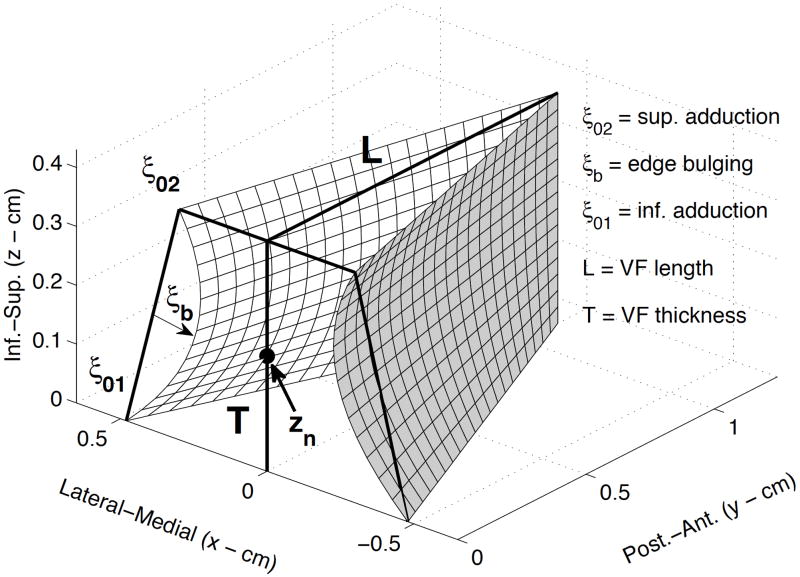
Modulation of the glottal airspace is accomplished with a kinematic representation of the vibrating portion of the vocal fold medial surfaces in which time-varying surface displacements are superimposed onto a postural configuration (Titze, 1984, 2006). As can be seen in Fig. 2, the prephonatory posture is defined by superior (ξ02) and inferior (ξ01) values of separation at the vocal processes and by a bulging parameter (ξb) that provides curvature to the medial surface. The vocal fold length (antero-posterior dimension of the surface along midline) and thickness (inferior-superior extent of the surface) can be specified to be characteristic of a particular talker.
Figure 2.
Kinematic model of the medial surfaces of the vocal folds. The Post-Ant. dimension is the vocal fold length, the Inf.-Sup. dimension is the vocal fold thickness, and the Lateral-Medial dimension is vocal fold displacement. ξ02 and ξ01 are the prephonatory adductory settings of the upper and lower portions, respectively, of the posterior portion of the vocal folds. ξb is the surface bulging, and zn is a nodal point around which the rotational mode of vibration pivots.
The time-varying vibratory displacement is based on a summation of translational and rotational modes in the vertical dimension and a ribbon mode in the antero-posterior dimension. The amplitude of vibration and mucosal wave velocity are governed by rules as described in Titze (2006). Any of the vibratory, aerodynamic, or structural parameters (e.g., fundamental freq. (F0), bronchial pressure Pb, vocal process separation ξ02, etc.) can also be made to be time-varying as indicated in the “Tier 0” portion of Fig. 1. For example, the degree of separation of the vocal processes (ξ02) could be increased to abduct the vocal folds for production of a voiceless consonant and then be reduced again for a voiced production. Thus, airway modulations produced at the level of the vocal folds operate on two time scales, one that is representative of their vibrational frequency (approximately 100–400 Hz) and another for the much slower adductory and abductory movements of the medial surfaces that take place during the unvoiced parts of speech. The output of the kinematic vocal fold model is the glottal area ag(t), calculated as the time-varying sum of the minimum area from each of the vertical channels of the medial surface. To produce sound, the glottal area is aerodynamically and acoustically coupled to the trachea and vocal tract (Liljencrants, 1985; Story, 1995; Titze, 2002). This produces a glottal flow signal which is the primary sound source for vowels.
2.2. Kinematic model of the vocal tract area function
The vocal tract component of the model was described in Story (2005a) and operates according to the view that vowel-like sounds and vowel-to-vowel transitions are produced by modulating a phonetically-neutral vocal tract configuration. In turn, production of obstruent-like sounds, which are the basis of many consonants, results from another level of modulation that imposes severe constrictions on the underlying vowel or evolving vowel transition. This means that the length and other idiosyncratic features of the neutral vocal tract shape set the acoustic background on which vowel transitions are carried, while the vowel transitions provide the acoustic background on which obstruent-like modulations are imposed. Thus, the model allows for independent, parallel control of shaping actions to modify the vocal tract for vowel production, and valving actions that locally constrict the tract shape to produce obstruent consonants embedded in a surrounding vowel context. Secondary features of articulation such as labialization, palatalization, velarization, etc. can also potentially be produced within the various levels of the model (e.g., Story & Titze, 2002).
The length and shape of the vocal tract are represented in the model by an area function. That is, the cross-sectional area variation along the long axis of the vocal tract is specified at discrete increments of length for a given instant of time. Vowel-like sounds are represented in Tier I (see Fig. 1) as modulations of an underlying neutral tract shape (i.e., formants are nearly equally spaced) and obstruents are imposed in Tier II as modulations of the underlying vowel substrate. Time-dependent nasal coupling is controlled by Tier III. An additional tier was included in Story (2005a) that allows for dynamic length change operations at both the glottal and lip ends. Although, length changes are ultimately necessary to realistically model the vocal tract shape variation in human speech, this tier was not used for the present study because of the added complexity required to change tract length dynamically in the wave-propagation algorithm (Laakso et al., 1996; Mathur et al. 2006) used to generate the speech samples (see Sec. 2.3). This is a current limitation of the acoustic portion of the system, not of the parametric model of the area function.
In the first tier, vowel-to-vowel transitions denoted as V(x, t) can be produced by perturbing a neutral vocal tract configuration with two shaping patterns called modes such that,
| (1) |
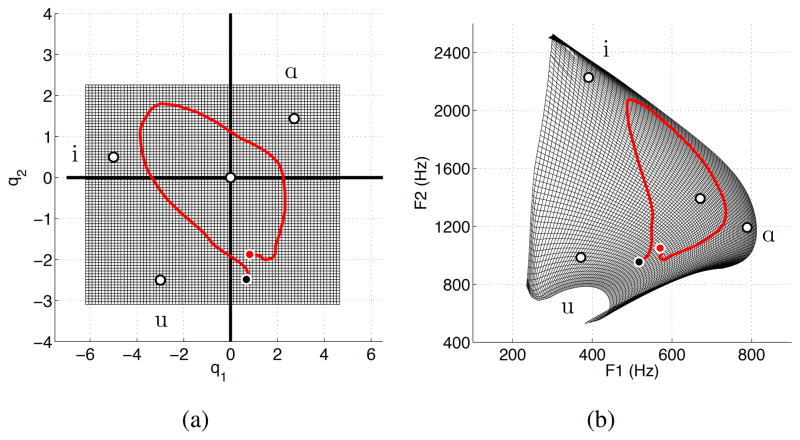
where x is the distance from the glottis and Ω (x), φ1(x), and φ2(x) are the mean vocal tract diameter function and modes, respectively, as defined in Story (2005a). The time-dependence is produced by the mode scaling coefficients q1(t) and q2(t), and the squaring operation and scaling factor of π/4 converts the diameters to areas. The mean diameter function and modes used for the present study were based specifically on those reported in Story (2009b), however, similar data from other speakers could also be substituted (cf., Story, 2005b). Additionally, the Ω(x) function can be modified in various ways to alter the overall voice quality (Story, Titze, & Hoffman, 2001; Story & Titze, 2002). In any case, the coefficients [q1, q2] have been shown to have an essentially one-to-one relation with the first two formant frequencies [F1,F2]. As shown in Fig. 3a, the white dots indicate [q1, q2] pairs that, when used with Eqn. 1, would generate area functions roughly representative of the vowels [i, ɑ, u]; the coefficient pair located at the origin produces the mean area function which is essentially a neutral vowel. The resulting [F1,F2] pairs corresponding to these same vowels are similarly shown as white dots in Fig. 3b. The dark grid in part (a) of the figure represents the “available” coefficient space for generating area functions, and the grid in part (b) is the acoustic space that corresponds to the [F1,F2] values of each point in the coefficient grid2. This mapping can also be used in the reverse direction to transform formant frequencies measured from acoustic recordings into coefficients suitable for generating time-varying area functions. The red trajectories in both parts of the figure correspond to the temporal characteristics of the coefficients and corresponding formants for the word “Ohio,” and will be used in a later section.
Figure 3.
Mapping of mode coefficients [q1, q2] (see Eqn. 3) to formant frequencies [F1,F2]. (a) coefficient space where the grid indicates the range of the q1 (x-axis) and q2 (y-axis); the white dots are coefficient pairs that would produce area functions representative of [i, ɑ, u] and the neutral vowel (at the origin); the red trajectory indicates the variation in coefficient values to generate a time-varying area function for the word “Ohio.” (b) Vowel space plot where the grid, white dots, and red trajectory represents the [F1,F2] values corresponding to the respective coefficient pairs in part (a).
Obstruent-like shapes are generated in Tier II with a scaling function C(x) that extends along the length of the vocal tract. The value of C(x) is equal to 1.0 everywhere except in the region of the desired constriction location lc. The shaping of the constriction around lc is determined by a Gaussian function that includes control parameters for the extent of the constriction along the tract length called rc, and a skewing factor sc that dictates the asymmetry of the constriction. In the velar region, rc would typically be set to values larger than for more anterior locations to more accurately represent the extent of a constriction produced by the tongue body. When any vowel-like area function is multiplied by C(x), the region in the vicinity of lc will be reduced in area to the value specified by ac, thus superimposing the constriction. When ac = 0, the constriction function will generate a complete occlusion of the vocal tract, but it may be set to nonzero values for production of sounds with partial occlusions such as fricatives, liquids, and glides. The constriction function can be made time dependent with a temporal activation parameter called the magnitude mc(t) which serves to gradually impose a constriction on the area function and then remove it. When mc(t) = 0, the constriction function has no effect, but when equal to 1.0 the constriction is fully realized within the area function. Multiple constriction functions Ck(x, t) can be specified to allow for either simultaneous or temporally-shifted obstruent-like modulations of the vocal tract shape. Additionally, the lc, ac, rc, and sc parameters can vary in time if needed to execute a particular type of shape change.
A composite area function A(x, t) is generated by the vocal tract model as the product of each of the Nvt elements along the x-dimension of V (x, t) and Ck(x, t) such that at any given time instant,
| (2) |
where Nc is the number of constriction functions. The present study is based on an adult male vocal tract (Story, 2009a) such that all area functions consist of Nvt = 44 contiguous “tubelet” sections as defined in Story (2005a), each with a length of Δ = 0.396825 cm. This results in a total tract length of 17.46 cm. This particular value of Δ is derived from the characteristics of the wave propagation algorithm and the 44.1 kHz sampling frequency at which it operates. Other sampling frequencies could be chosen that effectively alter the length of the vocal tract.
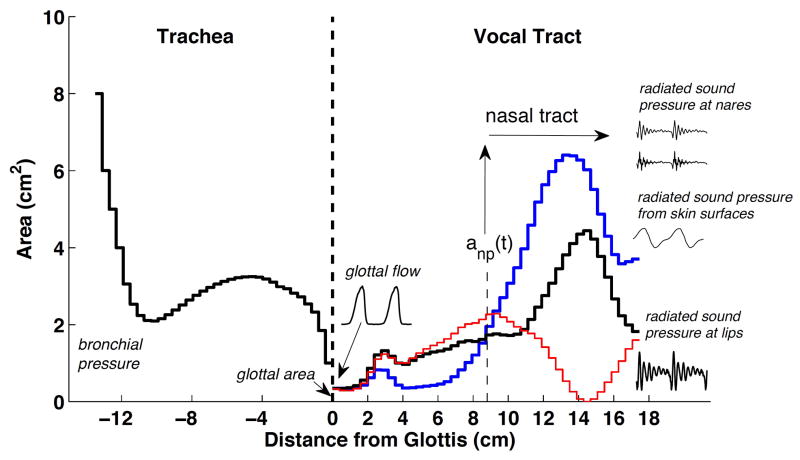
An example area function is shown in Fig. 4. The glottis is located at the zero point along the x-axis. The tracheal area function, shown in black and based on data from Story (1995), extends from the glottis toward the bronchi in the negative x-direction. The 44-section vocal tract extends toward the lips in the positive x-direction, where the black line indicates the neutral tract shape derived from the mean diameter function as (π/4)Ω2(x) (i.e., [q1, q2] = [0, 0] in Eqn. 3). The blue line is a perturbation of the neutral shape by Eqn. 1 when q1 and q2 are set to values that produce an [ɑ]-like area function, and the red line demonstrates a composite tract shape with an occlusion located in the oral cavity at a location roughly representative of an alveolar stop.
Figure 4.
Area function portion of the model. The glottis is located at 0 cm, the trachea extends from the glottis in the negative direction and the vocal tract extends in the positive direction. The black line in the positive direction indicates the area function for a neutral vowel (π/4)Ω(x)2, the blue line is a perturbation of the neutral shape based on Eqn. (1), and the red line demonstrates an area function with an occlusion located at the lips. The nasal coupling location is indicated by the dashed line and upward pointing arrow located at about 8.8 cm from the glottis. The stair-step nature of each area function indicates the concatenated tubelet structure of the model. The waveforms shown are samples of glottal flow and radiated sound pressures at the lips, nares, and skin surfaces.
The nasal coupling location is indicated by the upward pointing arrow located at about 8.8 cm from the glottis. If the nasal coupling area is nonzero, the nasal passages and sinuses become part of the overall model; their configuration
 (j) (see Fig. 1) is based on data reported in Story (1995) and Pruthi et al. (2007). In the real human system, nasal coupling results from lowering the soft palate. This has the secondary effect of slightly modifying the shape of the vocal tract in the vicinity of the soft palate. To account for this change, the nasopharyngeal portion of
 (j) (for j = [1, 6]) and corresponding region of the vocal tract area function are adjusted based on the “distributed coupling method” explained in Pruthi et al. (2007).
2.3. Wave propagation and glottal flow
To generate a speech signal, the glottal area ag(t) produced by the vocal fold component of the model is aerodynamically and acoustically coupled to the trachea, vocal tract, and nasal tract. The coupling is realized with a wave-reflection algorithm (Liljencrants, 1985; Story, 1995; Titze, 2002) that computes the acoustic wave propagation in the airways. Interaction of the glottal area with the time-varying acoustic pressures present just inferior and superior to the glottis generates the glottal flow signal. The wave propagation algorithm also includes energy losses due to yielding walls, viscosity, heat conduction, and radiation at the lips, nares, and skin surfaces (specifically as described in Story (1995)). A sample glottal flow signal is shown in Fig. 4 near the junction of the trachea and lower vocal tract; the radiated speech signal is shown near the lips and is analogous to a microphone signal recorded from a real talker. If the nasal coupling anp(t) is nonzero, there will be sound radiated at the nares as indicated in the upper right portion of Fig. 4. The sound radiated from the skin surfaces is typically of low amplitude when the vocal tract is unoccluded (e.g., vowels) or if the vocal folds are not vibrating, but becomes the dominant part of the speech signal during voiced productions with a fully or partially occluded vocal tract (e.g., voiced stops). The composite speech signal is the sum of the four signals shown at the right hand side of Fig. 4.
Additionally, aspiration noise produced by glottal turbulence is approximated by adding a noise component to the glottal flow when the Reynolds number exceeds a threshold value. This approach has been often used in speech production modeling for both aspiration and fricative type sounds (e.g., (Fant, 1960; Flanagan and Cherry, 1969), although the physical realities of jet structure, vortex shedding, production of dipole and quadrupole noise sources, and potential multiple locations of such sources are not represented. The specific formulation of a noise source added to the glottal flow used in this study is based on Titze (2006). At every time instant the Reynolds number is calculated as
| (3) |
where ug is the instantaneous glottal flow, L is the length of the glottis, ρ is the air density, and μ is the air viscosity (Titze, 2006). The noise component of the flow is then generated in the form proposed by Fant (1960) such that
| (4) |
where Nf is a broadband noise signal (random noise generated with values ranging in amplitude from −0.5 to 0.5) that has been band-pass filtered between 300–3000 Hz (2nd order Butterworth), Re is the calculated Reynolds number, and Rec is a threshold value below which no noise is allowed to be generated. Fant (1960) suggested that Rec should be on the order of 1800 or less for fricative sounds. Based on spectral analysis of simulated vowels and preliminary listening experiments, a value of Rec=1200 was chosen, along with the scaling factor of 4 × 10⁻⁶, for all subsequent simulations in this study. The result is a noise source whose amplitude is modulated by the magnitude of instantaneous air flow through the glottis, whether during periods of vocal fold vibration or non-vibratory abductory maneuvers. A similar noise source is used in the vocal tract during production of sounds with severe constrictions such as stops, affricates, and fricatives. If the Reynolds number at any point along the vocal tract length exceeds the threshold given in Eqn. 4, a noise source is switched on at a location immediately downstream of that point.
2.4. Model implementation
The complete model is currently implemented with a combination of code written in C and Matlab (2011). The vocal fold motion, flow calculations, and acoustic wave propagation are written in C and compiled as a Matlab mex file. Additional Matlab code is used to generate the time-varying area function and time-dependency of all parameters shown in Fig. 1. In its current form, the model runs with a compute-time to real-time ratio of about 2:1 on an iMac with 3.4 GHz processor, but it would be possible to optimize the code for near real-time operation if desired.
Because the airway modulation model is largely represented by modifying the shape of a tubular structure, it has been given the colloquial name of “TubeTalker” in some earlier publications where it was used to generate simple utterances. In the remainder of this article, TubeTalker will be used synonymously with airway modulation model.
3. Simulation of word-level and phrase-level speech
In this section, two words and two phrases simulated with the TubeTalker system are demonstrated graphically and with multimedia content. The words are “Ohio” and “Abracadabra”, and the phrases are “He had a rabbit” and “The brown cow.” These were chosen to show how the various components of the Tube Talker model can be used to produce a range of speech sounds in a connected speech context. The word Ohio provides a case where the change in vocal tract shape is based only on vowels, and the consonant [h] requires only a glottal change (i.e., abduction). In contrast, Abracadabra contains two clusters ([b ɹ]), albeit the same one twice, an unvoiced velar stop, and a voiced alveolar stop. The two phrases increase the level of complexity by requiring multiple abductory maneuvers at the glottis in He had a rabbit, as well as production of a nasal consonant directly preceding an unvoiced velar stop in The brown cow.
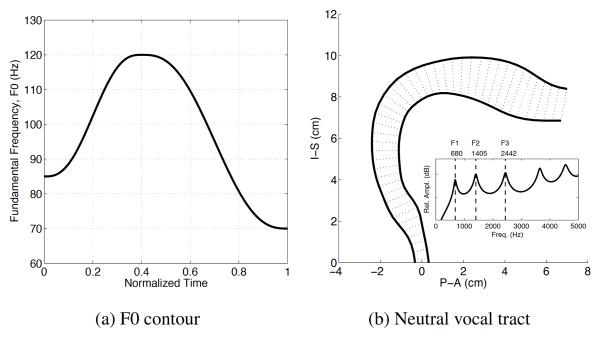
To simplify the presentation, the same rising and falling fundamental frequency (F0) contour was used for all four cases, as shown in Fig. 5a. The F0 range is representative of a typical adult male talker. In addition, the bronchial pressure was kept constant throughout each utterance at a value of 7840 dyn/cm2 (equivalent to 8 cmH2O), and the separation of the vocal processes was maintained at ξ02 = 0.1 cm for all voiced portions. The neutral vocal tract shape is shown in Fig. 5b in a “pseudo-midsagittal” configuration generated by plotting equivalent diameters of the neutral area function (red curve in Fig. 4) along a curved vocal tract profile. This view is more anatomically-intuitive than the area function representation, and will be used to demonstrate changes of vocal tract shape for the subsequent cases. This particular shape was the baseline vocal tract configuration on which all other vocal tract shape changes were superimposed. As indicated by the frequency response curve in the inset plot, it has resonances corresponding to F1, F2, and F3 located at 680, 1405, and 2442 Hz, respectively. A simulation based on the neutral tract shape and the F0 contour can be heard by playing Audio Clip 0.
Figure 5.
Baseline settings for all simulations. (a) F0 contour. (b) Neutral vocal tract configuration on which all shape perturbations were imposed. The inset plot shows the calculated frequency response this shape, where the first three formant frequencies are indicated by the dashed lines.
Temporal variation of the model parameters for each word or phrase was based on audio recordings of the same talker from whom the vocal tract shape was derived (Story, 2009a). Formant frequencies were extracted from the vowel portions of each recording using an LPC tracking algorithm programmed in Matlab (2011). Any breaks in the formant tracks due to the presence of consonants were replaced with an interpolation from the vowel preceding the break to the vowel following the break. The formant tracks for F1 and F2 were then converted to mode coefficients via the mapping shown previously in Fig. 3 to provide the Tier I parameters for vowel production. The timing of the glottal, consonant, and nasal port parameters were determined largely by inspection of the audio record and subsequent trial and error3.
3.1. Word 1: “Ohio”
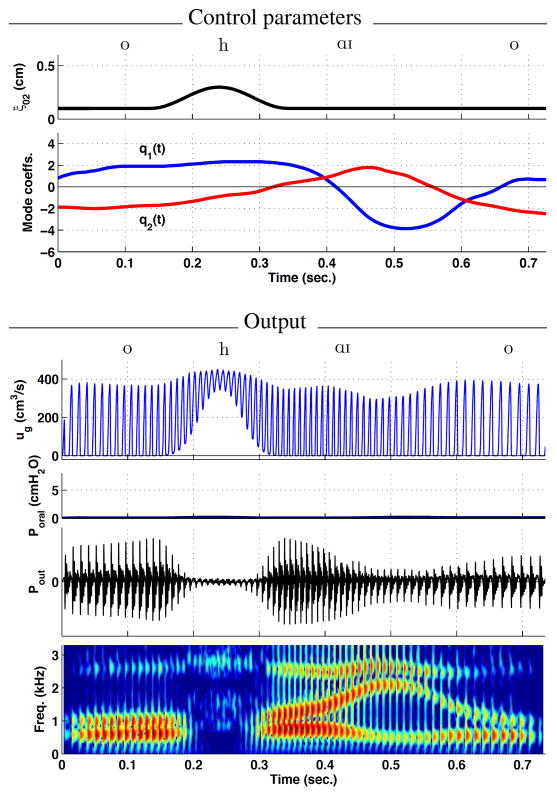
The word Ohio was chosen as a first demonstration because it requires a time-varying specification of only the glottal parameter ξ02(t) (vocal process separation) and the vowel parameters [q1(t), q2(t)]. As can be seen in the top panel of Fig. 6, the value of ξ02(t) was set to be constant at 0.1 cm throughout the time course of the word except for a period from 0.15–0.32 seconds where it was increased to 0.3 cm to produce the aspiration and reduced vocal fold vibration for the [h] sound. The mode coefficient trajectory from Fig. 3a is shown as two time-dependent functions in the second panel of Fig. 6; there is little change in the mode coefficients from 0–0.2 seconds while the initial [o] and [h] onset are produced, but then change rapidly for the diphthong [ɑ ɪ] and then final vowel [o].
Figure 6.
Simulation of the word Ohio. Time-dependent control parameters are shown in the upper two panels; for this word, only ξ02 and the mode coefficients [q1, q2] were varied. Glottal flow ug, intraoral pressure Poral, total radiated pressure Pout, and the wide-band spectrogram of Pout are shown in the lower four panels.
Shown in the next three panels of Fig. 6 are selected waveforms produced by the simulation. They are glottal flow ug(t), intraoral pressure Poral(t), and radiated pressure Pout (i.e., the speech signal). The glottal flow waveform is a train flow pulses whose periods vary according to the F0 contour discussed previously. In addition the DC (non-oscillatory) component increases during the period of time that the distance between the vocal processes ξ02(t) increases due to the abductory maneuver for the [h] and generates aspiration noise. This has the effect of decreasing the amplitude of the radiated pressure. The intraoral pressure Poral signal is determined as the low-pass filtered total pressure at a point near the velar region in the vocal tract area function, and is nearly zero during the entire utterance because there are no periods of vocal tract occlusion. In the bottom panel is the wide-band spectrogram of the speech signal. It clearly shows devoiced and turbulent nature of the [h] sound, and also the rapid change in the F2 formant frequency as the [h] is released into the following diphthong [ɑ ɪ].
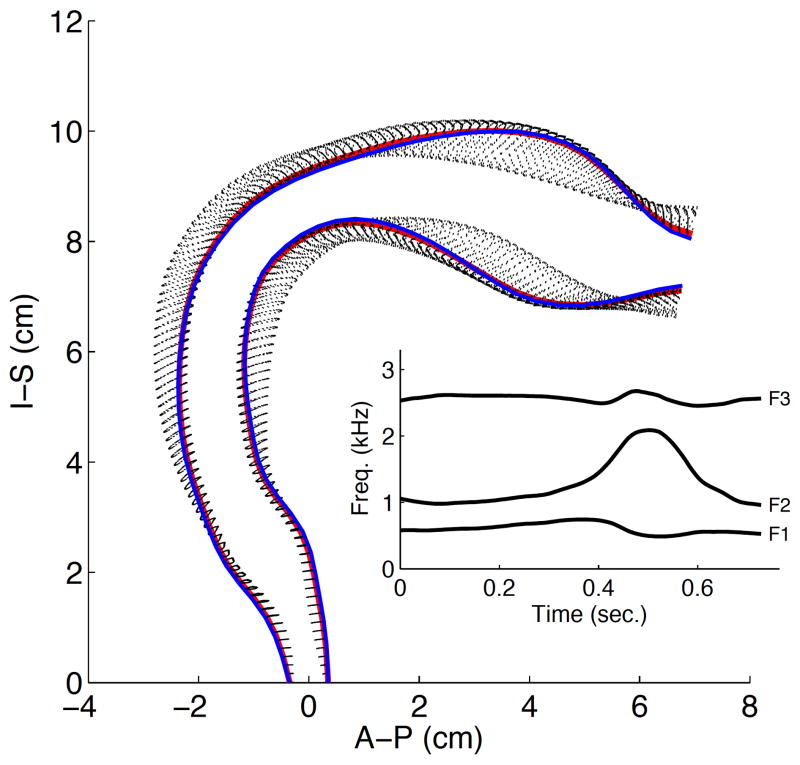
The temporal change in the vocal tract shape during production of Ohio is shown in Fig. 7. The red lines represent the configuration at the beginning of the utterance whereas the blue lines represent the utterance end; the dotted black lines indicate the variation in shape that occurs during the utterance. In this case, the initial and final vocal tract configurations were nearly the same, thus the red and blue lines fall almost on top of each other. The inset plot shows the variation of first three formant frequencies calculated directly based on the modulation of the neutral vocal tract shape; they follow essentially same path as the formant bands in the spectrogram (Fig. 6 bottom panel) except that the break in the formants due to the unvoiced [h] is not present. The speech signal can be heard by playing Audio Clip 1. An animation of the vocal tract producing Ohio is available for viewing in Video Clip 1; it shows a slow motion (without audio) view of the vocal tract movement along with a running wide-band spectrogram.
Figure 7.
Vocal tract modulation for Ohio. The red lines represent the configuration at the beginning of the utterance, the blue lines represent the utterance end, and the dotted black lines indicate the variation in shape that occurs during the utterance. The inset plot shows the variation of first three formant frequencies calculated directly based on the changing vocal tract shape.
3.2. Word 2: “Abracadabra”
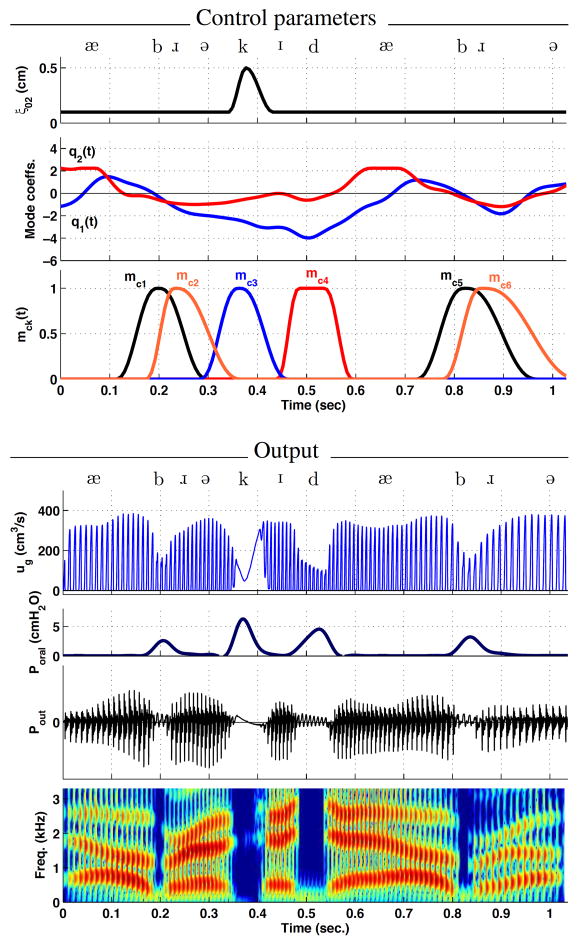
The second simulation was the word Abracadabra. The control parameters shown in Fig. 8 indicate a more complex specification of temporal variation than the previous case. At the glottal level, the ξ02 value is maintained at 0.1 cm throughout the utterance except for a period from 0.35–0.42 seconds where it is briefly increased to 0.5 cm for the voiceless [k]. The mode coefficients in the second panel dictate a modulation of the vocal tract shape that produces the continuous vowel sequence [æ → ə → ɪ → æ → ə] while the third panel shows the magnitude functions mck that are responsible for imposing and removing constrictions at specific locations along the vocal tract length.
Figure 8.
Simulation of the word Abracadabra. Time-dependent control parameters are shown in the upper three panels: vocal process separation ξ02, mode coefficients [q1, q2], and consonant magnitude functions mck Additional parameters associated with the mck ck functions are provided in Table 1. Glottal flow ug, intraoral pressure Poral, total radiated pressure Pout, and the wideband spectrogram of Pout are shown in the lower four panels.
The time-dependent shape of each mck (t) was generated with a minimum jerk interpolation (cf. Story, 2005a) for which the time points and amplitudes of the onsets, peaks, and offsets are specified. The function labeled mc1 in the figure occurs first in time and generates a constriction at the lips for the initial [b]. The second function mc2 begins just slightly later in time to impose the appropriate constriction for [ɹ]. The large amount of overlap of these two functions is necessary to generate the two consonants as a cluster. These same two functions are repeated, but with slightly longer durations, near the end of the word to generate the second [b ɹ] cluster (hence, they are not separately labeled in the figure). The mc3 and mc4 functions impose constrictions in the tract for [k] and [d], respectively.
The locations lc, cross-sectional areas ac, and extents rc of each constriction associated with the magnitude functions are shown in the upper part of Table 1. Both the locations and extents are given in centimeters; for lc this denotes distance from the glottis, and rc values denote a section of the vocal tract around the specified location that is affected by the imposed constriction4. For example, the location associated with mc1 is lc = 17.5 cm meaning that the constriction is imposed at the lips, produces a cross-sectional area of ac = 0.0 cm2, and affects 2.8 cm of the vocal tract length around lc. For the [ɹ] generated by mc2, two constriction locations are specified, one in the oral cavity at 13.4 cm from the glottis and another in the pharyngeal portion at 4.7 cm; also, because the vocal tract does not become fully occluded during an [ɹ], the cross-sectional areas associated with mc2 are nonzero.
Table 1.
Control parameter values for simulating utterances. Each mcn is a time-dependent consonant magnitude function that imposes a constriction based on the parameter values shown; lc is the constriction location as distance from the glottis (see Fig. 4); ac is the cross-sectional area at lc when the constriction is fully expressed in the vocal tract shape; rc is the extent of the vocal tract length around lc that is affected by the constriction.
| Abracadabra | |||||
|---|---|---|---|---|---|
| mc1 | mc2 | mc3 | mc4 | ||
| lc (cm) | 17.5 | [13.4, 4.7] | 12.6 | 15.1 | |
| ac (cm2) | 0.0 | [0.40, 0.20] | 0.0 | 0.0 | |
| rc (cm) | 2.8 | [1.8, 1.8] | 4.7 | 3.2 | |
|
| |||||
| He had a rabbit | |||||
| mc1 | mc2 | mc3 | mc4 | ||
|
| |||||
| lc (cm) | [15.1 → 12.8] | 17.5 | 4.7 | 15.1 | |
| ac (cm2) | [0.0 → 0.5] | [0.5 → 0.0] | 0.4 | 0.0 | |
| rc (cm) | [1.9 → 3.2] | 1.6 | 1.9 | 1.9 | |
|
| |||||
| The brown cow | |||||
| mc1 | mc2 | mc3 | mc4 | mc5 | |
|
| |||||
| lc (cm) | 15.6 | 17.5 | [13.1, 4.7] 14.7 | 12.8 | |
| ac (cm2) | 0.02 | 0.0 | [0.1, 0.4] | 0.0 | 0.0 |
| rc (cm) | 1.6 | 1.9 | [2.5, 1.6] | 1.9 | 7 |
Two values separated by a comma indicates that two locations within the vocal tract are simultaneously affected by the magnitude function, whereas if connected by an arrow the first parameter value is interpolated to the second over the time course of the simulation.
Simulated waveforms and the spectrogram of the speech signal are shown in the lower part of Fig. 8. The glottal flow is periodic throughout the word except during the [k] where there is both abduction of the vocal fold processes and occlusion of the vocal tract. In addition, the amplitude of the glottal flow is reduced when constrictions are imposed on the tract shape, and coincides with the increases in intraoral pressure that can be seen just below the glottal flow. The speech signal Pout includes pressure radiated at both the lips and skin surfaces, where the latter can be observed as the low amplitude periodicity during the [b] and [d] consonants. The wide-band spectrogram in the bottom panel indicates the time variation of the first three formants and their clear interruption during time periods where the vocal tract is occluded, or nearly so.
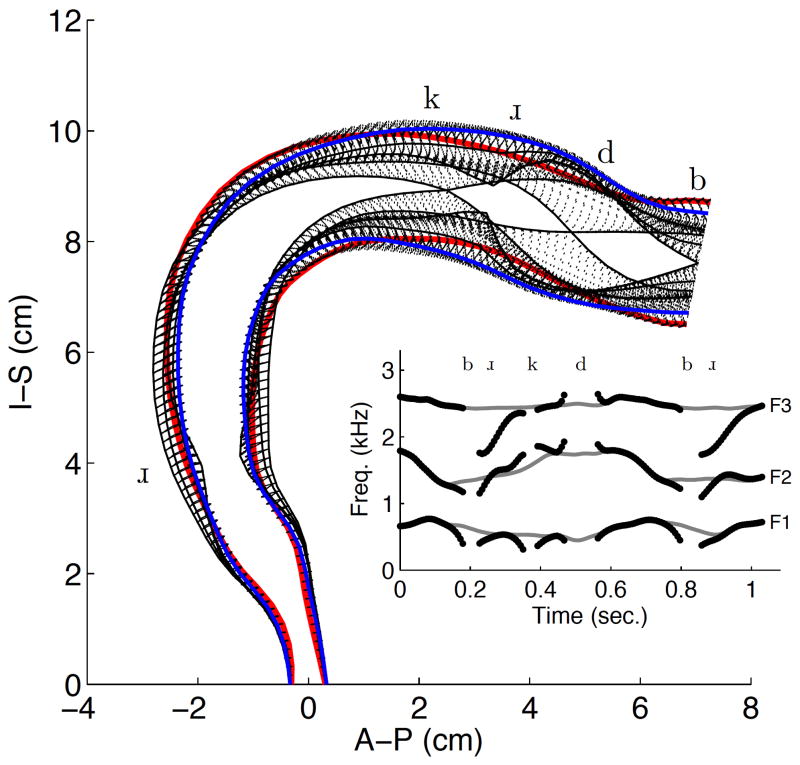
The temporal change in the vocal tract shape during production of Abracadabra is shown in Fig. 9 along with the formant tracks in the inset plot. The phonetic symbols mark the approximate locations in space and time where the associated constrictions occur. The formant tracks illustrate the acoustic manifestation of Tiers I and II of the model (see Fig. 1). In Tier I, the mode coefficients produce continuously varying shaping actions that modulate the configuration neutral vocal tract shape, and consequently generate the smoothly varying formant frequencies shown as gray lines in the background. The magnitude functions in Tier II rise quickly to impose a constriction and rapidly decrease to remove it. The acoustic effect, shown as a series of black dots in figure, is to deflect the formants away from the underlying vowel transition, in directions determined by the constriction location, for short periods of time and then allow them to return.
Figure 9.
Vocal tract modulation for Abracadabra. The red lines represent the configuration at the beginning of the utterance, the blue lines represent the utterance end, and the dotted black lines indicate the variation in shape that occurs during the utterance. The solid black lines denote tract shapes at points in time where an imposed constriction is fully expressed. The phonetic symbols are shown at the approximate locations where the associated constrictions occur. The first three formant frequencies are shown in the inset plot as a series of dark points and the gray lines are time-variations of the three formants that would occur in the absence of any imposed constrictions.
The speech signal resulting from the simulation of Abracadabra can be heard by playing Audio Clip 2a. The second clip (Audio Clip 2b) is the same simulation but with the magnitude functions and changes in ξ02 removed; it is essentially like listening to speech produced with the formants shown as gray lines in Fig. 9. A vocal tract animation is available for viewing in Video Clip 2. It again shows a slow motion (without audio) view of the vocal tract movement along with a running wide-band spectrogram.
3.3. Phrase 1: “He had a rabbit”
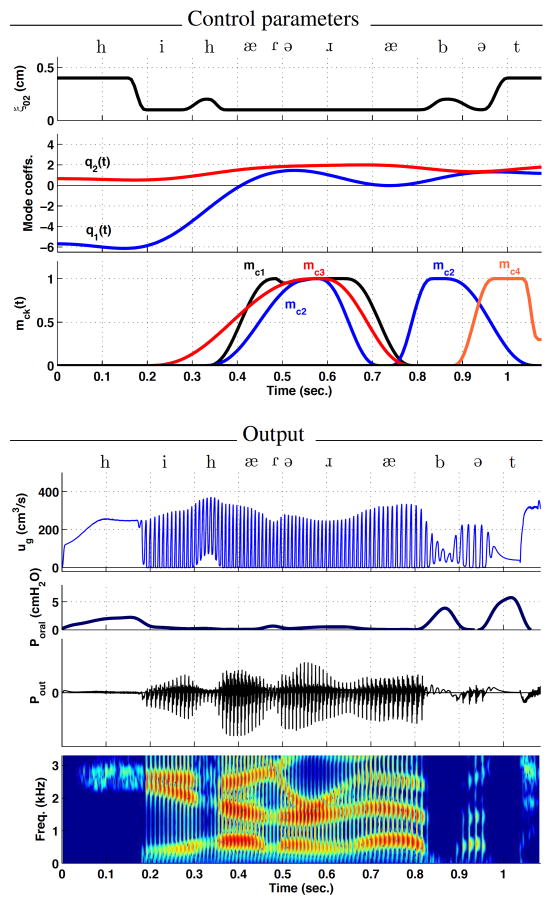
The control parameters and output quantities for the phrase He had a rabbit are shown in Fig. 10. This simulation is more complex than the previous cases because there are multiple abductory/adductory maneuvers required at the glottis, and heavily overlapped vocal tract constrictions. At the beginning of the utterance ξ02 is constant at a value 0.4 cm in order to generate the initial [h], while the vocal tract is configured in an [i]-like shape in preparation for the following vowel. This produces a high steady glottal flow with turbulence and results in a low amplitude noise signal radiated at the lips, as can be seen in the Pout signal. It is noted that there is some increase in intraoral pressure during this [h] because of the constricted oral cavity already in place for the following [i] vowel. The spectrogram during this period of time shows a band of noise at about 2.7–3.0 kHz, followed by the appearance of three formant bands arranged in a pattern indicative of an [i].
Figure 10.
Simulation of the phrase He had a rabbit. Parameters and waveforms are displayed in the same order as in Fig. 8. Additional parameters associated with the mck functions are provided in Table 1.
At 0.3 seconds, ξ02 increases slightly to 0.2 cm to produce the second [h] and then returns to 0.1 cm for the next voiced portion extending to 0.8 seconds. During this span of voicing, multiple constrictive actions are generated in rapid succession by magnitude functions mc1, mc2 and mc3. The first function, mc1, is used to generate a brief constriction for what is effectively an alveolar tap at 0.48 seconds. The amplitude of the function then drops slightly but then returns to a value of one by 0.55 seconds to produce a constriction for the [ɹ]. This is realized in the model by shifting the constriction location lc, and modifying the cross-sectional area ac and the extent rc, over the time course of mc1 as indicated in the middle part of Table 1. The second and third magnitude functions (mc2 and mc3) create additional constrictions in the pharynx and at the lips, respectively, for production of the [ɹ]. The overall effect of these constrictions on the output waveforms is to modulate the amplitudes of the glottal flow and radiated pressure signal. It can be seen in the spectrogram that, from about 0.35–0.8 seconds, the formant bands are fairly evenly spaced for the [æ], briefly lose some amplitude during the tap, and then F3 is shifted downward during [ɹ] before rising again for the second [æ].
There is an additional nonzero portion of mc2 extending from 0.75–1.1 seconds that executes a bilabial constriction for the [b]. During this time, a slight abduction is imposed for the [b], even though it is a “voiced” consonant, but was needed in order to match the devoicing observed in the audio recording. It could likely be removed without any loss of intelligibility, however. The final magnitude function mc4 generates a constriction for the [t] and coincides with an abduction of the vocal processes reflected as an increase of ξ02 from 0.1 cm to 0.4 cm. Both constrictions produce a full occlusion of the vocal tract and consequently allow the intraoral pressure to build up prior to their release. The glottal flow in this time period is reduced in amplitude when the constrictions are present and then increases rapidly following the release of the [t] constriction. The effects are displayed in the spectrogram as very low frequency energy between 0.82–0.9 seconds, distinct formant frequencies from 0.9–0.97 seconds, silence during 0.97–1.3 seconds, and finally a strong band of noise centered around 2.9 kHz.
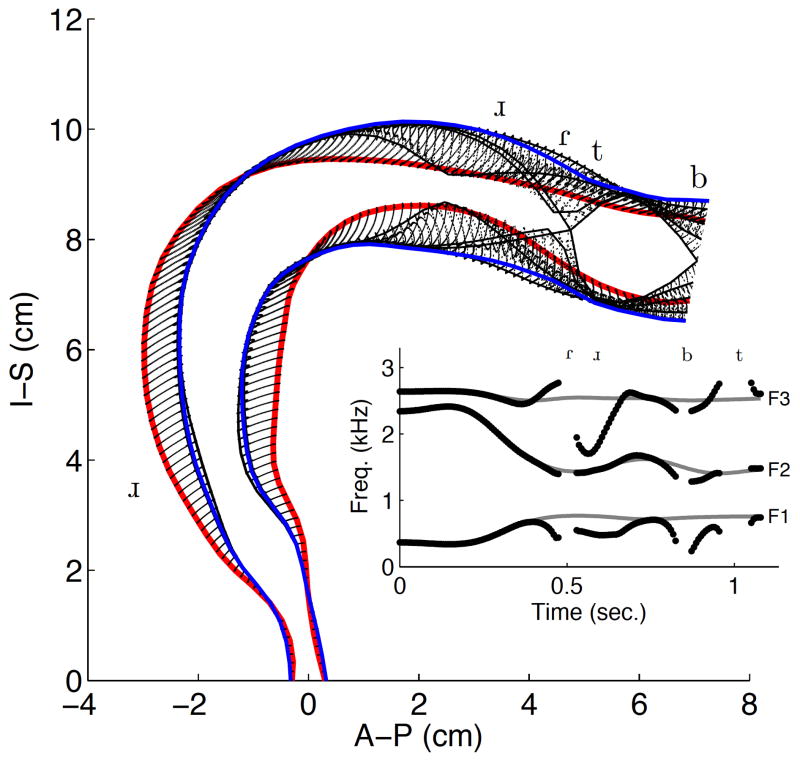
The modulation of the vocal tract prescribed by the control parameters for He had a rabbit is shown in Fig. 11. The first three formant frequencies are shown in the inset plot in the same manner as in Fig. 9 where the gray lines are formants that would exist without the constrictions imposed. The constrictions deflect the formants away from the vowel sequence for short periods of time and then return to match the gray lines during periods of vowel production. The speech signal for He had a rabbit can be heard by playing Audio Clip 3a, whereas Audio Clip 3b is the same simulation without consonants and glottal changes. A vocal tract animation along with a running wide-band spectrogram is available for viewing in Video Clip 3.
Figure 11.
Vocal tract modulation and formant frequencies for He had a rabbit shown in the same format as in Fig. 9.
3.4. Phrase 2: ‘The brown cow”
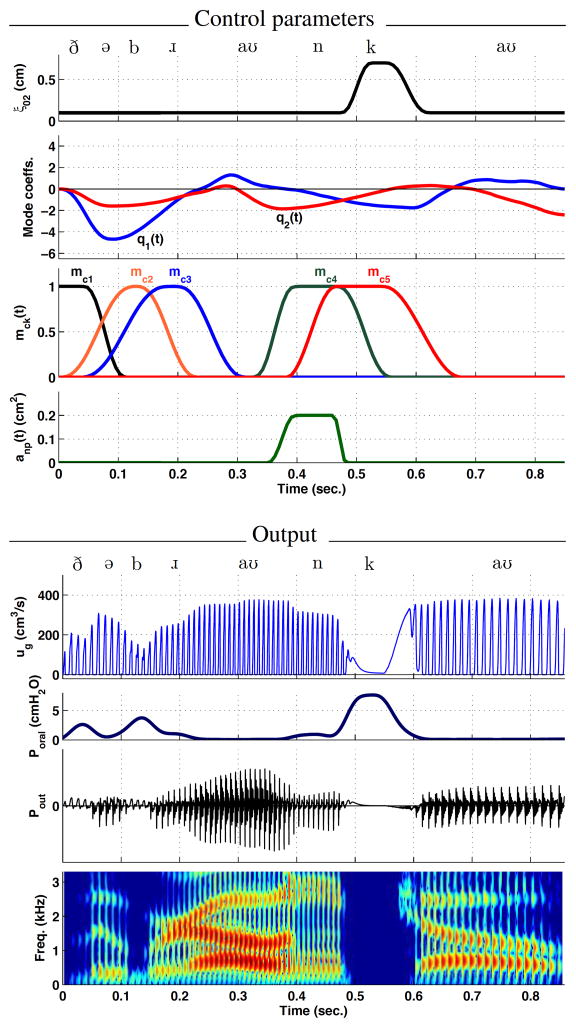
The second phrase simulated was The brown cow. The control parameters, output waveforms, and spectrogram are presented in Fig. 12. In comparison to the previous simulations, the novel of part of this phrase is the succession of the nasal consonant [n] immediately followed by the velar stop [k]. This means that in addition to the adductory, vowel, and constriction parameters, the temporal variation of the nasal port area must also be specified.
Figure 12.
Simulation of the phrase The brown cow. Time-dependent control parameters are shown in the upper four panels as in previous figures but with the addition of nasal port area anp. Parameters associated with the mck functions are provided in Table 1. Glottal flow ug, intraoral pressure Poral, total radiated pressure Pout, and the wide-band spectrogram of Pout are shown in the lower four panels.
The phrase begins with ξ02 set to 0.1 cm to allow for vocal fold vibration, and a constriction is imposed in the vocal tract by function mc1 just posterior to the lips for production of the voiced fricative [ð]. The constriction location, cross-sectional area, and extent are given in lower part of Table 1; it is noted that the cross-sectional area of the constriction is nonzero (ac = 0.02 cm2) to allow for frication turbulence to be generated. From the waveform plots, the constriction can be seen to reduce the amplitude of the glottal, increase the intraglottal pressure, and produce low-amplitude radiated pressure. As this function is released, mc2 is already increasing in amplitude to impose a constriction at the lips for the [b]. There is a short period of time between mc1 and mc2 during which the vocal tract is unoccluded. It is labeled phonetically in the figure as a neutral vowel, but can be seen in the spectrogram as formants transitioning from one consonant to another.
The mc2 and mc3 functions are largely overlapped in order to create the [b ɹ] cluster. That is, as the constriction is produced at the lips for the [b], constrictions for the following [ɹ] are already moving into place so that the b releases into the [ɹ] sound. This can be observed in the spectrogram from 0.1–0.3 seconds where the low amplitude portion is followed by the appearance of three formants, F3 being at a low frequency for the [ɹ] and then rising into the following vowel.
Function mc4 imposes a constriction with zero cross-sectional area at a location roughly corresponding to the alveolar ridge (14.7 cm from the glottis in Table 1). Simultaneously, the nasal port area is increased from zero to 0.2 cm2, allowing air to flow and sound to propagate through the nasal tract, resulting in production of the consonant [n]. The glottal flow waveform indicates a slight reduction in amplitude during the nasal consonant. The amplitude of the radiated pressure is also low and, for this period of time, is based on the signals exiting the nares (and skin). The spectrogram shows that the formants become somewhat ambiguous from about 0.4–0.46 seconds due to the additional poles and zeros imposed by the coupling of the nasal tract.
The [n] is followed immediately by the unvoiced velar stop [k] imposed by mc5, and the location, cross-sectional area, and extent are given in Table 1. This requires that the nasal port area return to zero quickly for proper build-up of intraoral pressure and to avoid an unwanted nasal emission. In addition, because the velar stop is unvoiced, the vocal processes must be abducted to halt vocal fold vibration and to allow the subglottal airspace to be coupled to the intraoral space. Thus, ξ02 undergoes a rapid increase from 0.1 cm to 0.7 cm to simulate the abductory maneuver. There is a slight noise burst at the release of mc5 which is most easily seen in the spectrogram at about 0.58 seconds. This is followed by the final diphthong [ɑ ʊ].
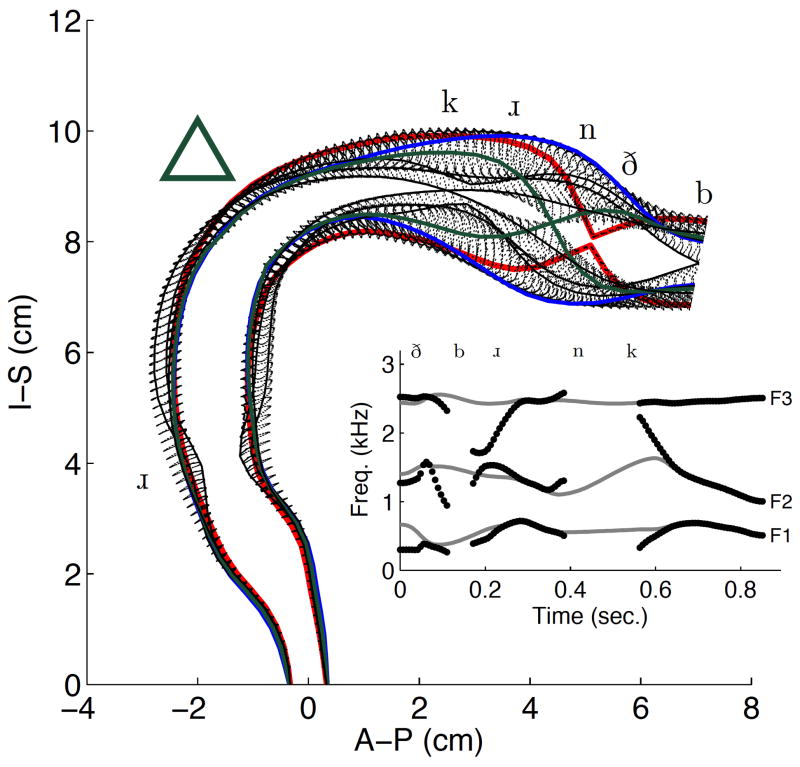
Shown in Fig. 13 is the vocal tract movement imposed by the control parameters for The brown cow. This phrase required the vocal tract to be shaped for five different consonants, and utilized the entire extent of the oral cavity for imposing constrictions as can be seen by the placement of the phonetic symbols along the vocal tract profile. The green triangle in the upper left part of the figure denotes that the nasal port was opened during the time that the tract was configured as indicated by the solid green line; i.e., during production of the [n]. The first three formants are again plotted in the inset but the effect of the nasal coupling between 0.4–0.5 seconds is not shown. The simulation of The brown cow can be heard by playing Audio Clip 4a, and Audio Clip 4b is the vowels-only version. Animation of the vocal tract movements can be viewed in Video Clip 4 along with the associated wide-band spectrogram.
Figure 13.
Vocal tract modulation for The brown cow shown in the same format as in Figs. 9 and 11.
3.5. Intelligibility and Naturalness
The primary focus of the present study was to describe the model and demonstrate that it can simulate speech suitable for future studies of speech acoustics and speech perception. It is of interest to know, however, to what degree listeners can recognize the simulated words and phrases, and if they think they sound like a human talker. Toward this goal, a rudimentary test of intelligibility and naturalness of the two words and two phrases was conducted. Graduate students were asked to participate as listeners in a classroom environment. They were told that they would hear four audio samples produced by a speech synthesizer and their task was to write the word or phrase. In addition they were asked to rate the naturalness of each sample on a scale where 1 was “machine-like” and 10 was “human-like.” All samples were presented at a comfortable listening level via a single monitor loudspeaker (Yamaha, MSP3) placed near the front and center of the classroom. Prior to presentation of the first speech sample, the vowel sound produced by the neutral vocal tract (Audio Clip 0) was played for the listeners to familiarize them with the voice quality. The words and phrases were then played once each with a pause between to allow the listeners to complete the recognition and rating tasks. There were a total of 39 listeners, all of whom reported that American English was their primary spoken language. Intelligibilty was scored as the number of words correct for each sample.
The percent correct scores for Ohio, Abracadabra, He had a rabbit and The brown cow were 100, 97, 85, and 97 percent, respectively. The phrase He had a rabbit had the lowest intelligibility score, but this was primarily because several listeners transcribed it as “Peter the rabbit,” the well known character in a series of children’s stories; this is not surprising considering that the phrase was played to the listeners without any context.
The naturalness ratings spanned the entire scale from 1 to 10 for each of the four samples, however the median values leaned toward the “machine-like” end of the scale with a rating of 3 for Abracadabra and a rating of 4 for the other three samples. Discussions with the listeners following data collection did not reveal any particular aspect of the simulations that were regarded as “unnatural,” rather there was simply a sense that the sounds they were hearing were not fully human. It is possible that informing the listeners a priori that the samples were synthesized speech biased them toward rating closer to the machine-like end of the scale. Highly controlled tests are needed in the future to more thoroughly determine both naturalness and intelligibility of the speech produced by the model.
3.6. Modifications to the phrases
Once the temporal variation of the control parameters for a given word or phrase has been established, various aspects of the model can be altered. For example, the underlying structure of the vocal tract could be modified with respect to its length and distribution of cross-sectional areas; the timing of the constrictions could be stretched or compressed; the vocal folds could be set to produce a breathy or pressed quality, or contain a tremor; the nasal port could be kept open to simulate hypernasal speech. The ability to make such modifications is useful for conducting simulation and perceptual studies related to speech disorders or speech qualities. As a demonstration, the phrases presented in the previous two sections have been modified in several ways. These are described below and can be heard by playing the associated audio files.
-
The neutral vocal tract shape, specified as Ω (x) in the model, was modified to produce two different sound qualities for the phrase “He had a rabbit.” In the first case, the pharyngeal portion of Ω (x) was slightly constricted, and the oral cavity was slightly expanded. The second case was the opposite - the pharyngeal portion was slightly expanded and the oral cavity was slightly constricted. In addition, to create the impression of a large talker in both cases, the vocal tract length was increased to 19.8 cm and the mean fundamental frequency was lowered by 15 percent. The phrase was simulated with exactly the same modulations of the vocal tract and voice source as discussed previously, except they were superimposed on the two new neutral vocal tract shapes.
Audio files: rabbit altneutral1.wav and rabbit altneutral2.wav
-
The timing of all control parameters was altered such that the first half of each phrase was increased in duration by 25 percent and the latter half decreased by 25 percent. The total duration of each phrase is the same as the original.
Audio files: rabbit alttime1.wav and browncow alttime1.wav
-
The timing of all control parameters was altered such that the first half of each phrase was decreased in duration by 25 percent and the latter half increased by 25 percent. The total duration of each phrase is again the same as the original.
Audio files: rabbit alttime2.wav and browncow alttime2.wav
-
The baseline separation of the vocal processes was increased from ξ02 = 0.1 cm to ξ02 = 0.15 cm. This change has the effect of allowing a greater non-oscillatory component of the glottal flow during voicing, and results in increased glottal turbulence. The perceptual effect is a breathier voice quality.
Audio files: rabbit breathy.wav and browncow breathy.wav
-
The nasal coupling area was maintained at a minimum value of 0.2 cm2 throughout the duration of each phrase. The effect is to nasalize all portions of the phrases resulting in a hypernasal quality.
Audio files: rabbit nasal.wav and browncow nasal.wav
-
The entry area to the vocal tract was increased to effectively widen the epilaryngeal tube. This modification alters the voice quality in two ways - the first three formants are shifted slightly downward in frequency and the glottal flow waveform is altered. The perceptual effect is a darker voice quality.
Audio files: rabbit epiwide.wav and browncow epiwide.wav
4. Conclusion
An airway modulation model called TubeTalker was introduced as a system for generating artificial speech. The overall goal in developing the model is to facilitate an understanding of how modulations of the basic structure of the glottis and vocal tract are acoustically encoded in the time variation of the speech signal, and perceptually decoded by a listener into phonetic elements. The model encodes the speech signal by assuming that: 1) an acoustically neutral state of the vocal tract generates resonance characteristics unique to a speaker or particular style of speaking; 2) the speech signal is produced by a hierarchy of modulations that are imposed on the acoustically-neutral state of the vocal tract and glottis; and 3) relations between the levels in the modulation hierarchy generate specific acoustic characteristics that provide cues to phonetic categories. The result is a speech signal in which the acoustic characteristics of the voice source and neutral vocal tract serve as a carrier for the acoustic perturbations produced by vowel-like and obstruent-like modulations. Perceptual decoding of speech may then be thought to consist of demodulating the acoustic signal to acquire the information embedded by each layer of the hierarchy.
Tube Talker is not an articulatory model per se, since it does not allow for direct control of the position and movement of the tongue, velum, lips, and jaw as do other speech production models (e.g., Rubin et al., 1981; Birkholz et al., 2006). The mode-based control tier for vowel production (Tier I in Fig. 1), however, was derived from statistical analyses of vocal tract shapes measured from real talkers (cf. Story and Titze, 1998; Story, 2005a, 2007), and the characteristics of the consonant constrictions were based on measured area functions (Story, 2005a). Thus, the model is related to physiological aspects of human speech production, just not directly via the obvious articulatory structures. An advantage is that it does allow direct access to the shape of the glottal airspace and the vocal tract with a control system constructed to modulate the airspaces on multiple time scales and at multiple levels.
Such a model is useful for investigating questions about how the speech signal is affected by airway modulations of different types and at various locations within the speech production system. For example, if the underlying vocal fold or vocal tract structure is altered but the temporal patterns for vowel production and constriction formation remain the same, does the speech signal remain intelligible, even though it will be acoustically different? Are there phase relations of modulations among the control tiers that are necessary in order to maintain or preserve acoustic characteristics that cue perception? What would be the acoustic and perceptual effect of shifting one or more of the consonant constriction functions slightly forward or backward in time, say, for example, in the He had a rabbit phrase? How much could they be shifted without altering the percept? What effect would slight changes in constriction location or extent have on the acoustic characteristics of the speech signal? Future studies using TubeTalker may yield insights into how the structure and systematic movement of the vocal tract and vocal folds supports the emergence of phonetically-relevant acoustic properties, while simultaneously allowing the speech signal to be highly variable.
Supplementary Material
Highlights.
An airway modulation model of speech production was developed for simulating speech.
Model-based simulations are shown for two words and two phrases.
Audio samples and animations of vocal tract movement are included for each simulation.
Acknowledgments
This research was supported by NIH R01 DC04789 and NIH R01 DC011275. A preliminary version of this work was presented at the 2011 International Workshop on Performative Speech and Singing Synthesis in Vancouver, BC.
Footnotes
The formant values were derived from calculations of the frequency response of each area function based on a transmission line technique (Sondhi & Schroeter, 1987; Story et al., 2001.)
Story (2009b) describes a method for extracting model parameters for VCVs from articulatory fleshpoint data, but is not yet developed to the point of providing adequate information at the word or phrase level.
If the baseline vocal tract configuration were modified such that the overall tract length were longer or shorter, both lc and rc could be specified as percentage of the total tract length rather than absolute length values as used here.
Publisher's Disclaimer: This is a PDF file of an unedited manuscript that has been accepted for publication. As a service to our customers we are providing this early version of the manuscript. The manuscript will undergo copyediting, typesetting, and review of the resulting proof before it is published in its final citable form. Please note that during the production process errors may be discovered which could affect the content, and all legal disclaimers that apply to the journal pertain.
References
- Atal BS, Chang JJ, Mathews MV, Tukey JW. Inversion of articulatory-to-acoustic transformation in the vocal tract by a computer sorting technique. J Acoust Soc Am. 1978;63:1535–1555. doi: 10.1121/1.381848. [DOI] [PubMed] [Google Scholar]
- Baer T, Gore JC, Gracco LC, Nye PW. Analysis of vocal tract shape and dimensions using magnetic resonance imaging: Vowels. J Acoust Soc Am. 1991;90:799–828. doi: 10.1121/1.401949. [DOI] [PubMed] [Google Scholar]
- Bauer D, Birkholz P, Kannampuzha J, Kröger BJ. Evaluation of articulatory speech synthesis: a perception study. 36th Deutsche Jahrestagung fr Akustik (DAGA 2010); Berlin, Germany. 2010. pp. 1003–1004. [Google Scholar]
- Båvegård M. Proceedings Eurospeech. Vol. 95. Madrid, Spain: 1995. Introducing a parametric consonantal model to the articulatory speech synthesizer; pp. 1857–1860. [Google Scholar]
- Birkholz P, Jackel D, Kröger BJ. Construction and control of a three-dimensional vocal tract model. Proc. Intl. Conf. Acoust., Spch, and Sig. Proc. (ICASSP 2006); Toulouse, France. 2006. pp. 873–876. [Google Scholar]
- Birkholz P, Jackel D, Kröger BJ. Simulation of losses due to turbulence in the time-varying vocal system. IEEE Trans Aud, Speech and Lang Proc. 2007;15(4):1218–1226. [Google Scholar]
- Birkholz PD, Kröger BJ, Neuscheafer-Rube C. Articulatory synthesis and perception of plosive-vowel syllables with virtual consonant targets. Proc. Interspch; Makuhari, Japan. 2010. pp. 1017–1020. [Google Scholar]
- Bunton K, Story BH. Identification of synthetic vowels based on selected vocal tract area functions. J Acoust Soc Am. 2009;125(1):19–22. doi: 10.1121/1.3033740. [DOI] [PMC free article] [PubMed] [Google Scholar]
- Bunton K, Story BH. Identification of synthetic vowels based on a time-varying model of the vocal tract area function. J Acoust Soc Am. 2010;127(4):EL146–EL152. doi: 10.1121/1.3313921. [DOI] [PMC free article] [PubMed] [Google Scholar]
- Bunton K, Story BH. The relation of nasality and nasalance to nasal port area based on a computational model. The Cleft Palate-Craniofacial Journal. 2011 doi: 10.1597/11–131. [DOI] [PMC free article] [PubMed] [Google Scholar]
- Carré R, Chennoukh S. Vowel-consonant-vowel modeling by superposition of consonant closure on vowel-to-vowel gestures. J Phonetics. 1995;23:231–241. [Google Scholar]
- Coker CH. A model of articulatory dynamics and control, Proc. IEEE. 1976;64(4):452–460. [Google Scholar]
- Dang J, Honda K. Construction and control of a physiological articulatory model. J Acoust Soc Am. 2004;115:853–870. doi: 10.1121/1.1639325. [DOI] [PubMed] [Google Scholar]
- Dudley H. Remaking speech. J Acoust Soc Am. 1939;11(2):169–177. [Google Scholar]
- Dudley H. The carrier nature of speech. Bell Sys Tech J. 1940;19(4):495–515. [Google Scholar]
- Dudley H, Riesz RR, Watkins SSA. A synthetic speaker. J Franklin Inst. 1939;227(6):739–764. [Google Scholar]
- Fant G. The Acoustic Theory of Speech Production. The Hague: Mouton; 1960. [Google Scholar]
- Fant G. Vocal tract area functions of Swedish vowels and a new three-parameter model. Proc ICSLP-92. 1992;1:807–810. [Google Scholar]
- Fant G. Swedish vowels and a new three-parameter model. TMH-QPSR. 2001;42(1):43–49. [Google Scholar]
- Fant G, Båvegård M. Parametric model of VT area functions: vowels and consonants. TMH-QPSR. 1997;38(1):1–20. [Google Scholar]
- Flanagan JL, Cherry L. Excitation of vocal-tract synthesizers. J Acoust Soc Am. 1969;45(3):764–769. doi: 10.1121/1.1911461. [DOI] [PubMed] [Google Scholar]
- Gracco VL. Characteristics of speech as a motor control system, Haskins Labs. Stat Rep Spch Res. 1992;SR-109/110:13–26. [Google Scholar]
- Kelly JL, Lochbaum CC. Speech synthesis. Proc. Fourth Intl. Cong. Acous., Paper G42; 1962. pp. 1–4. [Google Scholar]
- Laakso TI, Valimaki V, Karjalainen M, Laine UK. Splitting the unit delay, IEEE Sig. Proc Mag. 1996;13(1):3061. [Google Scholar]
- Liljencrants J. DS Dissertation. Dept. of Speech Comm. and Music Acous., Royal Inst. of Tech; Stockholm, Sweden: 1985. Speech Synthesis with a Reflection-Type Line Analog. [Google Scholar]
- Lin Q. DS Dissertation. Dept. of Speech Comm. and Music Acous., Royal Inst. of Tech; Stockholm, Sweden: 1990. Speech production theory and articulatory speech synthesis. [Google Scholar]
- Lindblom B, Sundberg J. Acoustical consequences of lip, tongue, jaw, and larynx movement. J Acoust Soc Am. 1971;4(2):1166–1179. doi: 10.1121/1.1912750. [DOI] [PubMed] [Google Scholar]
- Maeda S. A digital simulation method of the vocal-tract system, Speech. Comm. 1982;1:199–229. [Google Scholar]
- Maeda S. Compensatory articulation during speech: evidence from the analysis and synthesis of vocal-tract shapes using an articulatory model. In: Hardcastle WJ, Marchal A, editors. Speech Production and Speech Modeling. Dordrecht: Kluwer Academic Publishers; 1990. pp. 131–149. [Google Scholar]
- Mathur S, Story BH, Rodriguez JJ. Vocal-tract modeling: Fractional elongation of segment lengths in a waveguide model with half-sample delays, IEEE Trans. Aud, Spch & Lang Proc. 2006;14(5):1754–1762. [Google Scholar]
- The Mathworks, 2011. MATLAB, Version 7.13.0.564 (R2011b).
- Mermelstein P. Articulatory model for the study of speech production. J Acoust Soc Am. 1973;53(4):1070–1082. doi: 10.1121/1.1913427. [DOI] [PubMed] [Google Scholar]
- Mrayati M, Carré R, Guérin B. Distinctive regions and modes: A new theory of speech production. Speech Comm. 1988;7:257–286. [Google Scholar]
- Öhman SEG. Coarticulation in VCV utterances: Spectrographic measurements. J Acoust Soc Am. 1966;39:151–168. doi: 10.1121/1.1909864. [DOI] [PubMed] [Google Scholar]
- Öhman SEG. Numerical model of coarticulation. J Acoust Soc Am. 1967;41:310–320. doi: 10.1121/1.1910340. [DOI] [PubMed] [Google Scholar]
- Pruthi T, Espy-Wilson C, Story BH. Simulation and analysis of nasalized vowels based on magnetic resonance imaging data. J Acoust Soc Am. 2007;121(6):3858–3873. doi: 10.1121/1.2722220. [DOI] [PubMed] [Google Scholar]
- Rubin P, Baer T, Mermelstein P. An articulatory synthesizer for perceptual research. J Acoust Soc Am. 1981;70(2):321–328. [Google Scholar]
- Samlan R, Story BH. Relation of structural and vibratory kinematics of the vocal folds to two acoustic measures of breathy voice based on computational modeling. J Spch Lang Hear Res. 2011;54:1267–1283. doi: 10.1044/1092-4388(2011/10-0195). [DOI] [PMC free article] [PubMed] [Google Scholar]
- Smith JO. Physical modeling using digital waveguides. Computer Music Journal. 1992;16(4):74–91. [Google Scholar]
- Scully C. Articulatory synthesis. In: Hardcastle WJ, Marchal A, editors. Speech Production and Speech Modeling. Dordrecht: Kluwer Academic Publishers; 1990. pp. 151–186. [Google Scholar]
- Sondhi MM, Schroeter J. A hybrid time-frequency domain articulatory speech synthesizer. IEEE Trans ASSP, ASSP-35. 1987;(7):955–967. [Google Scholar]
- Stevens KN, House AS. Development of a quantitative description of vowel articulation. J Acoust Soc Am. 1955;27(3):484–493. [Google Scholar]
- Story BH. Ph D Dissertation. University of Iowa; 1995. Physiologically-based speech simulation using an enhanced wave-reflection model of the vocal tract. [Google Scholar]
- Story BH. A parametric model of the vocal tract area function for vowel and consonant simulation. J Acoust Soc Am. 2005a;117(5):3231–3254. doi: 10.1121/1.1869752. [DOI] [PubMed] [Google Scholar]
- Story BH. Synergistic modes of vocal tract articulation for American English vowels. J Acoust Soc Am. 2005b;118(6):3834–3859. doi: 10.1121/1.2118367. [DOI] [PubMed] [Google Scholar]
- Story BH. Time-dependence of vocal tract modes during production of vowels and vowel sequences. J Acoust Soc Am. 2007;121(6):3770–3789. doi: 10.1121/1.2730621. [DOI] [PMC free article] [PubMed] [Google Scholar]
- Story BH. Vocal tract modes based on multiple area function sets from one speaker. J Acoust Soc Am. 2009a;125(4):EL141–EL147. doi: 10.1121/1.3082263. [DOI] [PMC free article] [PubMed] [Google Scholar]
- Story BH. Vowel and consonant contributions to vocal tract shape. J Acoust Soc Am. 2009b;126:825–836. doi: 10.1121/1.3158816. [DOI] [PMC free article] [PubMed] [Google Scholar]
- Story BH, Bunton K. Relation of vocal tract shape, formant transitions, and stop consonant identification. J Spch Lang Hear Res. 2010;53:1514–1528. doi: 10.1044/1092-4388(2010/09-0127). [DOI] [PMC free article] [PubMed] [Google Scholar]
- Story BH, Laukkanen A-M, Titze IR. Acoustic impedance of an artificially lengthened and constricted vocal tract. J Voice. 2000;14(4):455–469. doi: 10.1016/s0892-1997(00)80003-x. [DOI] [PubMed] [Google Scholar]
- Story BH, Titze IR, Hoffman EA. Vocal tract area functions from magnetic resonance imaging. J Acoust Soc Am. 1996;100(1):537–554. doi: 10.1121/1.415960. [DOI] [PubMed] [Google Scholar]
- Story BH, Titze IR, Hoffman EA. The relationship of vocal tract shape to three voice qualities. J Acoust Soc Am. 2001;109(4):1651–1667. doi: 10.1121/1.1352085. [DOI] [PubMed] [Google Scholar]
- Story BH, Titze IR. Parameterization of vocal tract area functions by empirical orthogonal modes. J Phonetics. 1998;26(3):223–260. [Google Scholar]
- Story BH, Titze IR. A preliminary study of voice quality transformation based on modifications to the neutral vocal tract area function. J Phon. 2002;30:485–509. [Google Scholar]
- Strube HW. Time-varying wave digital filters for modeling analog systems. IEEE Trans Acoust, Spch, Sig Proc, ASSP-30. 1982;(6):864–868. [Google Scholar]
- Titze IR. Parameterization of the glottal area, glottal flow, and vocal fold contact area. J Acoust Soc Am. 1984;75:570–580. doi: 10.1121/1.390530. [DOI] [PubMed] [Google Scholar]
- Titze IR. Regulating glottal airflow in phonation: Application of the maximum power transfer theorem to a low dimensional phonation model. J Acoust Soc Am. 2002;111:367–376. doi: 10.1121/1.1417526. [DOI] [PubMed] [Google Scholar]
- Titze IR. The Myoelastic Aerodynamic Theory of Phonation. National Center for Voice and Speech; 2006. pp. 197–214. [Google Scholar]
- Traunmüller H. Conventional, biological and environmental factors in speech communication: A modulation theory. Phonetica. 1994;51:170–183. doi: 10.1159/000261968. [DOI] [PubMed] [Google Scholar]
- Westbury JR. X-ray microbeam speech production database user’s handbook, (version 1.0)(UW-Madison) 1994. [Google Scholar]
Associated Data
This section collects any data citations, data availability statements, or supplementary materials included in this article.


