

Abstract
This article provides a brief review of multi-scale modeling at the molecular to cellular scale, with new results for heart muscle cells. A finite element-based simulation package (SMOL) was used to investigate the signaling transduction at molecular and sub-cellular scales (http://mccammon.ucsd.edu/smol/, http://FETK.org) by numerical solution of time-dependent Smoluchowski equations and a reaction-diffusion system. At the molecular scale, SMOL has yielded experimentally-validated estimates of the diffusion-limited association rates for the binding of acetylcholine to mouse acetylcholinesterase using crystallographic structural data. The predicted rate constants exhibit increasingly delayed steady-state times with increasing ionic strength and demonstrate the role of an enzyme’s electrostatic potential in influencing ligand binding. At the sub-cellular scale, an extension of SMOL solves a non-linear, reaction-diffusion system describing Ca2+ ligand buffering and diffusion in experimentally-derived rodent ventricular myocyte geometries. Results reveal the important role for mobile and stationary Ca2+ buffers, including Ca2+ indicator dye. We found that the alterations in Ca2+-binding and dissociation rates of troponin C (TnC) and total TnC concentration modulate subcellular Ca2+ signals. Model predicts that reduced off-rate in whole troponin complex (TnC, TnI, TnT) versus reconstructed thin filaments (Tn, Tm, actin) alters cytosolic Ca2+ dynamics under control conditions or in disease-linked TnC mutations. The ultimate goal of these studies is to develop scalable methods and theories for integration of molecular-scale information into simulations of cellular-scale systems.
1. Introduction
Diffusion of enzymes and ions plays an important role in a variety of biological processes and has been studied extensively using various biophysical, biochemical, and computational approaches. Computational models of diffusion have been widely used in both discrete [1] and continuum methods [2]. Discrete methods describe the stochastic trajectories of individual particles and include methods like Monte Carlo [3], Brownian dynamics [4], and Langevin dynamics [5]. Continuum approaches model particle diffusion by the evolution of continuous probability distributions and include the Smolochowski and Fokker-Planck formalisms. Relative to discrete methods, continuum approaches provide an inexpensive alternative to the modeling of individual Brownian particles.
In our previous work, we applied adaptive finite element methods to solve the time-dependent Smoluchowski equation on a single enzyme molecule (mouse acetylcholinesterase, mAChE) or clusters of mAChEs [6–8]. We observed both steady-state and time-dependent diffusive particle distributions on the diffusion domain and calculated the rate association coefficient for acetylcholine (ACh) diffusive particles. Including the electrostatic field determined by solution of the Poisson-Boltzmann equation allowed us to examine the role of electrostatics in guiding diffusive particles to the active center. This study resulted in the SMOL software package, which facilitates the finite-element solution of steady-state and time-dependent Smoluchowski equations for molecular species.
Recently, the SMOL package was generalized to model signaling transduction processes on the sub-cellular level and specifically the role of calcium (Ca2+) diffusion and binding to mobile and stationary buffers during the cardiac excitation-contraction cycle [9–11]. Previous approaches employed a systems biology approach, in which components of the myocyte are represented by simple geometries [12–14]. In recent years, advancements in the electron microscopy community have enabled the 3-dimensional (3-D) structure determination of cells and sub-cellular organelles across a wide range of spatial scales [15]. Simulations utilizing experimentally-derived structures offer a degree of realism that cannot be easily captured with reduced representations.
The extended simulation tool SMOL represents progress toward unifying molecular-level and cellular level dynamics via the solution of partial differential equations on 3-D tetrahedral meshes representative of realistic systems. In this article, we summarize capabilities of SMOL in modeling molecular-level and cellular level events, provide new data for myocyte cellular modeling, and discuss potential further applications and extensions of the SMOL multi-scale modeling tool.
2. Methods and software
2.1 Time-Dependent Smoluchowski Equation
The starting point for solving the time-dependent SMOL equation is based on the steady-state Smoluchowski equation solver described by Song et al. [16–17]. The original time-dependent Smoluchowski equation has the form of a continuity equation,
| (1) |
where the particle flux j⃗(R⃗; t) is defined as
| (2) |
Here u(R⃗; t) is the distribution function of the ensemble of Brownian particles, D(R⃗) is the diffusion coefficient, β = 1/kB T is the inverse Boltzmann energy, kB is the Boltzmann constant, T is the temperature, and W(R⃗) is the potential of mean force (PMF) for a diffusing particle due to solvent-mediated interactions with the target molecule. For simplicity, D(R⃗) is assumed constant. The two terms contributing to the flux have clear physical meanings. The first is due to free diffusion processes, as quantified by Fick’s first law. The second contribution is due to the drift velocity, ∇W(r)/γ, induced by the systematic forces, ∇W(r) and friction quantified by the friction constant γ. The relation between diffusion coefficient D(R⃗) and friction constant γ is given by Stokes-Einstein equation: Dβγ =1.
The diffusion-determined reaction rate constant during the simulation time can be obtained from the flux j⃗(R⃗; t) by integration over the active site boundary (Γ), i.e.
| (3) |
where ubulk is bulk concentration at the outer boundary; n(R⃗) is the surface normal [6]. The variation of reaction rates with ionic strength is often interpreted via the Debye-Huckel limiting law [18–19].
For molecular simulations, the long-range contributions to the PMF are electrostatic in nature and thus may be estimated by solving the Poisson-Boltzmann equation. Typical approaches consider the positions of atoms from high-resolution X-ray crystal structures available in the Protein Data Bank (http://www.rcsb.org) and their corresponding partial charges, as well as the dielectric constant of the surrounding solvent. For sub-cellular systems, we assume that the electrostatic potential arising from the cell membrane is screened beyond the characteristic Debye length, which is less than 1.0 nm at physiological ionic strengths. As such, the W(R) term defined in (2) may be neglected and one arrives at Fick’s law of diffusion [6].
2.2 Reaction-Diffusion Equations
In this section, we derive a model which describes the diffusive transport of Ca2+ in the presence of stationary and mobile Ca2+ buffers. Assuming mass action kinetics and Fickian diffusion [20], we can write the transport equations,
| (4) |
| (5) |
| (6) |
| (7) |
| (8) |
where [Ca2+]i is intracellular Ca2+ concentration, and are the association and dissociation buffer rate constants, [Bs] is the concentration of stationary buffer, [Bm] is the concentration of mobile buffer, DCa and DCaBm are the diffusion constants for free Ca2+ and Ca2+-bound to mobile buffer, and JCaflux is the total Ca2+ flux via the cell membrane.
2.3 Numerical Algorithms, Software and Meshing Tools
In 3-D finite element methods, the geometry is discretized into polyhedrons, over which the local solution to the partial differential equations may be estimated. This process is usually referred to as mesh generation [21–22]. Although different types of meshes may be generated depending on the numerical solvers to be employed, we restrict ourselves to triangular (surface) and tetrahedral (volumetric) mesh generation as commonly used in biomedical simulation (http://fetk.org/codes/gamer/index.html). Of particular interest are 3-D scalar volumes obtained by imaging techniques such as the 3-D electron tomography (cellular level) and X-ray crystal structures (molecular level).
The time-dependent Smoluchowski equation and nonlinear reaction-diffusion system were solved by a finite difference method in time and finite element method in space using our SMOL software tool. The SMOL program utilizes libraries from the finite element tool kit (FEtK, http://FETK.org), which previously has been used in several molecular level studies [6–8], [23–25]. To extend SMOL to sub-cellular simulations, the reaction terms due to buffering were decoupled from the diffusion and flux boundary conditions defined in (4–8). Simulation results were visualized using OpenDX and GMV mesh viewers, while post-processing and data analyses were implemented by customized Python, MATLAB 2008b (The MathWorks, Natick, MA) scripts and Xmgrace software [26].
3. Results and discussion
3.1 Continuum Diffusion on Molecular Level
This section demonstrates SMOL’s proficiency in the numerical modeling of diffusion-limited binding kinetics of single enzyme molecule (in this particular case, mouse acetylcholinesterase, mAChE) under various ionic strength conditions [6], [19]. Acetylcholinesterase is an enzyme that hydrolyzes ACh during neuron signaling. Under physiological conditions, the experimentally suggested association rate constant (kon) is ~1012 M−1min−1, which is close to the diffusion limit. Therefore, it is not easy to accurately measure kon. By numerically solving the Poisson-Boltzmann and time-dependent Smoluchowski equations, we calculated kon under the influence of a molecular electrostatic field. The tetrahedral mashes in this numerical experiment were obtained from the inflated van der Waals-based accessibility data for the mAChE monomer and tetramers using the level-set boundary interior exterior-mesher, (Fig. 1) [6].
Figure 1.
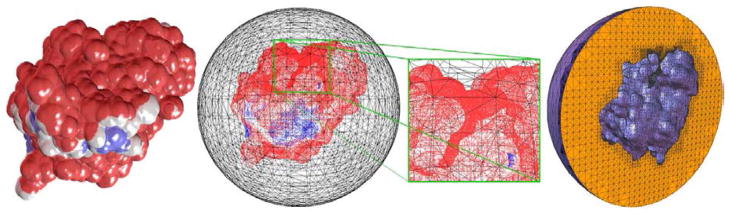
Left to right mAChE monomer; the molecular surface and outer sphere; magnification of the active site gorge; the tetrahedral mesh of the internal volume between the molecular surface and the outer sphere.
The steady-state kon value (t > 10 μs) for a charged ligand in a 0.0 M ionic strength solution was estimated to be 9.56*1011M−1min−1, which is consistent with the experimentally suggested value of 9.8±0.6*1011M−1min−1 [18], and the predicted value from the time-independent solution of the Smoluchowski equation [16]. Our model studies also indicate that mAChE association rate was rapidly attenuated by increasing ionic strength (ranging in this numerical experiment from 0.0 to 0.67 M), which supports the idea of electrostatically-guided molecular diffusion [6]. We concluded that accurate estimation of the electrostatic potential and of the time to reach steady-state are important factors in modeling the activity of enzymes and buffers in cellular volumes.
To further test the SMOL solver, recently we also applied it to study the drug molecular diffusion in wild-type neuraminidase and its mutants [27]. We observed quantitatively consistent trends compared with experimental measurements, although the predictions were an order of magnitude higher than experiment. This indicates that the finite size of the drug molecule, as well the conformational changes of the active site of the target protein, may be significant. These attributes are neglected in the current SMOL tool. To overcome this limitation, we are developing a new multi-scale algorithm to couple the SMOL continuum formulation with particle-based Brownian dynamics. The simulation of explicit particles naturally accommodates finite-size and conformational effects that may influence association rate constants. These studies also establish the foundation for integrating molecular-scale information into cellular-scale systems such as Ca2+ signaling transduction in cardiac myocytes [9–11].
3.2 Continuum Diffusion on Sub-Cellular Level
In cardiac muscle cells, calcium (Ca2+) is best known for its role in contraction activation [28]. A remarkable amount of quantitative data on cardiac cell structure, ion-transporting protein function and distribution, and intracellular Ca2+ dynamics has become available [15], [28–30]. Alterations in myocyte ultra-structure and in protein function and distribution are now recognized to be the primary mechanisms of cardiac dysfunction in a diverse range of common pathologies including cardiac arrhythmias and hypertrophy [28].
3.2.1 Cardiomyocyte ionic model with realistic t-tubule geometry
In this paper, we used our published computational model with realistic transverse-axial t-tubule geometry and experimentally suggested ion-transporting protein distributions, to analyze several important spatial and temporal features of Ca2+ signaling, buffering and diffusion in rat ventricular myocytes [11]. We considered a small compartment containing a single t-tubule and its surrounding half-sarcomeres (Fig. 2 middle panel). The t-tubule diameter varied from 0.19 μm to 0.469 μm and the t-tubule depth was 5.645 μm. The surrounding half-sarcomeres were modeled as a rectangular-shaped box of 2 μm ×2 μm in the plane of external sarcolemma and 5.96 μm in depth. Because the original t-tubule model did not include the realistic cell surface, one of the box faces (top red surface in Fig. 2) was assumed to be the external cell membrane [11]. To generate the high-fidelity and quality tetrahedral meshes for 3-D t-tubular system we used GAMer [22].
Figure 2.

Left panel Troponin C monomer. Middle panel: Geometric model of single t-tubule and surrounding half-sarcomeres extracted from 2-photon microscopy images in mice [15]. Right panel: Schematic drawing of Ca2+ entrance and extrusion via the cell membrane and Ca2+ buffering and diffusion inside the cell. L-type Ca2+ channel (LCC), Na+/Ca2+ exchanger (NCX), membrane Ca2+ leak (Leak), ryanodine receptor (RyR), sarcoplasmic reticulum (SR), SR Ca2+ pump (SERCA), troponin C (TnC), adenosine triphosphate (ATP), fluorescent indicator (Fluo-3). Bottom: Scale bar showing the relative lengths of TnC macro-molecule, t-tubule and myocyte.
The overall scheme of the ionic model is shown in Fig. 2 (right panel). In the present study we examined Ca2+ diffusion in rat cells that were treated with ryanodine and thapsigargin to eliminate the release and uptake of Ca2+ by the sarcoplasmic reticulum (e.g. Ca2+ fluxes via the ryanodine receptors and the SR Ca2+ pumps blocked), [11]. At rest, Ca2+ influx via Ca2+ leak was adjusted to match Ca2+ efflux via NCX thus no net movement across the cell membrane would occur. The depolarization of the sarcolemma activates L-type Ca2+ channels. The subsequent influx of Ca2+ increases the intracellular Ca2+ concentration ([Ca2+]i). Free Ca2+ diffuse and react throughout the cytoplasm. The equations describing Ca2+ fluxes via the t-tubule and surface membrane (JCaflux = JCa + J NCX + JM–leak, JCa - LCC Ca2+ influx-; J NCX - NCX Ca2+ flux; JM–leak - membrane Ca2+ leak) were the same as in Cheng et al. (see also APPENDIX). The generalized SMOL package was used to solve the nonlinear reaction-diffusion system defined in (4–8) [11]. Unless specified otherwise in the Figures’ legends or in the text, all initial conditions and values of the parameters that are not included in the present paper correspond to those used in Cheng et al. [11].
In agreement with experiment [31], the model predicts that spatially uniform Ca2+ transients can be achieved with 100 μM Fluo-3 when total Ca2+ flux (JCaflux) was heterogeneously distributed along the sarcolemma (Fig. 3). Figure 3 also shows that strongly non-uniform Ca2+ signals are predicted in the absence of fluorescent indicator. The surface plots in Fig. 3 were computed from Cheng et al. line-scan images (Fig. 4F and Fig. 6F in Cheng et al., [11]). To delineate further the suggested spatial differences in [Ca2+]i (see Fig 3A–B), we introduced a quantity called ‘spatial Ca2+ heterogeneity’ (SCH). The SCH is defined to be the difference of the maximal and minimal [Ca2+]i values, normalized by the maximal value at given reference point along the scanning line in given moment tj of interest. High SCH suggests non-uniform [Ca2+]i distribution and SCH of zero indicates spatially uniform [Ca2+]i distribution. The histogram in Fig. 3C shows that in the absence of dye SCH(10ms) increased by 1.64 folds, SCH(70ms) by 2.63 folds, SCH(76ms) by 2.68 folds, SCH(100ms) by 4.46 folds, and SCH(200ms) by 28.65 folds.
Figure 3.

Ca2+ signals in the presence (panel A) and absence of dye (panel B). Estimated SCH with 100 μM Fluo-3 and zero Fluo-3 (panel C). In panels A–B the line-scan was positioned at 200nm from the surface of the t-tubule. Featured spots along the scanning line: 17 μm, 3.09 μm, 5.45 μm. Moments tj of interest: 10ms - L-type Ca2+ current peak (tICa–peak); 70 ms - duration of L-type Ca2+ current (tICa–max); 76 ms - [Ca2+]i peak (t[Ca2+]i–peak); 100ms and 200ms – relaxation times for [Ca2+]i (t100ms, t200ms).
Figure 4.

Figure 4A–C. Estimated spatial Ca2+ heterogeneity index with respect to ±25% and ±50% changes in control Ca2+ on-rate for TnC ( , assuming basic value of 0.04/ms unchanged) in the absence of dye. In panels A–C Ca2+ flux was heterogeneously distributed, line-scan positioned at 200nm away from the t-tubule membrane, and the featured spots along the scan line were chosen to be the same as in Fig. 3.
In this particular model, the effects of exogenous and endogenous Ca2+ buffers (Fluo-3, ATP, troponin C) were considered. The buffer Ca2+ dissociation constants ( ) and on-rate constants ( ) used here are average values measured in different cardiac species under physiological conditions [9–11]. Theoretical estimates of or rates in the literature, however, are lacking. Moreover, the Ca2+-binding buffer constants for several other important buffers regulating cardiac cell cycle (including calmodulin, myosin, TnC high-affinity sites, ADP) are controversial or unknown [12], [28]. Thus, in the event that the association rate (kon) is unknown, we assume a typical near-diffusion-limited on-rate value of 0.125 μM−1ms−1 [12]. Hence, the computational estimation of these kinetic parameters presents an exciting opportunity to leverage our advanced molecular-level tools.
Two classes of Ca2+ binding sites have been identified on cardiac TnC subunit (Fig. 2 left panel); one low-affinity Ca2+-specific site on the amino end of TnC (N-domain) and two high-affinity Ca2+/Mg2+ binding sites on the carboxy end of TnC (C-domain) [28, 32]. The high affinity Ca2+/Mg2+ sites are saturated at resting [Ca2+]i (~100 nM). Therefore, in our model only the low-affinity Ca2+-specific site was included since large and rapid changes in the Ca2+ occupancy of these sites can occur during the Ca2+ transient [32]. We assume also that TnC is immobile because it is attached to the thin filament [28]. Little is known, however, how alterations in TnC on- and off-rates in the whole Tn compex (TnC, TnI, TnT) modulate the spatial and temporal features of the Ca2+ signaling, buffering and diffusion in rats. Therefore our goal here was to examine these effects from a modeling perspective. In this study we used published experimental measurements for and because currently at the molecular scale we do not have yet theoretical estimates as for mAChE monomer on-rate [6].
3.2.1.1 Effects of changes in Ca2+ on-rate to TnC in whole Tn complex on local Ca2+ signals
Recently, a study has clarified the role of a specific, disease-associated mutation of the TnC regulatory domain in altered Ca2+ binding, signal transmission and myocyte contractile dysfunction in rats [33]. Lim and collaborators, by combining targeted expression/integration of recombinant mutant TnC in cardiomyocytes and in vitro functional analysis, found a decrease in myofilament Ca2+-sensitivity and Ca2+ binding affinity. It is difficult, however, to derive an understanding from Lim’s et al. studies how changes in the Ca2+ on-rate for TnC ( ) modulate spatial Ca2+ distribution in rats. Our studies imply here that in the absence of dye with 70μM TnC (see Fig. 4A), inflated values tend to decrease SCH within the initial 10 ms of simulation, during which the calcium concentration ([Ca2+]i) is low. SCH however increases at the total [Ca2+]i beyond 10 ms.
Measurements have demonstrated also that the total TnC concentration ([TnC]tot) can range from 30 μM to 150 μM [28, 32]. With this in mind, we computed SCH decreasing or increasing [TnC]tot. Figures 4A–C show that at tICa –peak (10ms) 35 μM [TnC]tot enhanced SCH while 140 μM [TnC]tot tend to decrease SCH as predicted with 70 μM[TnC]tot. Interestingly, with ranging from 0.02 to 0.06 μM−1ms−1: (1) beyond 10 ms [Ca2+]i was more uniformly distributed with 35 μM [TnC]tot than was predicted for 70 μM[TnC]tot; (2) 140 μM[TnC]tot also decreased SCH(70 μM [TnC]tot) at tICa – max, t[Ca2+ ]i –peak and t100ms while at 200ms SCH remined almost unchanged. Additional model findings are that with 35 μM [TnC]tot SCH increased at the total [Ca2+]i beyond 10 ms (Fig. 4B) while the changes in slightly affected the predicted SCH (70ms, 76 ms, 100ms, 200ms) when control [TnC]tot increased two-fold (Fig. 4C). Taken together, our numerical work and analyses suggest that the disease-linked changes in (respectively in ) and the alterations in [TnC]tot level at low free [Ca2+]i (SR activity disabled) alter the effective diffusion coefficient for free ( ) [8, 9]. The changes in will affect local flow rates of membrane Ca2+ transporters and local Ca2+ trigger fluxes (d[Ca2+]i/dt) controlling SR Ca2+-release, and ultimately the normal myocyte function [33].
3.2.1.2 Effects of changes in Ca2+ off-rate to TnC in whole Tn complex on local Ca2+ signals
Kreutziger and colleagues introduced site-directed mutations in the N-terminus of rat TnC (L48Q TnC, I61Q TnC) that altered the control Ca2+ off-rate value [34]. Using stopped-flow spectroscopy they measured Ca2+ dissociation rates from whole troponin complex containing recombinant WT TnI and WT TnT and either WT TnC, L48Q TnC, or I61Q TnC (in the paper Ca2+ off-rates are denoted as or , respectively). These experiments demonstrated that the mutations in TnC altered the basic value, reducing it by 75% for L48Q TnC and increasing it by 3.2-fold for I61Q TnC. It is difficult, however, to derive an understanding from these studies how these site-directed mutations in TnC (e.g. altered and ) modulate the cytosolic Ca2+ dynamics that ultimately will affect the normal cell function. Here, we used our 3-D reaction-diffusion model to investigate this. Figure 5A shows that with 70 μM [TnC]tot: (1) the both alterations in enhanced SCH at tICa – peak (10ms); (2) at tICa –max (70ms), t[Ca2+]i–peak (76ms) and t200ms inflated decreased SCH while no visible differences in SCH were found when the control was reduced by 75% (L48Q Tn mutation); (3) at 100 ms the both alterations in decreased SCH.
Figure 5.

Figure 5A–C. Estimated spatial Ca2+ heterogeneity index with respect to 75% decrease and 2.3-fold increase in WT Tn off-rate ( , assuming basic value of 0.04 μM−1ms−1 unchanged) in the absence of dye. L48Q Tn mutation - . I61Q Tn mutation - . In these sets of simulations the line-scan was positioned at 200nm away from the surface of the t-tubule, Ca2+ flux was heterogeneously distributed and the reference points were chosen to be the same as in Fig. 3.
The model also predicts that at tICa–peak the decrease in control TnC buffer capacity to 35 μM increased SCH while 140 μM [TnC]tot decreased SCH for all TnC variants (Fig. 5A–C). In addition, Fig. 5B demonstrates that with 35 μM [TnC]tot SCH decreased at the total [Ca2+]i beyond 10 ms. The predicted changes in SCH beyond 10 ms with 140 μM[TnC]tot are shown in Figure 5C. This set of simulations demonstrates that: (1) at 70ms and 76ms inflated increased SCH while [Ca2+]i was more uniformly distributed when decreased (L48Q Tn mutation); (2) at 100 ms no visible differences in SCH were found when was increased 2.3-fold (I61Q Tn mutation) while 75% drop in the basic (L48Q Tn mutation) decreased SCH notably; (3) at 200 ms the both alterations in tended to decrease the SCH. In summary, our results demonstrate that the mutation-linked changes in (in respectively) and the variations in [TnC]tot levels alter control , thereby altering the local sarcolemmal fluxes, SR Ca2+ trigger fluxes and local [Ca2+]i inside the cell with SR disabled. The model demonstrates also that the alterations in may affect quite differently local Ca2+ distributions ([Ca2+]i and d[Ca2+]i/dt) with respect to those when control is varied (compare Fig. 4 and Fig. 5).
In Kreutziger’s et al. experiment, was determined for each by fitting fluorescence data (at 15°C) with exponential curves [34]. We then calculated SCH replacing the model values (0.01/ms L48Q Tn, 0.04/ms WT Tn, 0.092/ms I61Q Tn) with the experimentally measured values. Yet only minor effects in predicted SCH were found with 70 μM[TnC]tot (compare Fig. 5A and Fig. 6A).
Figure 6.
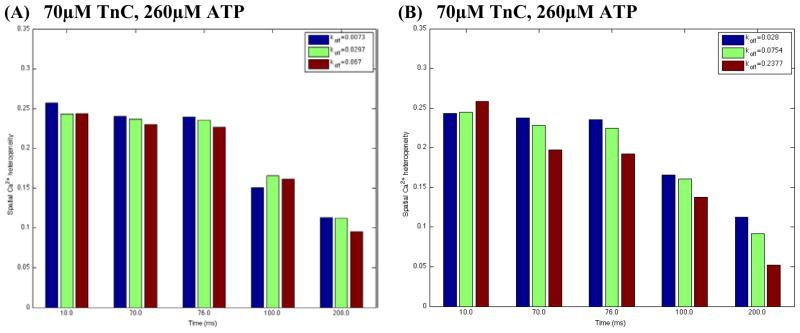
Estimated spatial Ca2+ heterogeneity index for all TnC variants in whole Tn complex (panel A) and reconstructed thin filaments (panel B) in the absence of dye. Panel A: . Panel B: . In this set of simulations: value was 0.04 μM−1ms−1; Ca2+ flux was heterogeneously distributed; the line-scan positioned at 200nm from the surface of the t-tubule; reference points along the scaned line were chosen to be the same as in Fig. 3.
3.2.1.3 Effects of changes in Ca2+ off-rate to TnC in reconstructed thin filaments on local Ca2+ signals
Recently, Kreutziger’s et al. measured also the off-rates in reconstructed thin filaments with WT or mutant whole TnC, WT Tm, and WT actin (in the paper these Ca2+ off-rates are denoted as , or , respectively), [34]. They found 2.2–3.4-fold increase in off-rates for all TnC variants vs. isolated whole Tn-complex. The relative effect of the mutations in TnC remained almost the same as for whole Tn, such that was reduced by 63% for L48Q (vs. 75% in isolated Tn-complex) and increased by 3.2-fold for I61Q Tn in the thin filaments. It remains unclear, however, whether the changes in off-rates in reconstructed thin filaments would have a different effect on Ca2+ dynamics relative to those predicted with the isolated whole Tn-complex. Our numerical results demonstrate that with 70 μM[TnC]tot visible differences in the calculated SCH-s compared to those in isolated whole Tn-complex were found. At ICa peak (10 ms) ~2.5-fold increase in WT variant had little or no effect on SCH, ~3.85 fold increase in L48Q variant decreased SCH while ~3.55 fold increase in I61Q variant increased SCH (Fig. 6A vs. Fig. 6B).
Figures 5–6 also show that at the moment of ICa closing (70ms) and at [Ca2+]i peak (76ms) SCH decreased for WT and I61Q variants vs. the whole Tn-complex. Model also predicts that: (1) at and ; (2) at and . These findings suggest that the use of whole Tn off-rates vs. reconstructed thin filaments off-rates into cardiac cellular and sub-cellular models may alter the predicted control and disease-linked Ca2+ transporter rates, Ca2+ trigger fluxes for SR release and local Ca2+ signals.
In summary, our studies provide a foundation for a more comprehensive understanding of signaling transduction at molecular and sub-cellular scales. Our studies also illustrate the importance of improved experimental measurements of Ca2+ buffering kinetics and of complementary theoretical estimates of Ca2+ buffer reaction rates. Together, this will lead to a better understanding of Ca2+ signaling in heart under normal or pathological conditions.
4. Conclusions
In this paper, we applied the SMOL package to molecular-level reaction kinetics of ACh and cellular-level Ca2+ dynamics. Our data demonstrate that a continuum-based description of ion diffusion, the Smoluchowski equation, captures molecular-level details impacting reaction rates. This suggests that alternative descriptions of electrodynamics, such as the Poisson-Nernst-Planck equation, could further improve our estimates. These data also demonstrate progress toward sub-cellular modeling of heart, in which buffering dynamics are handled at a molecular level. Future applications of SMOL will feature spatially coupled 3-D structural and functional models of ventricular cardiac myocytes with (1) realistic sub-cellular anatomical structures, such as Ca2+-signaling micro-domains and cell organelles; (2) sarcoplasmic reticulum fluxes via ryanodine receptors (RyR) and the SERCA pump; and (3) spatial and temporal scales spanning from single channel ion fluxes to tension development in actin and myosin filaments. These developments would facilitate modeling excitation-contraction coupling influenced by mutations, phosphorylation, and alterations in protein expression. Other molecular-level approaches that could further benefit excitation-contraction modeling include analysis of nucleotide-activated conformational dynamics [35], kinase activity [36], channel gating [37] and structure-based drug design [38]. In concert, these approaches constitute a prototypical workflow for patient-specific modeling and therapies.
Acknowledgments
This work was supported by the National Biomedical Computational Resource (NIH grant 5P41 RR08605 – 17). Dr. McCammon acknowledges additional support from NIH, NSF, Howard Hughes Medical Institute (HHMI), and the Center for Theoretical Biological Physics (CTBP).
APPENDIX
Equations describing total Ca2+ flux (JCaflux), L-type Ca2+ current (JCa), Na+/Ca2+ exchanger flux (J NCX), and Ca2+ leak current (JM–leak) throughout the t-tubule and external membrane:
| (9) |
| (10) |
| (11) |
| (12) |
| (13) |
Flux parameter values were estimated or taken from the literature (see Table 1). In this study, the Ca2+ leak is not actually a particular “leak protein”. The Ca2+ leak was included and adjusted so that at rest Ca2+ influx via Ca2+ leak to match Ca2+ efflux via NCX thus no net movement across the cell membrane to occur.
Table 1.
Membrane calcium fluxes parameters
| Symbol | Definition | Value | Ref. |
|---|---|---|---|
| L-type Ca2+ current | |||
| ICao | Constant | 1 | [9] |
| ta | Constant | 4 ms | [40] |
| tb | Constant | 70 ms | [40] |
| Na+/Ca2+ exchange current | |||
| [Na+]e | Extracellular Na+ concentration | 140 mM | [28] |
| [Na+]i | Resting Na+ concentration | 10 mM | [28] |
| gNCX | Pump rate of NCX | 38.5 μM ms−1 | [41] |
| η | Voltage dependence of NCX control | 0.35 | [41] |
| km,Na | Na+ half saturation of NCX | 87.5 mM | [41] |
| km,Ca | Ca2+ half saturation of NCX | 1380 μM | [41] |
| ksat | Low potential saturation factor of NCX | 0.1 | [41] |
| Membrane Ca2+leak | |||
| gM_ leak | Conductance | 3.4e-6 μM mV−1ms−1 | Estimated |
In the model, each current density (Ii) was converted to Ca2+ flux (Ji) by using the experimentally suggested surface to volume ratio ( ) in adult rat ventricular myocytes [39]:
| (14) |
The voltage-clamp protocol (holding potential –50mV, electric pulse of 10mV for 70ms) and whole-cell L-type Ca2+ current were derived from Zahradnikova et al. data with the blocked SR activity [40].
References
- 1.Ermak DL, McCammon JA. Brownian dynamics with hydrodynamic interactions. J Chem Phys. 1978;69:1352–60. [Google Scholar]
- 2.Smart JL, McCammon JA. Analysis of synaptic transmission in the neuromuscular junction using a continuum finite element model. Biophys J. 1998;75:1679–88. doi: 10.1016/S0006-3495(98)77610-6. [DOI] [PMC free article] [PubMed] [Google Scholar]
- 3.Berry H. Monte-Carlo simulations of enzyme reactions in two dimensions: fractal kinetics and spatial segregation. Biophys J. 2002;83:1891–1901. doi: 10.1016/S0006-3495(02)73953-2. [DOI] [PMC free article] [PubMed] [Google Scholar]
- 4.McCammon JA. Computer-aided molecular design. Science. 1987;238:486–91. doi: 10.1126/science.3310236. [DOI] [PubMed] [Google Scholar]
- 5.Eastman P, Doniach S. Multiple time step diffusive langevin dynamics for proteins. Proteins. 1998;30:215–27. [PubMed] [Google Scholar]
- 6.Cheng Y, Suen JK, Zhang D, Bond SD, Zhang Y, Song Y, Baker NA, Bajaj C, Holst MJ, McCammon JA. Finite Element Analysis of the Time-Dependent Smoluchowski Equation for Acetylcholinesterase Reaction Rate Calculations. Biophys J. 2007;92:3397–3406. doi: 10.1529/biophysj.106.102533. [DOI] [PMC free article] [PubMed] [Google Scholar]
- 7.Cheng Y, Suen JK, Radić Z, Bond SD, Holst MJ, McCammon JA. Continuum Simulations of Acetylcholine Diffusion with Reaction-determined Boundaries in Neuromuscular Junction Models. Biophys Chem. 2007;127:129–39. doi: 10.1016/j.bpc.2007.01.003. [DOI] [PMC free article] [PubMed] [Google Scholar]
- 8.Cheng Y, Chang C, Yu Z, Zhang Y, Sun M, Leyh TS, Holst MJ, McCammon JA. Diffusional Channeling in the Sulfate Activating Complex: Combined Continuum Modeling and Coarse-grained Brownian Dynamics Studies. Biophys J. 2008;95:4659–67. doi: 10.1529/biophysj.108.140038. [DOI] [PMC free article] [PubMed] [Google Scholar]
- 9.Michailova A, DelPrincipe F, Egger M, Niggli E. Spatiotemporal features of Ca2+ signaling, buffering and diffusion in atrial myocytes with inhibited sarcoplasmic reticulum. Biophys J. 2002;83:3134–51. doi: 10.1016/S0006-3495(02)75317-4. [DOI] [PMC free article] [PubMed] [Google Scholar]
- 10.Lu S, Michailova A, Saucerman JJ, Cheng Y, Yu Z, Kaiser T, Li W, Banks RE, Holst MJ, McCammon JA, Hayashi T, Hoshijima M, Arzberger P, McCulloch AD. Multi-Scale Modeling in Rodent Ventricular Myocytes: Contributions of structural and functional heterogeneities to excitation-contraction coupling. IEEE EMB. 2009;28:46–57. doi: 10.1109/MEMB.2009.931787. [DOI] [PMC free article] [PubMed] [Google Scholar]
- 11.Cheng Y, Yu Z, Hoshijima M, Holst MJ, McCulloch AD, McCammon JA, Michailova A. Numerical analysis of Ca2+ signaling in rat ventricular myocytes with realistic transverse-axial tubular geometry and inhibited sarcoplasmic reticulum. PloS Comp Biol. 2010;6:e1000972. doi: 10.1371/journal.pcbi.1000972. [DOI] [PMC free article] [PubMed] [Google Scholar]
- 12.Michailova A, McCulloch AD. Model Study of ATP and ADP Buffering, Transport of Ca2+ and Mg2+, and Regulation of Ion Pumps in Ventricular Myocyte. Biophys J. 2001;81:614–29. doi: 10.1016/S0006-3495(01)75727-X. [DOI] [PMC free article] [PubMed] [Google Scholar]
- 13.Michailova A, Saucerman J, Belik ME, McCulloch AD. Modeling regulation of cardiac KATP and L-type Ca2+ currents by ATP, ADP and Mg2+ Biophys J. 2005;88:2234–49. doi: 10.1529/biophysj.104.046284. [DOI] [PMC free article] [PubMed] [Google Scholar]
- 14.Michailova A, Lorentz W, McCulloch AD. Modeling transmural heterogeneity of KATP current in rabbit ventricular myocytes. AJP Cell Physiol. 2007;293:542–57. doi: 10.1152/ajpcell.00148.2006. [DOI] [PubMed] [Google Scholar]
- 15.Hayashi T, Martone ME, Yu Z, Thor A, Doi M, Holst MJ, Ellisman ME, Hoshijima M. Three-dimensional electron microscopy reveals new details of membrane systems for Ca2+ signaling in the heart. J Cell Science. 2009;122:1005–13. doi: 10.1242/jcs.028175. [DOI] [PMC free article] [PubMed] [Google Scholar]
- 16.Song Y, Zhang Y, Shen T, Bajaj C, McCammon JA, Baker NA. Finite element solution of the steady-state Smoluchowski equation for rate constant calculations. Biophys J. 2004;86:2017–29. doi: 10.1016/S0006-3495(04)74263-0. [DOI] [PMC free article] [PubMed] [Google Scholar]
- 17.Song Y, Zhang Y, Bajaj C, Baker NA. Continuum diffusion reaction rate calculations of wild-type and mutant mouse acetylcholinesterase: adaptive finite element analysis. Biophys J. 2004;87:1558–66. doi: 10.1529/biophysj.104.041517. [DOI] [PMC free article] [PubMed] [Google Scholar]
- 18.Radić Z, Quinn DM, McCammon JA, Taylor P. Electrostatic influence on the kinetics of ligand binding to acetylcholinesterase – distinctions between active center ligands and fasciculin. J Biol Chem. 1997;272:23265–77. doi: 10.1074/jbc.272.37.23265. [DOI] [PubMed] [Google Scholar]
- 19.Quinn DM, Seravalli JHK, Medhekar NR, Husseini B, Radić Z, Vellom DC, Pickering N, Taylor P. Enzymes of the Cholinesterase Family. Plenum Publishing; New York: 1995. The function of electrostatics in acetylcholinesterase catalysis in. [Google Scholar]
- 20.Keizer J. Statistical and Thermodynamics Nonequilibrium Processes. New York: Springer-Verlag; 1987. [Google Scholar]
- 21.Yu Z, Holst MJ, Cheng Y, McCammon JA. Feature-Preserving Adaptive Mesh Generation for Molecular Shape Modeling and Simulation. J Mol Graph Model. 2008;26:1370–80. doi: 10.1016/j.jmgm.2008.01.007. [DOI] [PubMed] [Google Scholar]
- 22.Yu Z, Holst MJ, McCammon JA. High-Fidelity Geometric Modelling for Biomedical Applications. Finite Elements in Analysis and Design. 2008;44:715–23. [Google Scholar]
- 23.Bank R, Holst MJ. A New Paradigm for Parallel Adaptive Meshing Algorithms. SIAM Rev. 2003;45:291–323. [Google Scholar]
- 24.Holst M. Adaptive numerical treatment of elliptic systems on manifold. Adv in Comput Math. 2001;15:139–91. [Google Scholar]
- 25.Zhang D, Suen JK, Zhang Y, Song Y, Radić Z, Taylor P, Holst MJ, Bajaj C, Baker NA, McCammon JA. Tetrameric mouse acetylcholinesterase: continuum diffusion rate calculations by solving the steady-state Smoluchowski equation using finite element methods. Biophys J. 2005;88:1659–65. doi: 10.1529/biophysj.104.053850. [DOI] [PMC free article] [PubMed] [Google Scholar]
- 26.Vaught A. Graphing with Gnuplot and Xmgr. Linux J 1996 [Google Scholar]
- 27.Cheng Y, Holst MJ, McCammon JA. Finite Element Analysis of Drug Electrostatic Diffusion: Inhibition Rate Studies in N1 Neuraminidase. Pacific Symp Biocomp. 2009;14:281–92. doi: 10.1142/9789812836939_0027. [DOI] [PMC free article] [PubMed] [Google Scholar]
- 28.Bers DM. Excitation-contraction coupling and cardiac contractile force. Kluwer Academic Press; Dortrecht, Boston, London: 2001. [Google Scholar]
- 29.Scriven DR, Klimek A, Lee KL, Moore EW. The molecular architecture of calcium microdomains in rat cardiomyocytes. Ann NY Acad Sci. 2002;976:488–99. doi: 10.1111/j.1749-6632.2002.tb04783.x. [DOI] [PubMed] [Google Scholar]
- 30.Thomas MJ, Sjaastad I, Andersen K, Helm PJ, Wasserstrom JA, Sejersted OM, Ottersen OP. Localization and function of the Na+/Ca2+-exchanger in normal and detubulated rat cardiomyocytes. J Mol Cell Cardiol. 2003;35:1325–37. doi: 10.1016/j.yjmcc.2003.08.005. [DOI] [PubMed] [Google Scholar]
- 31.Cheng H, Cannell MB, Lederer WJ. Propagation of excitation-contraction coupling into ventricular myocytes. Pflugers Arch. 1994;428:415–17. doi: 10.1007/BF00724526. [DOI] [PubMed] [Google Scholar]
- 32.Robertson SP, Johnson JD, Potter JD. The time-course of Ca2+ exchange with calmodulin, troponin, parvalbumin, and myosin in response to transient increase in Ca2+ Biophys J. 1981;34:559–569. doi: 10.1016/S0006-3495(81)84868-0. [DOI] [PMC free article] [PubMed] [Google Scholar]
- 33.Lim CC, Yang H, Yang M, Wang CK, Shi J, Berg EA, Pimentel DR, Gwathmey JK, Hajjar RJ, Helmes M, Costello CE, Huo S, Liao R. A novel mutant cardaic troponin C disrupts molecular motions critical for calcium binding affinity and cardiomyocyte contractility. Biophys J. 2008;94:3577–89. doi: 10.1529/biophysj.107.112896. [DOI] [PMC free article] [PubMed] [Google Scholar]
- 34.Kreutziger KL, Piroddi N, McMichael JT, Tesi C, Poggesi C, Regnier M. Calcium binding kinetics of troponin C strongly modulate cooperative activation and tension kinetics in cardiac muscle. J Mol Cell Cardiol. 2011;50:165–74. doi: 10.1016/j.yjmcc.2010.10.025. [DOI] [PMC free article] [PubMed] [Google Scholar]
- 35.Grant BJ, Gorfe AA, McCammon JA. Ras Conformational Switching: Simulating Nucleotide-Dependent Conformational Transitions with Accelerated Molecular Dynamics. PLoS Comput Biol. 2009;5:e1000325. doi: 10.1371/journal.pcbi.1000325. [DOI] [PMC free article] [PubMed] [Google Scholar]
- 36.Khavrutskii JV, Grant B, Taylor SS, McCammon JA. A transition path ensemble study reveals a linchpin role for Mg2+ during rate-limiting ADP release from protein kinase A. Biochemistry. 2009;48:11532–45. doi: 10.1021/bi901475g. [DOI] [PMC free article] [PubMed] [Google Scholar]
- 37.Wang H-L, Toghraee R, Papke D, Cheng X-L, McCammon JA, Ravaioli U, Sine SM. Single-channel current through nicotinic receptor produced by closure of binding site C-loop. Biophys J. 2009;96:3582–90. doi: 10.1016/j.bpj.2009.02.020. [DOI] [PMC free article] [PubMed] [Google Scholar]
- 38.Ivetac A, McCammon JA. Mapping the druggable allosteric space of G-protein coupled receptors: A fragment-based molecular dynamics approach. Chem Biol Drug Des. 2010;76:201–17. doi: 10.1111/j.1747-0285.2010.01012.x. [DOI] [PMC free article] [PubMed] [Google Scholar]
- 39.Satoh H, Delbridge LM, Blatter LA, Bers DM. Surface: volume relationship in cardiac myocytes studied with confocal microscopy and membrane capacitance measurements: species-dependence and developmental effects. Biophys J. 1996;70:1494–1504. doi: 10.1016/S0006-3495(96)79711-4. [DOI] [PMC free article] [PubMed] [Google Scholar]
- 40.Zahradnikova A, Kubalova Z, Pavelková J, Györke S, Zahradník I. Activation of calcium release assessed by calcium release-induced inactivation of calcium current in rat cardiac myocytes. Am J Physiol Cell Physiol. 2004;286:C330–41. doi: 10.1152/ajpcell.00272.2003. [DOI] [PubMed] [Google Scholar]
- 41.Hinch R, Greenstein JL, Tanskanen AJ, Xu L, Winslow RL. A simplified local control model of Calcium induced Calcium release in cardiac ventricular myocytes. Biophys J. 2004;87:3723–3736. doi: 10.1529/biophysj.104.049973. [DOI] [PMC free article] [PubMed] [Google Scholar]