

Abstract
Objective
To determine the relationship of antimüllerian hormone (AMH) levels to polycystic ovaries and ovarian androgenic function.
Design
Prospective case-control study.
Setting
General clinical research center.
Participant(s)
Eumenorrheic asymptomatic volunteers without (V-NO; n = 19; reference population) or with (V-PCO; n = 28) a polycystic ovary and hyperandrogenemic anovulatory subjects grouped according to ovarian function into typical PCOS (PCOS-T; n = 37) and atypical PCOS (PCOS-A; n = 18).
Intervention(s)
Pelvic ultrasonography, short dexamethasone androgen-suppression test (SDAST), and GnRH agonist (GnRHag) test.
Main Outcome Measure(s)
Baseline AMH levels were related to polycystic ovary status, testosterone response to SDAST, and 17-hydroxyprogesterone response to GnRHag test.
Result(s)
AMH levels correlated with SDAST and GnRHag test outcomes. AMH was elevated (>6.2 ng/mL) in 32% of V-PCO versus 5% V-NO. The 21% of V-PCO who met Rotterdam PCOS criteria all had functional ovarian hyperandrogenism, but AMH levels were similar to nonhyperandrogenic V-PCO. AMH >10.7 ng/mL discriminated V-PCO from PCOS with 96% specificity and 41% sensitivity for PCOS-T, and insignificantly for PCOS-A.
Conclusion(s)
AMH levels are independently related to ovarian androgenic function and polycystic ovaries. Very high AMH levels are specific but insensitive for PCOS. In the absence of hyperandrogenism, moderate AMH elevation in women with normal-variant polycystic ovaries seems to indicate an enlarged oocyte pool.
Keywords: Antimüllerian hormone, dexamethasone suppression test, functional ovarian hyperandrogenism, GnRH agonist test, obesity, ovarian reserve, polycystic ovary
Considerable evidence supports the concept that PCOS is a functional disorder in which anovulation is a consequence of ovarian androgen overproduction (1). This view is consonant with the most widely accepted criteria for the diagnosis of PCOS (“National Institutes of Health [NIH] criteria”) (2), which require evidence of anovulation and androgen excess. A polycystic ovary, as defined by criteria that have evolved over recent decades (3, 4), is found in the majority of PCOS patients (5, 6) and is included as a substitute for either of the NIH criteria in the broader alternative “Rotterdam criteria” for diagnosis of PCOS (7). The Androgen Excess and PCOS Society has endorsed the Rotterdam criterion of a polycystic ovary being an alternative to oligoanovulation as diagnostic evidence for PCOS in hyperandrogenic women (8).
Specific tests of ovarian steroidogenic function are critical for understanding the pathophysiology of PCOS. The GnRH agonist (GnRHag) test evaluates the gonadal response to endogenous gonadotropin release. In most PCOS patients, it shows a characteristic pattern of ovarian steroidogenic hyperresponsiveness in which 17-hydroxyprogesterone (17-OHP) responses are increased compared with normal women without PCOS (1, 9). The dexamethasone androgen-suppression test (DAST) is an alternate test used to identify ovarian androgen overproduction and is predicated on the principle that residual concentrations of androgens after suppression of adrenal function by glucocorticoid administration ordinarily arise from the ovary. It shows elevated testosterone after dexamethasone in most PCOS patients (1, 10). Both tests are consistent with an intrinsic abnormality of theca cell function in women with PCOS (11).
Using these two tests of ovarian function, it has been determined that there are two general types of ovarian hyperandrogenic dysfunction in PCOS (9, 10, 12): functionally typical PCOS (PCOS-T), in which there is 17-OHP hyperresponsiveness to GnRHag testing, and functionally atypical PCOS (PCOS-A), in which 17-OHP hyperresponses are lacking. Approximately two-thirds of patients meeting NIH diagnostic criteria for PCOS have PCOS-T, the great majority of whom also have elevated plasma testosterone in response to DAST. The remaining one-third of PCOS subjects have PCOS-A. Most of this latter group have mild ovarian hyperandrogenism that is demonstrable by an abnormal short DAST (SDAST). Both ovarian function tests are normal in a minority of the PCOS-A group; the androgen excess of these patients appears to be secondary to functional adrenal hyperandrogenism or to obesity (10).
The ovarian hyperandrogenism of PCOS-T occupies one end of a spectrum of ovarian androgenic dysfunction that includes many apparently normal women with a polycystic ovary (6, 12-15) (Fig. 1). Asymptomatic eumenorrheic women who bear a polycystic ovary are a heterogeneous population regarding ovarian androgenic dysfunction (12). Although one-half have normal ovarian function tests, the rest either have PCOS according to Rotterdam criteria because of hyperandrogenemia or instead have the PCOS type of 17-OHP hyperresponsiveness to GnRHag testing without hyperandrogenemia.
Figure 1.
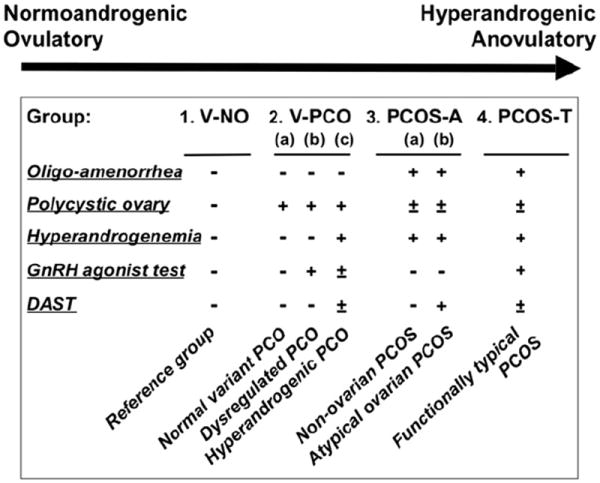
The spectrum between normal and polycystic ovary syndrome (PCOS). The position of study groups and subgroups along the spectrum is indicated schematically in relation to evidence of ovarian dysfunction. Outcome designations of group or subgroup: + = abnormality; − = normal; ± = normal or abnormal. Study groups and subgroups as defined in the text: V-NO = volunteers without a PCO; V-PCO = volunteers with a PCO; PCOS-A = functionally atypical PCOS; PCOS-T = functionally typical PCOS.
Antimüllerian hormone (AMH) is a product of the granulosa cells of growing follicles (16-22) and may regulate their growth and development by exerting a paracrine negative feedback effect on the recruitment of precursor (primordial) follicles (17, 23). AMH also inhibits the sensitivity of follicles to FSH (23, 24). AMH levels are increased in PCOS in proportion to its clinical severity, as reflected by their number of diagnostic features (25) and the antral follicle count (18, 26). Substantial evidence suggests that this increased AMH results from the stimulatory effect of androgens on early follicular growth (24). Furthermore, blood AMH levels were shown by cluster analysis to be associated with androgen levels and so have been proposed as a diagnostic marker for ovarian hyperandrogenism (27). AMH levels are also increased in ovulatory women with a polycystic ovary (15). There is debate as to whether this increase indicates ovarian hyperandrogenism or rather indicates an enlarged oocyte pool (increased “ovarian reserve”). Thus, the role of AMH in the pathogenesis of PCOS and the applicability of proposed AMH cutoff levels for the diagnosis of PCOS are uncertain (28).
The present study focused on determining if ovarian function tests would clarify the relationship of AMH to theca cell and granulosa cell dysfunction in PCOS. We tested the hypothesis that AMH levels are a predictive marker of ovarian hyperandrogenism by examining the relationship of serum AMH levels to polycystic ovaries and to specific tests for ovarian hyperandrogenism in both normal and hyperandrogenic female groups across the PCOS spectrum.
MATERIALS AND METHODS
Study Subjects
Age-matched volunteer and PCOS cohorts were studied from 2000 to 2007. The relationships among ovarian ultrasound, GnRHag test, and SDAST outcomes in these groups were previously reported, with the exception of SDAST data in volunteers with a polycystic ovary and abnormal ovarian function tests (10, 12). Sera from 90% of these subjects were available for assay of AMH levels, the focus of the present report. Thirty-seven percent of the subjects were adolescents, who were ≥1.0 year postmenarcheal and <18.0 years old; there were no significant age-related differences in ovarian function or morphology within any group (12).
The subjects were classified into four groups (Fig. 1; Table 1). As previously reported (12), volunteers were recruited by advertisement and classified post hoc into two groups on the basis of the presence or absence of a polycystic ovary. Group 1 consisted of those asymptomatic nonhirsute eumenorrheic volunteers who lacked a polycystic ovary (V-NO; n = 19) (10, 12); the reference range for AMH was developed from this group. Group 2 was comprised of asymptomatic nonhirsute eumenorrheic volunteers who were distinguished from group 1 only by the presence of a polycystic ovary (V-PCO; n = 28) (12).
TABLE 1.
Antimüllerian hormone (AMH) in relationship to baseline and distinguishing characteristics of study groups, mean ± SD or percent.
| Groupa | Age (y) | BMI (kg/m2) | Polycystic ovary (%) | 8 a.m. free T (pg/mL)b | Post-GnRHag peak 17-OHP (ng/dL)b | Post-SDAST T (ng/dL) | Max. ovary vol. (mL) | AMH (ng/mL)b |
|---|---|---|---|---|---|---|---|---|
| 1. V-NO (n = 19) | 24.5 ± 9.0 | 26.2 ± 6.2 | 0 | 5.3 ± 1.7 | 71 ± 29 | 14.3 ± 6.9 | 7.4 ± 2.3 | 2.7 ± 2.0 |
| 2. V-PCO (n = 28) | 23.7 ± 8.3 | 25.6 ± 5.1†††,‡‡ | 100a,‡ | 7.2 ± 3.0*,†††,‡‡ | 125 ± 54***,††† | 20.1 ± 7.9†††,‡‡ | 13.8 ± 8.8** | 4.8 ± 2.6**,††† |
| 3. PCOS-A (n = 18) | 22.1 ± 7.0 | 44.0 ± 12.1***,† | 67**,†† | 16.6 ± 6.5a,† | 86 ± 26††† | 34.6 ± 14.4***,††† | 10.1 ± 5.0† | 6.1 ± 4.4***,† |
| 4. PCOS-T (n = 37) | 20.6 ± 6.9 | 34.7 ± 8.9** | 95*** | 21.9 ± 9.0a | 295 ± 137a | 52.2 ± 17.6*** | 16.0 ± 8.7*** | 10.4 ± 5.1*** |
Note: BMI = body mass index; GnRHag = GnRH agonist; SDAST = short dexamethasone androgen-suppression test; T = testosterone.
P values: vs. V-NO:
<.05,
<.01,
<.001;
vs. PCOS-T:
<.05,
<.01,
<.001;
vs. PCOS-A:
<.01,
<.001.
Defining characteristic of group.
Conversion multipliers to SI units: free testosterone: 3.47 (pmol/L); 17-OHP: 0.0303 (nmol/L); testosterone: 0.0347 (nmol/L); AMH: 7.125 (pmol/L).
PCOS was diagnosed by NIH criteria, and all had elevated preadmission plasma free testosterone. PCOS study participants were classified post hoc into two groups on the basis of the presence or absence of an elevated 17-OHP response to GnRHag testing. Group 3 were PCOS patients with normal 17-OHP responses to a GnRHag test (PCOS-A; n = 18) (10). Group 4 comprised PCOS patients with elevated peak 17-OHP responses to a GnRHag test (PCOS-T; n = 37) (10).
Volunteers were studied in the early follicular phase of their menstrual cycles and PCOS patients when amenorrheic and off hormonal treatments for >2 months. Subjects found to be in the preovulatory or luteal phase of a menstrual cycle were excluded. Written informed consent was obtained in all adult subjects and parents of adolescents; assent was obtained in minors.
A secondary analysis was performed on the previously delineated functional subgroups of V-PCO (12) and PCOS-A (10). The characteristics of these subgroups are summarized in Figure 1 and Table 2. The V-PCO group consisted of three subgroups of asymptomatic volunteers with a polycytic ovary: a functionally normal-variant subgroup, with normal baseline free testosterone and ovarian function test results (subgroup 2a; n = 14); a subgroup with normal baseline free testosterone, but elevated 17-OHP in response to GnRHag testing (subgroup 2b; n = 8; a “dysregulated” polycystic ovary); and a subgroup with elevated baseline free testosterone that thus fulfilled Rotterdam criteria for PCOS (subgroup 2c; n = 6). The PCOS-A group, which by definition had normal GnRHag test results, was divided into two subgroups: those also lacking evidence of ovarian hyperandrogenism according to SDAST (subgroup 3a; n = 7), and those with atypical functional ovarian hyperandrogenism indicated by an elevated post-SDAST testosterone level (subgroup 3b; n = 11).
TABLE 2.
V-PCO and PCOS-A subgroup characteristics, mean ± SD or %.
| Subgroup | Age (y) | BMI (kg/m2) | Polycystic ovary (%) | 8 a.m. free T (pg/mL) | Post-GnRHag peak 17-OHP (ng/dL) | Post-SDAST T (ng/dL) | Max. ovary vol. (mL) | AMH (ng/mL) |
|---|---|---|---|---|---|---|---|---|
| Subgroups of asymptomatic volunteers with a polycystic ovary (Group 2, V-PCO) | ||||||||
| a. Normoandrogenemic, normal ovarian function tests (n = 14) | 25.2 ± 7.6 | 26.0 ± 5.5 | 100a | 5.9 ± 1.7 | 88 ± 27 | 17.9 ± 5.7 | 13.9 ± 8.8 | 3.9 ± 2.6 |
| b. Normoandrogenemic, abnormal GnRHag test (n = 8) | 18.4 ± 7.7 | 20.8 ± 9.1 | 100a | 5.3 ± 2.4 | 138 ± 72b | 13.3 ± 7.3 | 14.0 ± 2.9 | 4.9 ± 3.1 |
| c. Hyperandrogenemic (n = 6) | 27.6 ± 8.4 | 26.9 ± 9.1 | 100a | 12.0 ± 1.9b | 137 ± 52c | 30.5 ± 6.8 | 13.2 ± 6.0 | 5.5 ± 0.9 |
| Subgroups of functionally atypical PCOS (Group 3, PCOS-A) | ||||||||
| a. Normal ovarian function tests (n = 7) | 23.7 ± 5.5 | 36.6 ± 3.6 | 86 | 10.1 ± 1.8a | 82 ± 21 | 22.0 ± 3.3 | 9.9 ± 4.9 | 6.7 ± 6.1 |
| b. Ovarian hyperandrogenism by SDAST (n = 11) | 19.3 ± 6.1 | 48.8 ± 8.7 | 55 | 20.6 ± 4.7a,d | 86 ± 26 | 42.6 ± 12.7b,d | 10.2 ± 5.3 | 5.7 ± 3.1 |
Note: Abbreviations as in Table 1.
Defining characteristic of group.
Defining characteristic of subgroup.
P<.05 vs. V-PCO subgroup a.
P<.0001 vs. PCOS-A subgroup a.
Study Protocol
Study subjects were phenotyped according to a previously reported protocol approved by the University of Chicago Institutional Review Board, during which the normal upper limits of baseline free testosterone (9 pg/mL) (12), 17-OHP in response to GnRHag (132 ng/dL) (10), and total testosterone in response to SDAST (27 ng/dL) (10) were established in the original V-NO cohort that is represented here. Briefly, the protocol included obtaining an 8 a.m. fasting baseline blood sample for determining plasma testosterone levels, a mid-morning sample for measurement of AMH, pelvic ultrasonography, SDAST (administration of 0.25 mg/m2 dexamethasone orally at 12:00, and procurement of a blood sample 4 hours later for measurement of testosterone), a GnRHag test (administration of the short-acting GnRHag leuprolide acetate (10 μg/kg) at 6 p.m., and procurement of blood samples 20–24 hours later for 17-OHP after a repeated dexamethasone dose) (10, 12, 29).
Laboratory Methods
Serum samples for AMH were stored at −70°C until assayed in duplicate using a single lot of assay kits. AMH was measured by ELISA (Gen II [A73818]; Beckman Coulter) with a sensitivity of 0.08 ng/mL (0.57 pmol/L). The intra-assay coefficient of variability was 5.1% (at 2.99 ng/mL) and 1.7% (9.59 ng/mL), and interassay was 6.1% (2.99 ng/mL) and 5.4% (9.59 ng/mL). Real-time pelvic ultrasound imaging was performed by experienced pediatric ultrasonographers per abdomen in adolescents and by gynecologic ultrasonographers vaginally in adults with the use of an Acuson Sequoia with a 4-Mhz transducer and a General Electric Voluson 730 5–9 MHz transducer, respectively, findings from which have been previously reported (12). Each study subject was categorized according to which of the modified Rotterdam criteria for polycystic ovary she met: none; ≥10 follicles 2–9 mm diameter in the maximum plane (“polyfollicular ovary”); volume >10.5 cm using the formula for a prolate ellipsoid (>10.8 cm in adolescents, “polycystic-size ovary”); or both (3, 4, 7).
Steroid assays were performed in duplicate as previously reported (10). Plasma total testosterone was measured by a validated direct RIA kit (Coat-A-Count; Diagnostic Products Corp.) with interassay precision of 11% and functional sensitivity of 10 ng/dL. The plasma free testosterone concentration was computed as the product of total testosterone and percentage free testosterone, which was determined directly in plasma by competitive protein-binding assay with a precision of 12% and sensitivity of 3 pg/mL. 17-OHP was measured by postchromatographic RIA with a precision of 12% and sensitivity of 25 ng/dL.
Data Analysis
The primary analysis used receiver-operating characteristic (ROC) methods to compare groups. The Wilcoxon rank-sum test was used to determine whether the area under the ROC curve was significantly different from 0.5 (indicating a marker with accuracy no better than expected by chance). Cut-points with ≥95% specificity for distinguishing among groups were derived from ROC analysis and applied to subsequent analyses.
Data distributions were normalized with the use of logarithmic transformation, if necessary, before analysis by paired or unpaired Student t tests or one-way analysis of variance using Tukey post hoc comparisons; Dunn test was used for post hoc comparisons when the nonparametric Kruskal-Wallis test was required. Categoric variables were compared between groups with the use of a chi-square or Fisher exact test. Univariate and multivariate linear regression analyses were performed to examine associations between various factors. Data analyses were performed with the use of Excel (Microsoft Corp.), Prism (GraphPad Software), and Stata version 11 (Statacorp) programs. Results are expressed as mean ± SEM except as otherwise specified; two-tailed P<.05 was considered to be statistically significant.
RESULTS
Distinguishing Characteristics of Study Groups
By definition, the groups were age matched, the presence of a polycystic ovary distinguished the V-NO and V-PCO groups, an elevated baseline plasma testosterone defined the hyperandrogenism of the PCOS groups, and an elevated 17-OHP response to GnRHag distinguished the PCOS-T from the PCOS-A group. The baseline features and distinguishing characteristics of the four main groups are presented in Table 1.
A polycystic ovary was present in a higher proportion of PCOS-T (95%) than PCOS-A (67%; P=.01). Increased ovarian volume fulfilled polycystic ovary criteria in 76% of PCOS-T and 82% of V-PCO, but only 39% of PCOS-A (P<.01).
V-PCO was intermediate between V-NO and PCOS regarding elevations of baseline free testosterone, post-SDAST testosterone (significantly vs. PCOS-A and PCOS-T), and post-GnRHag 17-OHP (significantly vs. V-NO and PCOS-T; Table 1). PCOS-A had baseline and post-SDAST testosterone levels intermediate between V-NO and PCOS-T and differed significantly from both (10) (Table 1).
Comparisons of AMH Levels Among Study Groups
AMH levels of V-PCO and PCOS-A were similar, but significantly higher than those of V-NO and less than those of PCOS-T (Table 1). AMH levels exceeded the V-NO 95th percentile (5.8 ng/mL) in 32% of V-PCO, 50% of PCOS-A, and 81% of PCOS-T (Fig. 2A). ROC analysis indicated that a serum AMH concentration >6.2 ng/mL distinguished V-NO from all groups with 95% specificity (P≤.005). The sensitivity of this cut-off was high for discrimination from PCOS-T (81%; 83% for subset of PCOS-T with a polycystic ovary), but low for PCOS-A (39%; 42% for subset of PCOS-A with a polycystic ovary) and V-PCO (32%).
Figure 2.
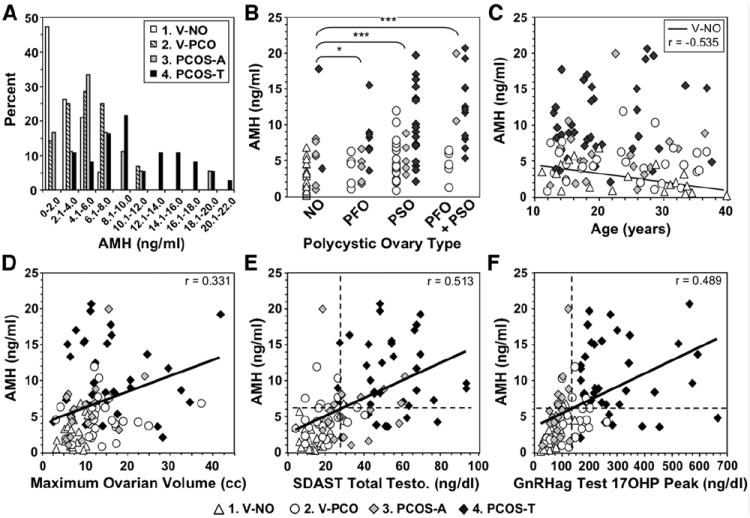
Relationship of antimüllerian hormone (AMH) serum levels to PCOS features. (A) Distribution of AMH levels in study groups (abbreviations as in Fig. 1). Statistical differences among groups are given in Table 1. (B) Relationship of AMH level to type of polycystic ovary. NO = normal ovary; PFO = polyfollicular ovary; PSO = polycystic-size ovary. P values of <.05 and <.001 indicated by * and ***, respectively. (C) Relationship of AMH levels to age. Age correlated significantly with AMH in the V-NO group, in which the expected inverse relationship was seen (line; P<.02). (D) Relationship of AMH levels to volume of each individual’s largest ovary. Cross-group correlation significant, P<.001. (E) Relationship between baseline AMH level and short dexamethasone androgen-suppression test (SDAST) response. Cross-group correlation significant, P<.0001. (F) Relationship between baseline AMH level and the peak 17-OHP response to GnRH agonist (GnRHag). Cross-group correlation significant, P<.0001. In panels E and F, the dashed lines indicate the cut-points that provide 95% specificity for distinguishing V-NO from PCOS-T.
Considerably higher AMH levels were required to differentiate PCOS-T or PCOS-A from V-PCO, as is apparent from the distribution of AMH levels (Fig. 2A and B). ROC analysis indicated that AMH >10.7 ng/mL discriminated V-PCO from PCOS with 96% specificity; sensitivity was 41% for PCOS-T (P<.0001) and 6% for PCOS-A (P=NS).
Relationship of AMH Level to the Polycystic Ovary and Specific Tests of Ovarian Function
AMH levels correlated with the presence of a polycystic ovary (r=0.415; P<.0001). This correlation was independent of age across groups (P<.001) although AMH was significantly and uniquely inversely correlated with age within the V-NO group (P<.02) (Fig. 2C).
AMH levels were significantly increased in subjects with all types of polycystic ovaries (Fig. 2B). AMH levels correlated with ovarian volume across groups (Fig. 2D). Multiple linear regression analysis indicated that AMH was independently related (R2 = 0.193) to follicle excess criteria (P=.011) and, especially, to ovarian size (P<.001).
Among all PCOS patients, AMH levels were normal in most who lacked a polycystic ovary (5/8), and they were appropriate for the presence of a polycystic ovary (≤10.7 ng/mL) in 68% (32/47) of the others. Overall, AMH was inappropriately elevated for polycystic ovary status in 41% PCOS-T and 17% PCOS-A (P=.13).
AMH levels correlated across groups with baseline free testosterone (r = 0.432, not shown), testosterone response to SDAST (r = 0.513), and 17OHP response to GnRHag (r = 0.489), all with P<.0001 (Fig. 2E and F). In a multivariate model, AMH correlated independently across groups (R2 = 0.379) with a polycystic-size ovary (P=.005) and SDAST testosterone (P=.001), but not a polyfollicular ovary (P=.105) or peak 17-OHP response to GnRHag (P=.109). In a summary multivariate model, AMH correlated independently (R2 = 0.285) with polycystic ovary (P=.014) and ovarian hyperandrogenism (P<.001) status.
Because our data confirm the report that AMH levels correlate inversely with body mass index in PCOS (25) (Supplemental Fig. 1), the possibility that the lower AMH levels of PCOS-A than of PCOS-T is a function of their greater obesity was tested. This analysis showed that the low AMH of PCOS-A is independent of obesity and is instead related to their milder ovarian dysfunction (Supplemental Results).
Supplemental Figure 2 shows all within-group relationships of AMH to age, ovarian volume, and ovarian function test results.
Comparisons of AMH Levels Among Subgroups
AMH levels were not significantly different among V-PCO subgroups (Table 2). They were significantly higher in the pooled normoandrogenemic V-PCO subgroups (subgroups 2a and 2b) than in V-NO (P=.02). Among V-PCO with asymptomatic hyperandrogenemia (subgroup 2c, which met Rotterdam criteria for PCOS), one-half had mild AMH elevation (6.24–6.37 ng/mL). This contrasts with the finding that every member of this subgroup had an abnormal test of ovarian androgenic function, i.e., either an elevated 17-OHP response to GnRHag and/or an elevated testosterone in response to SDAST.
AMH levels were also not significantly different between the PCOS-A subgroup that had an ovarian source for androgen excess compared with the subgroup without an ovarian source for androgen (Table 2). Among PCOS-A subjects who had normal tests of ovarian androgenic function (subgroup 3a), AMH was normal or appropriate for having a polycystic ovary in 6/7. In PCOS-A subgroup 3b, which had ovarian hyperandrogenism according to SDAST, AMH was elevated (>6.2 ng/mL) in 45%, but the elevations were appropriate for polycystic ovary status (<10.7 ng/mL) in all.
These subgroup analyses provide further evidence that AMH elevation is associated with the presence of a polycystic ovary independently of ovarian hyperandrogenism. The interrelationships among AMH levels and ovarian function parameters according to subgroup are shown in Supplemental Figure 3.
DISCUSSION
This study demonstrates for the first time that AMH levels correlate with the outcome of specific tests of ovarian androgenic function and are highest in PCOS-T, the most severe form of PCOS. On the other hand, our data indicate that the AMH level is also related to the presence of a polycystic ovary independently of the presence of ovarian hyperandrogenism.
The AMH level that distinguishes normal volunteers who lack a polycystic ovary (V-NO) from PCOS-T with 95% specificity (>6.2 ng/mL) is similar to the cut-off level proposed by Dewailly et al. for the diagnosis of PCOS (26). However, much higher AMH levels (>10.7 ng/mL) are required to comparably distinguish PCOS from asymptomatic women with a polycystic ovary, and sensitivity using this cut-point is poor.
Polycystic ovaries are common in asymptomatic young women (6, 12, 13, 15), and asymptomatic women with polycystic ovaries have significantly higher AMH levels than those without polycystic ovaries. These results are consistent with earlier findings in adolescents and ovulatory women (15, 30). They are also in agreement with earlier in vitro studies, which demonstrated that AMH production by polycystic ovaries from ovulatory women is intermediate between that produced by normal ovaries and polycystic ovaries from PCOS women (20). On the basis of AMH elevation, our study suggests that one-third of asymptomatic women who bear a polycystic ovary have increased folliculogenesis. The high prevalence of asymptomatic women bearing a polycystic ovary may explain the wide discrepancy among reports of the normal range for AMH levels (31, 32).
Our subgroup analyses show that AMH levels do not detect mild forms of PCOS. They are not significantly more elevated in PCOS-A than in asymptomatic volunteers with a polycystic ovary (V-PCO). Furthermore, they do not distinguish the asymptomatic V-PCO subgroups that are normoandrogenemic from the V-PCO subgroup that, though asymptomatic, meets Rotterdam criteria for PCOS and uniformly has evidence of ovarian hyperandrogenism.
Further evidence that the presence of ovarian hyperandrogenism and polycystic ovary are independent determinants of the AMH level comes from a variety of statistical considerations. The correlation of AMH with specific tests for ovarian hyperandrogenism is modest (r ~0.5), which indicates that ovarian hyperandrogenism accounts for only about 25% of the variance in AMH levels. In addition, our multivariate modeling indicates that the AMH level correlated independently with ovarian volume and SDAST outcome. In our study, AMH correlated better with ovarian volume than with the presence of an ultrasonographically detectable excessive follicle count. This may stem from larger ovaries having an increased number of preantral or very small (<2 mm) antral follicles, the granulosa cells of which all express AMH (16-18, 33). However, the correlation of antral follicle count with AMH levels was reported to be higher (r = 0.77) when advanced ultrasound technology capable of detecting antral follicles <2 mm was used (26); that finding suggests that antral follicles may account for ~60% of the variance in AMH levels.
Our findings support the concept that the increased AMH of the polycystic ovary and of PCOS is a manifestation of altered granulosa cell function (16). Disordered folliculogenesis that involves resistance to AMH action is suggested by an increase in the ratio of growing to resting follicles in polycystic ovaries (17) and hypersensitivity to FSH despite elevated AMH levels in PCOS (34). This altered granulosa cell function may be intrinsic, but it may be linked to the apparent underlying intrinsic defect in theca cells that causes excessive androgen production (1, 11, 24).
However, it must be recognized that polycystic ovarian morphology in otherwise normal women does not commonly predispose them to develop PCOS (14). That observation is consistent with our finding that one-half of our apparently normal women with a polycystic ovary and elevated AMH did not have any evidence of ovarian steroidogenic dysfunction. This observation suggests that this “normal-variant” type of polycystic ovary is likely to be a normal variation in folliculogenesis unrelated to PCOS. This variant may be indicative of an increased ovarian follicular reserve that confers an evolutionary advantage by prolonging the reproductive lifespan. This concept is supported by our finding that the V-PCO group lacked the inverse relationship of AMH levels to age as they approach menopause, a relationship that is well established in apparently normal women who lack a polycystic ovary. Our data are consistent with the data of others who have shown a subnormal fall in AMH in ovulatory as well as anovulatory women who have a polycystic ovary (15, 35).
In summary, our findings indicate that AMH levels are independently related to ovarian hyperandrogenism and polycystic ovary parameters and that AMH levels of women with PCOS overlap with those of normal volunteers with polycystic ovaries. Our data have the practical implication that only substantial AMH elevations are specific for PCOS; in the absence of hyperandrogenic anovulation, moderate AMH elevation in a woman with a polycystic ovary implies an increased oocyte pool size and suggests an increased reproductive lifespan.
Supplementary Material
Acknowledgments
The authors give special thanks to Drs. Kate Feinstein and David Yousefzade for pediatric ultrasonography.
Supported in part by the Eunice Kennedy Shriver National Institute of Child Health and Human Development, National Institutes of Health, through cooperative agreement (U54-041859) as part of the Specialized Cooperative Centers Program in Reproduction and Infertility Research; RR-00055 and UL1RR024999 from the National Center For Research Resources; and University of Chicago (DRTC P60-DK20595).
Footnotes
R.L.R. has nothing to disclose. K.W. has nothing to disclose. V.P. has nothing to disclose. E.L. has nothing to disclose. M.M. has nothing to disclose. D.A.E. has nothing to disclose.
References
- 1.Ehrmann DA, Barnes RB, Rosenfield RL. Polycystic ovary syndrome as a form of functional ovarian hyperandrogenism due to dysregulation of androgen secretion. Endocrin Rev. 1995;16:322–53. doi: 10.1210/edrv-16-3-322. [DOI] [PubMed] [Google Scholar]
- 2.Zawadzki J, Dunaif A. Diagnostic criteria for polycystic ovary syndrome: toward a rational approach. In: Dunaif A, Givens J, Haseltine F, Merriam G, editors. Polycystic ovary syndrome. Vol. 4. Cambridge, MA: Blackwell Scientific Publications; 1992. pp. 377–84. [Google Scholar]
- 3.Adams J, Franks S, Polson DW, Mason HD, Abdulwahid NA, Tucker M, et al. Multifollicular ovaries: clinical and endocrine features and response to pulsatile gonadotrophin releasing hormone. Lancet. 1985;2:1375–9. doi: 10.1016/s0140-6736(85)92552-8. [DOI] [PubMed] [Google Scholar]
- 4.Balen AH, Laven JS, Tan SL, Dewailly D. Ultrasound assessment of the polycystic ovary: international consensus definitions. Hum Reprod Update. 2003;9:505–14. doi: 10.1093/humupd/dmg044. [DOI] [PubMed] [Google Scholar]
- 5.Taylor AE, McCourt B, Martin KA, Anderson EJ, Adams JM, Schoenfeld D, et al. Determinants of abnormal gonadotropin secretion in clinically defined women with polycystic ovary syndrome. J Clin Endocrinol Metab. 1997;82:2248–56. doi: 10.1210/jcem.82.7.4105. [DOI] [PubMed] [Google Scholar]
- 6.Legro RS, Chiu P, Kunselman AR, Bentley CM, Dodson WC, Dunaif A. Polycystic ovaries are common in women with hyperandrogenic chronic anovulation but do not predict metabolic or reproductive phenotype. J Clin Endocrinol Metab. 2005;90:2571–9. doi: 10.1210/jc.2004-0219. [DOI] [PubMed] [Google Scholar]
- 7.Rotterdam ESHRE/ASRM-Sponsored PCOS Consensus Workshop Group. Revised 2003 consensus on diagnostic criteria and long-term health risks related to polycystic ovary syndrome. Fertil Steril. 2004;81:19–25. doi: 10.1016/j.fertnstert.2003.10.004. [DOI] [PubMed] [Google Scholar]
- 8.Azziz R, Carmina E, Dewailly D, Diamanti-Kandarakis E, Escobar-Morreale HF, Futterweit W, et al. The Androgen Excess and PCOS Society criteria for the polycystic ovary syndrome: the complete task force report. Fertil Steril. 2009;91:456–88. doi: 10.1016/j.fertnstert.2008.06.035. [DOI] [PubMed] [Google Scholar]
- 9.Hirshfeld-Cytron J, Barnes RB, Ehrmann DA, Caruso A, Mortensen MM, Rosenfield RL. Characterization of functionally typical and atypical types of polycystic ovary syndrome. J Clin Endocrinol Metab. 2009;94:1587–94. doi: 10.1210/jc.2008-2248. [DOI] [PMC free article] [PubMed] [Google Scholar]
- 10.Rosenfield RL, Mortensen M, Wroblewski K, Littlejohn E, Ehrmann DA. Determination of the source of androgen excess in functionally atypical polycystic ovary syndrome by a short dexamethasone androgen-suppression test and a low-dose ACTH test. Hum Reprod. 2011;26:3138–46. doi: 10.1093/humrep/der291. [DOI] [PMC free article] [PubMed] [Google Scholar]
- 11.Nelson VL, Legro RS, Strauss JF, 3rd, McAllister JM. Augmented androgen production is a stable steroidogenic phenotype of propagated theca cells from polycystic ovaries. Mol Endocrinol. 1999;13:946–57. doi: 10.1210/mend.13.6.0311. [DOI] [PubMed] [Google Scholar]
- 12.Mortensen M, Ehrmann DA, Littlejohn E, Rosenfield RL. Asymptomatic volunteers with a polycystic ovary are a functionally distinct but heterogeneous population. J Clin Endocrinol Metab. 2009;94:1579–86. doi: 10.1210/jc.2008-2771. [DOI] [PMC free article] [PubMed] [Google Scholar]
- 13.Farquhar CM, Birdsall M, Manning P, Mitchell JM, France JT. The prevalence of polycystic ovaries on ultrasound scanning in a population of randomly selected women. Aust N Z J Obstet Gynaecol. 1994;34:67–72. doi: 10.1111/j.1479-828x.1994.tb01041.x. [DOI] [PubMed] [Google Scholar]
- 14.Murphy MK, Hall JE, Adams JM, Lee H, Welt CK. Polycystic ovarian morphology in normal women does not predict the development of polycystic ovary syndrome. J Clin Endocrinol Metab. 2006;91:3878–84. doi: 10.1210/jc.2006-1085. [DOI] [PubMed] [Google Scholar]
- 15.Johnstone EB, Rosen MP, Neril R, Trevithick D, Sternfeld B, Murphy R, et al. The polycystic ovary post-Rotterdam: a common, age-dependent finding in ovulatory women without metabolic significance. J Clin Endocrinol Metab. 2010;95:4965–72. doi: 10.1210/jc.2010-0202. [DOI] [PMC free article] [PubMed] [Google Scholar]
- 16.Webber LJ, Stubbs S, Stark J, Trew GH, Margara R, Hardy K, et al. Formation and early development of follicles in the polycystic ovary. Lancet. 2003;362:1017–21. doi: 10.1016/s0140-6736(03)14410-8. [DOI] [PubMed] [Google Scholar]
- 17.Stubbs SA, Hardy K, da Silva–Buttkus P, Stark J, Webber LJ, Flanagan AM, et al. Anti-mullerian hormone protein expression is reduced during the initial stages of follicle development in human polycystic ovaries. J Clin Endocrinol Metab. 2005;90:5536–43. doi: 10.1210/jc.2005-0907. [DOI] [PubMed] [Google Scholar]
- 18.Pigny P, Jonard S, Robert Y, Dewailly D. Serum anti-Mullerian hormone as a surrogate for antral follicle count for definition of the polycystic ovary syndrome. J Clin Endocrinol Metab. 2006;91:941–5. doi: 10.1210/jc.2005-2076. [DOI] [PubMed] [Google Scholar]
- 19.Carlsson IB, Scott JE, Visser JA, Ritvos O, Themmen AP, Hovatta O. Anti-mullerian hormone inhibits initiation of growth of human primordial ovarian follicles in vitro. Hum Reprod. 2006;21:2223–7. doi: 10.1093/humrep/del165. [DOI] [PubMed] [Google Scholar]
- 20.Pellatt L, Hanna L, Brincat M, Galea R, Brain H, Whitehead S, et al. Granulosa cell production of anti-mullerian hormone is increased in polycystic ovaries. J Clin Endocrinol Metab. 2007;92:240–5. doi: 10.1210/jc.2006-1582. [DOI] [PubMed] [Google Scholar]
- 21.Andersen CY, Schmidt KT, Kristensen SG, Rosendahl M, Byskov AG, Ernst E. Concentrations of AMH and inhibin-B in relation to follicular diameter in normal human small antral follicles. Hum Reprod. 2010;25:1282–7. doi: 10.1093/humrep/deq019. [DOI] [PubMed] [Google Scholar]
- 22.Jayaprakasan K, Deb S, Batcha M, Hopkisson J, Johnson I, Campbell B, et al. The cohort of antral follicles measuring 2–6mm reflects the quantitative status of ovarian reserve as assessed by serum levels of anti-mullerian hormone and response to controlled ovarian stimulation. Fertil Steril. 2010;94:1775–81. doi: 10.1016/j.fertnstert.2009.10.022. [DOI] [PubMed] [Google Scholar]
- 23.la Marca A, Broekmans FJ, Volpe A, Fauser BC, Macklon NS. Anti-mullerian hormone (AMH): what do we still need to know? Hum Reprod. 2009;24:2264–75. doi: 10.1093/humrep/dep210. [DOI] [PubMed] [Google Scholar]
- 24.Jonard S, Dewailly D. The follicular excess in polycystic ovaries, due to intraovarian hyperandrogenism, may be the main culprit for the follicular arrest. Hum Reprod Update. 2004;10:107–17. doi: 10.1093/humupd/dmh010. [DOI] [PubMed] [Google Scholar]
- 25.Piouka A, Farmakiotis D, Katsikis I, Macut D, Gerou S, Panidis D. Anti-mullerian hormone levels reflect severity of PCOS but are negatively influenced by obesity: relationship with increased luteinizing hormone levels. Am J Physiol Endocrinol Metab. 2009;296:E238–43. doi: 10.1152/ajpendo.90684.2008. [DOI] [PubMed] [Google Scholar]
- 26.Dewailly D, Gronier H, Poncelet E, Robin G, Leroy M, Pigny P, et al. Diagnosis of polycystic ovary syndrome (PCOS): revisiting the threshold values of follicle count on ultrasound and of the serum AMH level for the definition of polycystic ovaries. Hum Reprod. 2011;26:3123–9. doi: 10.1093/humrep/der297. [DOI] [PubMed] [Google Scholar]
- 27.Dewailly D, Pigny P, Soudan B, Catteau-Jonard S, Decanter C, Poncelet E, et al. Reconciling the definitions of polycystic ovary syndrome: the ovarian follicle number and serum anti-mullerian hormone concentrations aggregate with the markers of hyperandrogenism. J Clin Endocrinol Metab. 2010;95:4399–405. doi: 10.1210/jc.2010-0334. [DOI] [PubMed] [Google Scholar]
- 28.Raine-Fenning N. What’s in a number? The polycystic ovary revisited. Hum Reprod. 2011;26:3118–22. doi: 10.1093/humrep/der300. [DOI] [PubMed] [Google Scholar]
- 29.Rosenfield RL, Perovic N, Ehrmann DA, Barnes RB. Acute hormonal responses to the gonadotropin releasing hormone agonist leuprolide: dose-response studies and comparison to nafarelin. J Clin Endocrinol Metab. 1996;81:3408–11. doi: 10.1210/jcem.81.9.8784105. [DOI] [PubMed] [Google Scholar]
- 30.Villarroel C, Merino PM, Lopez P, Eyzaguirre FC, Van Velzen A, Iniguez G, Codner E. Polycystic ovarian morphology in adolescents with regular menstrual cycles is associated with elevated anti-Mullerian hormone. Hum Reprod. 2011;26:2861–8. doi: 10.1093/humrep/der223. [DOI] [PubMed] [Google Scholar]
- 31.Hagen CP, Aksglaede L, Sorensen K, Main KM, Boas M, Cleemann L, et al. Serum levels of anti-mullerian hormone as a marker of ovarian function in 926 healthy females from birth to adulthood and in 172 Turner syndrome patients. J Clin Endocrinol Metab. 2010;95:5003–10. doi: 10.1210/jc.2010-0930. [DOI] [PubMed] [Google Scholar]
- 32.Kelsey TW, Wright P, Nelson SM, Anderson RA, Wallace WH. A validated model of serum antimullerian hormone from conception to menopause. PLoS One. 2011;6:e22024. doi: 10.1371/journal.pone.0022024. [DOI] [PMC free article] [PubMed] [Google Scholar]
- 33.Stubbs SA, Stark J, Dilworth SM, Franks S, Hardy K. Abnormal preantral folliculogenesis in polycystic ovaries is associated with increased granulosa cell division. J Clin Endocrinol Metab. 2007;92:4418–26. doi: 10.1210/jc.2007-0729. [DOI] [PubMed] [Google Scholar]
- 34.Nardo LG, Gelbaya TA, Wilkinson H, Roberts SA, Yates A, Pemberton P, et al. Circulating basal anti-mullerian hormone levels as predictor of ovarian response in women undergoing ovarian stimulation for in vitro fertilization. Fertil Steril. 2009;92:1586–93. doi: 10.1016/j.fertnstert.2008.08.127. [DOI] [PubMed] [Google Scholar]
- 35.Laven JS, Mulders AG, Visser JA, Themmen AP, De Jong FH, Fauser BC. Anti-mullerian hormone serum concentrations in normoovulatory and anovulatory women of reproductive age. J Clin Endocrinol Metab. 2004;89:318–23. doi: 10.1210/jc.2003-030932. [DOI] [PubMed] [Google Scholar]
Associated Data
This section collects any data citations, data availability statements, or supplementary materials included in this article.