Abstract
Vibratory measurements of the structures of the ear are key to understanding much of the pathology in mouse models of hearing loss. Unfortunately the high-speed sampling required to interrogate the high end of the mouse hearing spectrum is beyond the reach of most optical coherence tomography (OCT) systems. To address this issue, we have developed an algorithm that enables phase-sensitive OCT measurements over the full range of the mouse hearing spectrum (4–90 kHz). The algorithm phase-locks the line-trigger to the acoustic stimulation and then uses interleaved sampling to reconstruct the signal with higher temporal sampling. The algorithm was evaluated by measuring the vibratory response of mouse tympanic membrane to a pure tone stimulus.
There is growing interest in utilizing optical coherence tomography (OCT) to image the morphology and function of the middle and inner ear [1]. The interest stems from the fact that our ability to measure how sound causes structures within the ear to vibrate is severely limited. Hearing loss often has its origin in pathological processes that alter these normal vibratory patterns [2]. The resolution, speed, sensitivity, and ability to image through turbid media feeds the hope that OCT will deliver high-fidelity in vivo images of ear morphology and function. Such images are needed to build our understanding of hearing loss in animal models, aid diagnosis in humans, and potentially guide surgical intervention.
The high expectations are in part driven by the exquisite phase sensitivity of OCT that can be exploited to measure the extremely small periodic mechanical motions of the ear. Measured picometer scale sensitivities [3] compare favorably to the nanometer scale motion expected in the middle and inner ear. In effect, a phase-sensitive OCT system can be utilized as a high-resolution non/minimally invasive vibrometer.
The similarity of mouse ear function to humans as well as the ability to generate mice that contain hearing loss mutation [4] has made mice one of the most prevalent animal models of hearing. Human hearing ranges between 20 Hz–20 kHz, however mice hearing ranges between 4–90 kHz. The high-frequency range poses a technical problem for most OCT systems.
Based on the Nyquist sampling theorem, in order to measure a 90 kHz signal, the sampling rate must be at least 180 kHz. The sampling rate for measuring motion with a spectrometer based OCT system is the line-scan camera's line-rate. For most systems, the line-rate is below 60 kHz and limited by the readout time. A Nyquist frequency of 30 kHz, while adequate for humans, leaves two-thirds of the hearing spectrum of mice unreachable.
One approach would be to simply use a faster line-scan camera. To the best of our knowledge the only commercially available camera that exceeds the 180 kHz linerate threshold is the e2v EM4 which operates at 210 kHz with 512 pixels. The 512 spectral samples would limit the spectrometer performance resulting in relatively poor OCT signal fall-off and ~1 mm Nyquist depth. A second approach would be to use a fast scanning swept-laser for SSOCT. Unfortunately, to the best of our knowledge, the fastest commercially available laser source operates at 100 kHz, well below our 180 kHz threshold. We note that there are experimental prototype swept-laser sources capable of sweep rates well above 180 kHz.
In order to overcome this limitation we have developed a simple and cost effective technique that enables the use of a slow line-rate camera (or swept-laser) and still interrogate the entire range of the mouse hearing spectrum. The technique exploits the periodic nature of the mechanical motion of the ear by phase-locking the camera triggering (sweep) to the acoustic stimulation of the ear. It is analogous to the coherent interleaved sampling technique used in oscilloscopes which phase-locks the sample clock to the bit clock [5].
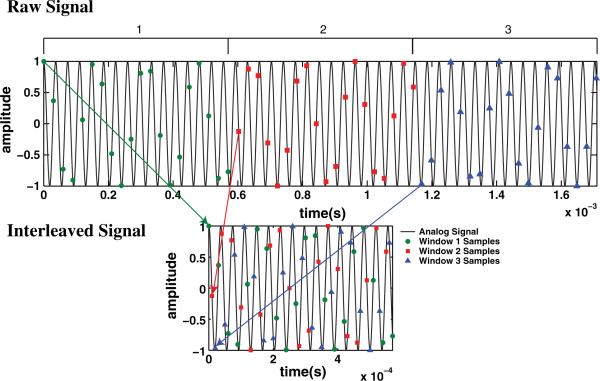
Consider the following example shown schematically in Fig. 1. The analog signal (interferometric phase) is divided into three time intervals or windows. Within each window the line-scan camera (sweep) is triggered at rate fs. Each trigger initiates an integration time (sweep) and corresponds to one sample. The triggers (sweeps) in each window are phase shifted from the previous window by τs/3 + φ relative to the previous window, where φ is given by φ = ceil(τs/τ)τ, τs is the sampling period, and τ is the period of the signal. The additional phase factor, φ, ensures that we do not attempt to sample faster than fs and that the sampling remains in phase with the analog signal. When the samples from the three windows are interleaved the effective sampling is 3fs, which leads to a Nyquist frequency of 3/2fs.
Fig. 1.
(Color online) Schematic diagram of coherent interleaving algorithm for three phase steps. Arrows indicate how the samples are interleaved.
More generally, assume we have a periodic signal S(t) that exists over a time interval T. If we divide T into N windows, the phase shift between adjacent windows is τs/N + φ. The coherently interleaved signal is then
| (1) |
where n is the number of samples per window and ai,j is the amplitude of the signal at time ti,j. The original signal is simply Eq. (1) with the order of summations swapped. The coherently interleaved signal will then have sampling and Nyquist frequencies of Nfs and Nfs/2, respectively. The number of windows may be arbitrarily increased in order to increase the Nyquist frequency.
Practically, the signal will be degraded due to roll-off associated with the integration time (sweep time) as the signal frequency, f, approaches (tint)–1. For a spectrometer based system, if we assume the integration time of the camera may be approximated by a rectangular function with width tint, then the roll-off is given by sin(tintΠ)f/(tintΠf). Under these conditions, the signal strength will be exactly 0 at f = (tint)–1, hence the roll-off reduces the useful frequency range.
In order to use the coherently interleaved sampling algorithm, the period of the signal must be known a priori. Fortunately, this is the case for hearing tests on humans or animals. The stimulus is a pure sine wave tone played from a calibrated, low-distortion speaker. While there are distortion products generated within the ear, the resulting frequency spectra are fairly simple [6]. Aliased frequencies can be readily identified by recording two sets of data with slightly different sampling frequencies and looking for peaks which change frequency. The true frequency of the aliased peaks may be estimated from this data as well and the estimate of signal period revised accordingly. The period of the total signal is the least common multiple of the periods of each component signal.
We have utilized a fairly typical spectrometer based OCT system to test and verify the algorithm described above. The system used a 40 nm bandwidth super luminescent diode centered at 830 nm as a source. A 2 × 2 (50:50) fused fiber coupler formed the backbone of a Michelson type interferometer. The sample beam was scanned across the sample by using a 2D galvonometer based mirror scanner. The lateral and axial resolutions were 14 μm and 8 μm (in air), respectively.
As a proof of concept demonstration of the algorithm, we have imaged a piezo-electric element. The piezo was driven with a sinusoidal voltage which induced a small sinusoidal vibration. For each drive (input) frequency an M-scan was acquired of the piezo using three windows with 400 lines per window. The integration time was set at 17 μs which resulted in a sampling rate of 20.83 kHz and a Nyquist frequency of 10.42 kHz. Interleaving the three windows yielded a Nyquist frequency of 31.25 kHz.
The spectral interferograms were processed in the usual way [1]. The custom-built spectrometer had a maximum line-rate of 28 kHz at an integration time of 5 μs (31 μs readout).
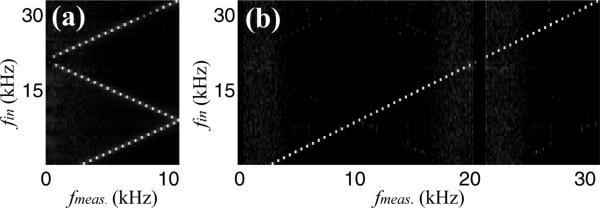
In order to extract the periodic motion, the phase was processed using the following algorithm. The phase in each of the three windows was independently unwrapped and high-pass filtered with a cutoff frequency of 300 Hz. The high-pass filter served to remove any DC term in the phase and low frequency phase drift. The unwrapped filtered phase was then interleaved as outlined above and multiplied by a Hanning window before calculating the frequency spectrum. The results for input frequencies of 3–31 kHz with 0.5 kHz steps are shown in Fig. 2. Panels (a) and (b) are the results without and with interleaving, respectively. The gap centered on the sampling frequency is due to the high-pass filtering of the unwrapped phase. Signals at the sampling frequency are aliased back to 0 and therefore filtered out in this step. As expected, in panel (a) when the input frequency exceeds the Nyquist frequency we observe aliasing of the signal. In contrast if we interleave the samples from the three windows we are able to reliably measure the frequency content of the signal up to the new Nyquist frequency, 31.25 kHz.
Fig. 2.

Measured vibrational response, fmeas, from a piezo element without (a) and with (b) coherent interleaved sampling and driven at input frequency, fin. The amplitude (gray scale) is a logarithm of the measure signal.
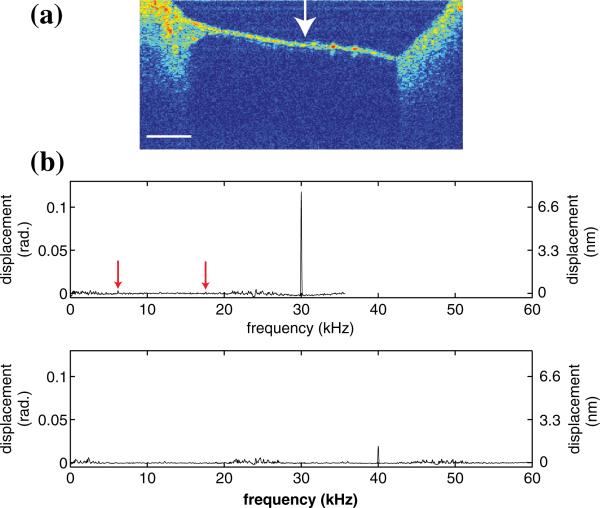
We have further evaluated the developed algorithm by imaging vibrations in the tympanic membrane of a euthanized adult mouse. The outer ear of the mouse was removed in order to provide unfettered access to the middle ear with our current imaging optics. To stimulate vibration of the tympanic membrane a tone was played through a speaker (Pyle electronics, PSN1165) placed within 12 inches of the mouse. A cross-sectional image (B-scan) through the tympanic membrane is shown in Fig. 3(a). The arrow indicates the approximate area where the vibrational response was measured.
Fig. 3.
(Color online) (a) B-scan of mouse tympanic membrane. Arrow indicates where the vibratory response was measured. Scale bar is 500 μm. (b) Vibratory response with 30 kHz stimulation (top) and 40 kHz stimulation (bottom). Arrow indicates residual aliased peaks at 6.2 and 17.6 kHz.
The data was collected as before except the camera integration time was 11 μs which resulted in a sampling rate of 23.8 kHz and Nyquist frequency of 11.9 kHz. Two examples of measured vibrational frequency spectra are shown in Fig. 3(b). The top example was stimulated at 30 kHz and recorded with three windows. The bottom example was stimulated at 40 kHz and recorded with five windows. In both cases the frequency content matches what we would expect from tympanic membrane stimulation with a pure tone.
Two other noteworthy features are present in addition to the strong signals at the stimulation/input frequencies in Figs. 2(b) and 3(b). First, the relative phase noise is increased around the sampling frequency and its harmonics. This is due to the fact that the noise is not coherently interleaved and is therefore effectively aliased. For instance the 1/f noise around DC is shifted to either side of the sampling frequency and its harmonics. The noise power that is shifted depends on the relationship of the particular noise frequency to the interleaved sampling parameters; hence the noise power is not perfectly mirrored at the sampling frequency and its harmonics. The second feature is residual aliased peaks evident as a faint zig-zag pattern in Fig. 2(b) and indicated by arrows in Fig. 3(b). In Fig. 3(b) the aliased peaks are ~125 times weaker than the main peak at 30 kHz.
The added noise around the sampling frequency and harmonics is a fundamental consequence of the algorithm. Suppressing the phase noise by implementing either a common mode interferometer or a phase reference would help mitigate the effects. A second pragmatic approach would be to simply vary the sampling frequency such that the signal at the stimulation frequency is in a low noise region. The standard deviation of the noise in a quiet region of the spectrum (13–18 kHz) was 2.8 × 10⁻⁴ radians (19 pm). One or both approaches will be sufficient to reduce phase noise to acceptable levels for our purposes.
In principle, the algorithm should completely suppress the aliased peaks. In practice they would become visible seemingly at random when recording multiple data sets in succession with the same parameters. Given the short acquisition time, recording several data sets in order to get one without the aliased peaks was not particularly burdensome. Nevertheless, in order to investigate the source of the aliased peaks and to test how robust the algorithm was to various sources of noise we built a model of the signal and tested the algorithm using Matlab. The model was equivalent to interference from a reflector oscillating at a single frequency, illuminated with a Gaussian source, and recorded with zero integration time.
We systematically added random noise to the sine wave amplitude and phase and trigger times. We also modeled phase drift by adding a time dependent offset to the phase using a linear and quadratic term. No aliased peaks were apparent. We were only able to reproduce the observed aliased peaks when we introduced a systematic error into the trigger times for one window. For a system with fs = 33.3 kHz and three windows a 1% (100 ns) error in the phase shift in one window produced aliased peaks that were 0.5% of the amplitude of the signal peak. Based on this result we speculate that the observed aliased peaks are due to transient systematic errors in the response of the camera to the trigger signal.
In conclusion we have developed a robust algorithm that enables the measurement of the vibratory response of the mouse ear over its entire spectrum (4 kHz–90 kHz). The algorithm uses a coherent interleaving technique that phase-locks the acoustic stimulation to the line-camera trigger. Modeling of the algorithm indicates that it is robust to noise in the amplitude, phase and trigger timing, however it is susceptible to systematic error in the trigger timing. While we have demonstrated the technique using a spectrometer based OCT system, it could also be used with a swept-source system. It will work best for swept lasers with relatively low duty cycle due to signal roll-off considerations.
Acknowledgments
This work was supported in part by grants from the Department of Defense, Congressionally Directed Medical Research Program (CDMRP) grant DM090212, and the National Institutes of Health (NIH), 1R21EB007729.
References
- 1.Gao SS, Xia A, Yuan T, Raphael PD, Shelton RL, Applegate BE, Oghalai JS. Opt. Express. 2011;19:15415. doi: 10.1364/OE.19.015415. [DOI] [PMC free article] [PubMed] [Google Scholar]
- 2.Oghalai JS. Curr. Opin. Otolaryngol Head Neck Surg. 2004;12:431. doi: 10.1097/01.moo.0000134449.05454.82. [DOI] [PMC free article] [PubMed] [Google Scholar]
- 3.Choma MA, Ellerbee AK, Yang C, Creazzo TL, Izatt JA. Opt. Lett. 2005;30:1162. doi: 10.1364/ol.30.001162. [DOI] [PubMed] [Google Scholar]
- 4.Xia A, Gao SS, Yuan T, Osborn A, Bress A, Pfister M, Maricich SM, Pereira FA, Oghalai JS. Dis. Models Mech. 2010;3:209. doi: 10.1242/dmm.004135. [DOI] [PMC free article] [PubMed] [Google Scholar]
- 5.Lauterbach M, Schnecker M. Evaluation Engineering. 2006;45:14. [Google Scholar]
- 6.Robles L, Ruggero MA. Physiol Rev. 2001;81:1305. doi: 10.1152/physrev.2001.81.3.1305. [DOI] [PMC free article] [PubMed] [Google Scholar]


