

Abstract
Objectives/Hypothesis
The cochlear amplifier is required for the exquisite sensitivity of mammalian hearing. Outer hair cells underlie the cochlear amplifier and they are unique in that they maintain an intracellular turgor pressure. Changing the turgor pressure of an isolated outer hair cells through osmotic challenge modulates its ability to produce electromotile force. We sought to determine the effect of osmotic challenge on cochlear function.
Study Design
In vivo animal study.
Methods
Hypotonic and hypertonic artificial perilymph was perfused through the scala tympani of anesthetized guinea pigs. Cochlear function was assessed by measuring the compound action potential, distortion product otoacoustic emissions, the cochlear microphonic, and the endocochlear potential.
Results
Hypotonic perilymph decreased and hypertonic perilymph increased compound action potential and distortion product otoacoustic emission thresholds in a dose-dependent and reversible manner. The cochlear microphonic quadratic distortion product magnitude increased after hypotonic perfusion and decreased with hypertonic perfusion. There were no changes in the stimulus intensity growth curve of the low-frequency cochlear microphonic. The endocochlear potential was not affected by perilymph osmolality.
Conclusions
These data demonstrate that perilymph osmolality can modulate cochlear function and are consistent with what would be expected if outer hair cells turgor pressure changes the gain of the cochlear amplifier in vivo.
Keywords: Cochlea, hearing, outer hair cell, electromotility, cochlear amplifier
INTRODUCTION
Mammalian cochlear outer hair cells (OHC) produce force that amplifies the cochlear traveling wave. This has been called the cochlear amplifier, and it dramatically improves auditory sensitivity and frequency selectivity.1,2 Somatic OHC electromotility is required for normal cochlear amplifier function.3 Interestingly, the OHC may be the only animal cell that maintains a turgor pressure, and it is required for the expression of electromotility.4 Presumably, a certain amount of turgor pressure is required within the OHC to couple the mechanical forces produced by plasma membrane based motor complexes to the lateral wall cytoskeleton.5
An isolated OHC bathed in a hypotonic or hypertonic solution demonstrates an increase or decrease its intracellular volume, respectively. The orthotropic cytoskeleton of the OHC directs the resultant morphological changes so that the cell shortens and fattens as its intracellular volume increases.6,7 Modulating OHC volume, and hence its turgor, has major consequences on the cell’s biomechanical properties. Hypotonic extracellular fluid reduces whole-cell compliance and plasma membrane lateral diffusion, but increases electromotile force production.8 –12 Conversely, hypertonic extracellular fluid reduces electromotility.
On the basis of these findings in isolated OHCs, we hypothesized that modulating perilymph osmolality would modulate the cochlear amplifier. We tested this hypothesis by performing in vivo perilymphatic perfusion of the guinea pig cochlea with hypotonic and hypertonic artificial perilymph. Cochlear function was monitored using several electrophysiologic measures, including the compound action potential (CAP), distortion product otoacoustic emissions (DPOAEs), the cochlear microphonic (CM), and the endocochlear potential (EP).
METHODS
Solutions
Hypotonic artificial perilymph (260 mOsm/kg) was composed of, (in mM) 130 NaCl, 4 KCl, 1 MgCl2, 2 CaCl2, and 6 HEPES, at a pH of 7.3. The osmolality of the perilymph was increased as desired by adding additional glucose. We considered 300 mOsm/kg to represent normotonic artificial perilymph (i.e., an additional 40 mOsm/kg of glucose). Before use, the osmolality of every artificial perilymph solution was checked using a freezing pressure osmometer (The Advanced Micro Osmometer Model 3300, Advanced Instruments, Inc).
Surgical Procedures
Our Institutional Animal Care and Use Committee approved the study protocol. We performed perilymphatic perfusion of the guinea pig cochlea in vivo. Briefly, male or female guinea pigs weighting 250 to 350 g were anesthetized with ketamine (40 mg/kg) and xylazine (5 mg/kg). Supplemental anesthetic was given as needed to maintain areflexia to paw pinch. The rectal temperature was maintained constant at 38.5°C using an electric heating pad (FHC, Bowdoinham, ME). The right pinna was removed to the bony-cartilaginous junction of the ear canal and the ventral tympanic bulla was opened so that the cochlea and round window could be seen. An earbar was sealed in the bony ear canal and the speakers were coupled to it. A probe-tip microphone (type 8192, NEXUS conditioning amplifier, Bruel and Kjar, Denmark) was inserted into the earbar so that the tip of the microphone was within 3 mm of the tympanic membrane.
Two openings in the cochlea, each 200 to 400 μm in diameter, were made (Fig. 1). One was at the basal turn into scala tympani and the other was at the helicotrema. A micropipette was inserted into the basal cochleostomy and a constant pressure microinjector instilled the perfusate at 0.8 to 1.0 psi for 100 seconds (PM8000, Microdata Instruments, Inc, South Plainfield, NJ). The fluid that came out the apical end of the cochlea was aspirated with a cotton wisp. Fluid backflow during perfusions was reduced by the use of a silicon rubber gasket just behind the tip of the micropipette. Following each perfusion, the micropipette was withdrawn and excess fluid in the middle ear space was aspirated. Thus, no static intracochlear pressure was present after perfusion when the measurements of cochlear function were taken. Repeated perfusion using this technique has been shown to not cause significant cochlear trauma.13
Fig. 1.
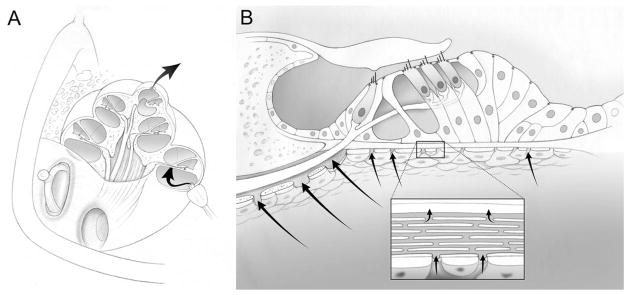
The experimental methodology of in vivo cochlear perfusion. (A) A perfusion pipette was inserted into a basal cochleostomy in the scala tympani. An apical cochleostomy at the helicotrema was used to aspirate the outflowing perfusate. Complete perilyphatic exchange of the scala tympani was performed. (B) The organ of Corti is shown. The perilymph of the scala tympani bathes the basolateral surfaces of the outer hair cells, by passing through channels in the osseous spiral lamina (habenula perforate) and through the basilar membrane itself. Thus, the perilymphatic perfusate has access to the hair cells.43,44 Tight junctions along the reticular lamina (the apical surfaces of the hair cells and supporting cells) separate endolymph from perilymph.
All animals had an initial assessment of their CAP thresholds before data collection. Only data from animals with normal CAP thresholds were included in this report. Normal CAP thresholds were considered to be <50 dB SPL between 4 and 8 kHz and <30 dB SPL between 10 and 18 kHz. Guinea pigs were killed by barbiturate overdose and bilateral thoracotomy after the experiment was finished or if the recordings demonstrated signs of cochlear deterioration (i.e., unexpected threshold elevations >10 dB).
Measurement of the Compound Action Potential (CAP) and Cochlear Microphonic (CM)
A digital signal processing unit was used to generate the sound stimuli and sample the electrophysiological responses at 200 kHz (RP2/PA5, Tucker Davis Technologies).14,15 To measure cochlear potentials, signals were recorded from the ball-ended tip of a Teflon-coated silver wire placed on the round window membrane. A silver wire inserted under the skin at the vertex of the skull was used as a reference electrode. The ground electrode was placed in the hind leg. A bioamplifier was used to amplify the signals (DB4, Tucker Davis Technologies). For the CAP, the signal was amplified 10,000 times and then band-pass filtered between 300 and 3000 Hz. For the CM, the signal was amplified 100 times and no filtering was used. However, our bioamplifer system does not pass DC signals (corner frequency <20 Hz). It has a flat frequency response until its innate corner frequency of about 20 to 22 kHz.
The CAP was elicited using 5-millisecond tone pips of alternating polarity with a 50-millisecond repetition time using a piezoelectric speaker (EC1, Tucker-Davis Technologies).16 After averaging 24 repetitions, the peak-to-peak CAP amplitude was determined. The stimulus intensity was increased in 5 or 10 dB steps from 10 to 90 dB SPL over the frequency range of 4 to 20 kHz. The CAP threshold was calculated by fitting the responses with a cubic spline and identifying when the signal was four standard deviations above the noise floor.
The CM was elicited using a 200 Hz tone produced by a 15-inch, high-compliance woofer (University Sound) coupled to the earbar. The stimulus was one-second long and its intensity ranged from 60 to 105 dB SPL. By measuring the speaker output with the probe tip microphone in the ear bar, Fourier transform (FFT) analysis demonstrated that all stimulus harmonics and noise at all other frequencies were at least 35 dB below the primary signal at all stimulus intensities. The CM response measured by the bioamplifier and the acoustic stimulus measured by the microphone were recorded every one second continuously during and between cochlear perfusions. The raw data were analyzed off-line.
The CM quadratic distortion product was elicited using two equal intensity continuous tones of 10 and 15 kHz generated by two piezoelectric speakers. With these speakers, FFT analysis of the stimuli demonstrated that harmonics were at least 60 dB below the primary signals. The magnitude of the difference tone(f2 − f1 = 5 kHz) was determined by fast FFT analysis. At the beginning of each experiment, we increased the intensity of the stimuli until the quadratic distortion product was roughly 6 dB above the surrounding noise floor. We recorded the magnitude of the CM difference tone every one second continuously during and between cochlear perfusions.
Measurement of Distortion Product Otoacoustic Emissions (DPOAEs)
Cubic DPOAEs were elicited using two primary tones of one-second duration and f2/f1 = 1.2. The intensities of the two tones were identical and ranged from 10 to 80 dB SPL in 10 dB increments over the frequency range of 4 to 20 kHz. Emissions were measured using the probe-tip microphone in the ear bar. The magnitude of the cubic difference tone [2f1 − f2] was determined by fast FFT analysis.17 The surrounding noise floor was calculated by averaging 20 adjacent frequency bins around the distortion product frequency. Finally, DPOAE thresholds were obtained by fitting the magnitudes of cubic difference tone with a cubic spline and identifying when the signal was three standard deviations above the noise floor.
Measurement of the Endolymphatic Potential (EP)
The bone overlying the basal turn was thinned to expose the spiral ligament. A glass micropipette filled with 150 mmol/L KCl was advanced through the spiral ligament while measuring the voltage referenced to the silver wire in the scalp (Axoclamp-2, Axon Instruments). The baseline bias voltage was compensated for by determining the zero-current potential of the extracochlear fluids outside of the spiral ligament, prior to entering scala media. After entering the endolymphatic space, the EP was recorded before perfusion and after each perilymphatic perfusion. At the conclusion of the experiment, the micropipette was withdrawn from the cochlea and the voltage of the extracochlear fluids remeasured to verify that no baseline drift occurred.
Statistical Analysis
All presented values are mean ± SEM. MATLAB was used for ABR and DPOAE threshold curve fitting (Release 13, The Mathworks, Natick, MA). Data were analyzed with SPSS (11.0 for Windows) and plotted with SigmaPlot (9.0, Systat Software). Statistical significance was assessed using the Student’s paired two-tailed t-test (before and after perfusion in the same cochlea) or the ANOVA test (3 or more groups to compare). P values <.05 were considered statistically significant. Linear regression was performed using the least-squares method in SigmaPlot.
RESULTS
CAP and DPOAE Measurements
The CAP represents the summed auditory nerve response to a sound stimulus. DPOAEs are sounds emitted by the cochlea in response to two-tone stimuli and represent nonlinearities associated with the cochlear amplifier. We measured CAP and DPOAE thresholds prior to opening the cochleae, after perfusing with hypotonic (260 mOsm/kg) or hypertonic (340 mOsm/kg) artificial perilymph, and again after washout with normotonic (300 mOsm/kg) artificial perilymph. The tone pip stimulus frequencies for the CAP and the F2 stimulus frequencies of the stimulus for the DPOAEs were 10, 12, and 14 kHz. The tonotopic location of these frequencies on the basilar membrane was near the site of our basal opening in the cochlea.
After opening the cochlea, there was a slight elevation in CAP thresholds (Fig. 2A). However after perfusing hypotonic perilymph, CAP thresholds improved slightly to levels below that found in the unopened cochlea. Washout with normotonic perilymph reversed the threshold shift. The converse effect was noted with hypertonic perilymph, and the threshold shifts were substantially larger (Fig. 2B). Only partial reversibility occurred in this example. While the CAP thresholds demonstrated obvious changes in response to osmotic challenge, DPOAE thresholds demonstrated smaller changes. In these examples, no threshold change was found after hypotonic perilymph perfusion (Fig. 2C), and there was a partially reversible increase in DPOAE thresholds after hypertonic perilymphatic perfusion (Fig. 2D).
Fig. 2.

Representative examples of the changes in CAP and DPOAE thresholds in response to hypotonic and hypertonic perilymphatic perfusion. Thresholds were measured at 10, 12, and 14 kHz sequentially before opening the cochlea, after making two openings in the cochlea to permit perilymphatic perfusion, after perfusion with hypotonic or hypertonic artificial perilymph (260 or 340 mOsm/kg, respectively), and after washout with normotonic artificial perilymph (300 mOsm/kg). (A) CAP thresholds increased slightly after opening the cochlea. After perfusion with hypotonic artificial perilymph, CAP thresholds decreased to levels lower than before opening the cochlea. Complete recovery occurred with washout. (B) Again, CAP thresholds increased slightly after opening the cochlea. After perfusion with hypertonic artificial perilymph, CAP thresholds increased substantially. Near complete recovery occurred after washout. This is from a different animal than presented in (A). (C) DPOAE thresholds did not obviously change after perfusion with hypotonic artificial perilymph at 10 or 12 kHz, but there was a mild decrease noted at 14 kHz. These data were collected from the same animal shown in (A). (D) DPOAE thresholds increased after perfusion with hypertonic perilymph at 12 and 14 kHz, but not at 10 kHz. Partial recovery was noted after washout. These data were collected from the same animal shown in (B).
To distinguish osmotic effects from ionic effects, we performed a series of experiments in which we opened the cochlea and performed an initial perfusion with normotonic perilymph prior to the hypotonic or hypertonic challenge. Thus, ionic concentrations were identical during subsequent perfusions and only the glucose concentration varied. We normalized the data to the initial thresholds in normotonic perilymph. Hypotonic perilymph lowered mean CAP thresholds by up to 10 dB (Fig. 3A). There were no statistically significant reductions in DPOAE thresholds (Fig. 3B). Conversely, hypertonic perilymph increased mean CAP thresholds by up to 24 dB (Fig. 3A) and DPOAE thresholds by up to 6 dB (Fig. 3B). CAP thresholds demonstrated statistically significant changes across the frequency range for both hypotonic and hypertonic perilymph perfusion (n = 8, P < .05 for each perfusion). However, the largest shifts occurred between 8 and 16 kHz. DPOAE thresholds only demonstrated statistically significant increases at 8, 10, 16, and 20 kHz after hypertonic perilymph perfusion (n = 8, P < .05) and no statistically significant changes after hypotonic perilymph perfusion (n = 8, P > .05).
Fig. 3.

Average changes in CAP and DPOAE thresholds after perfusion with hypotonic and hypertonic artificial perilymph. Each animal was initially perfused with normotonic perilymph (300 mOsm/kg) and CAP and DPOAE thresholds were measured. Subsequent changes in an animal’s threshold due to the osmotic challenge (260 or 340 mOsm/kg) were normalized to their initial threshold values. The error bars represent the SEM. Data marked with an asterix (*) indicate a statistically significant difference at that specific frequency. (A) Statistically significant decreases and increases in CAP thresholds across the frequency spectrum occurred in response to hypotonic and hypertonic perfusion, respectively. (B) Changes in DPOAE thresholds tended to mirror those found with the CAP thresholds although the effects were not as large (n = 8). No statistically significant decreases were found after hypotonic perfusion. Statistically significant increases in DPOAE thresholds were found at 8, 10, 16, and 20 kHz after hypertonic perfusion (n = 8).
We then performed another set of experiments to titrate the effect of perilymph osmolality on CAP and DPOAE thresholds (Fig. 4). After opening the cochlea, we sequentially perfused six different artificial perilymph solutions (n = 5). The first perfusion was at 300 mOsm/kg, followed (in order) by perfusions at 320, 340, 360, 260, and 280 mOsm/kg. After each perfusion, we measured CAP and DPOAE thresholds at 8, 10, and 12 kHz. We averaged thresholds at the three frequencies to get values representative of CAP and DPOAE threshold at each perilymph osmolality. Both the CAP and DPOAE data demonstrate a progressive increase in threshold with perilymph osmolality. Particularly visible in the CAP threshold data was a slight stagger between 280 and 300 mOsm/kg. Because these two data points were collected after the last and first perfusions respectively, this likely represents the accumulation of cochlear trauma related to the perfusion procedure itself. Nevertheless, the reversibility of the osmotic effect on cochlear function can also be noted from these data.
Fig. 4.

Titration of the effect of perilymph osmolality on CAP and DPOAE thresholds. Each animal was sequentially perfused with artificial perilymph of differing osmolality (order: 300, 320, 340, 360, 260, 280 mOsm/kg). Thresholds were measured after each perfusion at 8, 10, and 12 kHz and averaged to get a single mean threshold for each animal at each osmolality. The data points represent the mean thresholds of all animals (n = 5) and the error bars represent the SEM. The data were fit by linear regression (thick line) and 95% confidence intervals are shown (thin curved lines). Both CAP thresholds (A) and DPOAE thresholds (B) demonstrated statistically significant increases as the perilymph osmolality was increased.
Linear regression analysis was performed to quantify the effect of perilymph osmolality and to assess for statistical significance. For the CAP threshold, the slope was 0.25 ± 0.05 dB/mOsm/kg with and the y-intercept was −45 ± 15 dB (adjusted R2 = 0.95, P < .05 for both the slope and y-intercept values). For the DPOAE threshold, the slope was 0.066 ± 0.027 dB/mOsm/kg and the y-intercept was 22.6 ± 8.3 dB (adjusted R2 = 0.99, P < .05 for both the slope and y-intercept values). Thus, both CAP thresholds and DPOAE thresholds demonstrated statistically significant associations with perilymph osmolality.
Low-Frequency CM Measurements
The cochlear microphonic (CM) is an extracellular field potential that predominantly represents the vector sum of the receptor potentials found in OHC from the basal turn of the cochlea.18 With a low-frequency stimulus, the motion of the basilar membrane at the base of the cochlea is linear with minimal phase lag, and thus, the cochlear amplifier has minimal impact on the CM response. At high intensities, the CM response saturates because stereociliary mechanoelectrical transduction saturates. Using a 200-Hz stimulus, we measured the CM amplitude versus stimulus intensity sequentially three times: after hypotonic artificial perilymph perfusion, after normotonic artificial perilymph perfusion, and after hypertonic artificial perilymph perfusion (Fig. 5A). There were no effects of perilymph tonicity on the amplitude growth curves (n = 3).
Fig. 5.

Perilymph osmolality and the cochlear microphonic. (A) The RMS amplitudes of the 200-Hz CM at various stimulus intensities were measured sequentially in guinea pigs after perfusion with 260, 300, and 340 mOsm/kg artificial perilymph. There were no statistically significant effects of perilymph osmolality on the amplitude growth curves (n = 3). (B & C) Representative examples demonstrate the effect of perilymph osmolality on the cochlear microphonic quadratic distortion product. The stimulus was two primary tones (10 and 15 kHz) and the magnitude of the CM distortion product at 5 kHz was measured. After opening the cochlea, recording commenced. A single perfusion with either hypotonic or hypertonic artificial perilymph was performed. (B) There was a drop in the CM distortion product during hypotonic perilymph perfusion, but this is artifact related to the perfusion pressure (hatched area). Immediately after withdrawing the perfusion pipette, the magnitude of CM difference tone was noted to be larger than it was before hypotonic perfusion (arrow). Over time, the CM demonstrated recovery, presumably as the osmolality normalized spontaneously. (C) Conversely, hypertonic perilymph decreased the magnitude of the CM (arrow). It also recovered spontaneously.
CM Difference Tone Measurement
Although the low-frequency CM does not assess for changes in the cochlear amplifier, the quadratic difference tone of the CM (measured at f2−f1) is generated by nonlinearities associated with both the cochlear amplifier and mechanoelectrical transduction.19,20 We measured the amplitude of the quadratic difference tone of the CM at 5 kHz by FFT analysis using 10 and 15 kHz primary tones.
Immediately after opening the cochlea, the recording for the CM difference tone commenced. A single perfusion of hypotonic or hypertonic artificial perilymph was performed for 100 seconds, during which there was a drop in the CM. This artifact occurs because of the perfusion pressure and is unrelated to the osmolality of the artificial perilymph.13 Immediately after perfusion, the pipette was withdrawn and the change in the CM induced by the osmotic effect noted. Examples of the change in the quadratic distortion product in response to hypotonic and hypertonic perfusion are shown in Figures 5B, C. Hypotonic perilymph increased the magnitude of the CM difference tone by 12 ± 4 dB (n = 3, P < .05), whereas hypertonic perilymph decreased its magnitude by 11 ± 3 dB (n = 4, P < .05). The CM difference tone spontaneously recovered to preperfusion levels within 100 to 200 seconds, presumably as the perilymph osmolality normalized.
EP Measurements
A potential confounding factor is that perilymph osmolality may modulate blood flow through the stria vascularis and impact the endolymphatic potential. We tested for this by measuring the EP while perfusing the cochlea (Fig. 6). Before any perfusion was performed, the EP was 76.6 ± 1.3 mV. After perfusion with 260 mOsm/kg artificial perilymph, the EP was 77.0 ± 2.0 mV and after perfusion with 340 mOsm/kg artificial perilymph, the EP was 75.0 ± 2.2 mV. There were no statistically significant differences between these values (n = 5, P > .1).
Fig. 6.

Perilymph osmolality did not change the endolymphatic potential. In each animal, the endolymphatic potential was measured before perilymphatic perfusion, and after perfusion with hypotonic and hypertonic artificial perilymph (n = 5). The mean and SEM values of the EP are shown above the bar graph. There were no statistically significant differences between them (P > .1).
DISCUSSION
Herein we report that hypotonic perilymph potentiates and hypertonic perilymph reduces cochlear function. Our data support the hypothesis that perilymph osmolality modulates the gain of the cochlear amplifier. CAP threshold shifts were largest in the range of 10 to 16 kHz, and this frequency band has been found to have a significant cochlear amplifier activity at or near threshold in the guinea pig and chinchilla, compared with lower frequency regions of the cochlea at the apex.21–23 The changes in the cubic and quadratic distortion products associated with perilymph osmolality are also consistent with modulation of the cochlear amplifier. The reason that a statistically significant change in DPOAE threshold was not found by comparing average data at 260 and 340 mOsm/kg but was found when performing linear regression of the dose-response curve is likely because of the higher power of the latter analysis.
Improved CAP thresholds after cochlear perfusion with artificial perilymph have been previously reported,24 although no correlation with osmolality was made. However, there are two studies in the literature that conflict with our findings regarding the effect of serum osmolality on cochlear function. In rabbits, intravenous administration of glucose to increase serum osmolality led to a reduction of DPOAE amplitudes.25 Importantly, no assessment was done to determine whether a change in perilymph osmolality occurred with the manipulation. In another study performed in guinea pigs, intravenous administration of glycerol (to increase serum osmolality) or distilled water (to decrease serum osmolality) was found not to affect cochlear function.26 In this study, cochlear perfusion of hypertonic saline was also tested and found to slightly elevate low-frequency thresholds. However, the native thresholds in the frequency range where we found the largest effects in response to osmotic challenge (10 –16 kHz) were already elevated 40 to 50 dB from the process of surgically opening the cochlea. Thus, changes in the gain of the cochlear amplifier may not have been detectable in their study. Additionally, in the first study, the authors could not identify a change in cochlear blood flow with their methodology, and in the second cochlear blood flow was not assessed. However, others have reported that serum osmolality modulates cochlear blood flow and the EP, which can change cochlear function.27–29 In contrast, we directly changed the perilymph osmolality and demonstrated that the EP did not change during our manipulations.
One consideration when perfusing hypotonic or hypertonic perilymph in scala tympani is whether the pressure within scala media varies. This might shift the operating point of the hair cell stereocilia, changing the gain of mechanoelectrical transduction. This is unlikely to be the case in our experimental preparation as there was no effect of perilymph tonicity on the CM growth curves. Future work, such as detailed studies of the CM waveform with mathematical predictions of the stereociliary mechanoelectrical transduction response could be performed to verify this conclusion.18,20 However, it is doubtful that pressure changes could occur in scala media because Reissner’s membrane is not considered to act as a pressure barrier, and the two surgically created openings in the cochlea would help to dissipate any pressure gradients.
An additional way to distinguish between a change in the gain of the cochlear amplifier and a shift in the bias point of mechanoelectrical transduction is to compare changes in distortion products induced with two-tone stimuli. Previous reports have shown that changes in the stereociliary operating point cause the cubic and quadratic distortion tones to move in different directions.19,30 We investigated this possibility by comparing the changes in the cubic distortion product with DPOAEs and the quadratic distortion product with the CM. We show that the cubic and quadratic distortion products change in the same direction in response to osmotic challenge (i.e., both improve with hypotonic perilymph and both worsen with hypertonic perilymph). This further suggests that osmotic challenge modulates the cochlear amplifier rather than changing the operating point of mechanoelectrical transduction.
Another potential confounding factor is that extracellular fluid osmolality can modulate synaptic excitability.31 Effects on the cochlear afferent nerves may change CAP thresholds but would not be expected to change the nonlinearities responsible for the generation of the cubic and quadratic distortion products. However, efferent effects on the cochlear amplifier may play a role and cannot be ruled out.
Our findings are consistent with what would be expected based on the data from isolated OHCs. Electromotile force production reversibly increases with hypotonic challenge and decreases with hypertonic challenge. From the data of Hallworth,8 the slope of this effect can be calculated to be about 0.1 dB change in OHC somatic force production for every 1 mOsm/kg change in extracellular fluid osmolality. This is comparable to the slope of the osmotic effect on CAP thresholds that we measured (0.25 dB change in CAP threshold for every 1 mOsm/kg change in perilymph osmolality). The CAP threshold is more appropriate to use for comparison with data from isolated OHCs than the DPOAE threshold because it is more sensitive to modulation of the cochlear amplifier than DPOAEs.13,32,33 As further support of our hypothesis, caffeine has been shown to cause shortening of isolated OHCs consistent with an increase in their turgor pressure and caffeine also increases the gain of the cochlear amplifier when perfused in vivo.34,35
It should be noted that the concept that OHC turgor may modulate the cochlear amplifier in vivo has been proposed earlier based on changes in nonlinear capacitance and electromotility induced by directly modulating OHC intracellular pressure through a patch pipette.36,37 Additionally, OHC somatic electromotility is modulated by intracellular chloride ions that regulate prestin activity.38 It is plausible that the movement of free water in and out of the OHC during osmotic challenge is associated with the movement of chloride ions through stretch-sensitive nonselective channels in the OHC membrane.39 Thus, the changes in cochlear amplifier gain we measured may have occurred via changes in OHC chloride concentration.
Additionally, perilymph osmolality may modulate both somatic force production (electromotility) and stereociliary force production.40 One interesting possibility is that OHC turgor may modulate both types of force production by changing the tension within the plasma membrane. Certainly, the biophysical properties of the electromotility motor complex and the mechanoelectrical transduction channel are impacted by their surrounding membrane environment.41,42 Also, a static change in OHC turgor that affects cell stiffness may modulate the transmission of dynamic forces to the rest of the cochlear duct, even if dynamic force production (either somatic or stereociliary) is unchanged.
Modulating the gain of the cochlear amplifier by changing perilymph osmolality may have direct clinical relevance. Although the pathophysiology of Meniere disease is believed to be primarily related to endolymphatic hydrops, it is possible that turgor changes in OHCs may also play a role in modulating cochlear function. For example, the mechanism by which diuretics can alter hearing in Meniere disease may be related to their ability to modulate OHC turgor.
In the general population, sensorineural HL is a common disease and there are no effective treatments. Outer hair cell loss is the most common reason for age-related sensorineural HL. Hearing aid technology continues to improve, but they function basically to compress and amplify incoming sounds. A hearing aid cannot make up for loss of the cochlear amplifier because it cannot improve frequency discrimination. Drug therapy or inner ear dialysis designed to lower perilymph osmolality might increase force production by residual OHCs, turn up the gain of the cochlear amplifier, and improve hearing. Importantly, this might be expected to improve frequency selectivity and raise speech discrimination in the presence of background noise, the critical missing elements in these patients.
CONCLUSIONS
Perilymph osmolality can modulate cochlear function in a manner consistent with what would be expected if OHC turgor pressure changes the gain of the cochlear amplifier.
Acknowledgments
The authors thank William E. Brownell, Ruth Anne Eatock, Fred Pereira, Robert Raphael, Alexander Spector, and Gentiana Wenzel for helpful discussions. Artwork by Chris Gralapp. This research was supported by grants from American Academy of Audiology Foundation to C.-H.C. and grants from the National Organization for Hearing Research Foundation and NIDCD DC05131 and DC006671 to J.S.O.
BIBLIOGRAPHY
- 1.Oghalai JS. The cochlear amplifier: augmentation of the traveling wave within the inner ear. Curr Opin Otolaryngol Head Neck Surg. 2004;12:431– 438. doi: 10.1097/01.moo.0000134449.05454.82. [DOI] [PMC free article] [PubMed] [Google Scholar]
- 2.Davis H. An active process in cochlear mechanics. Hear Res. 1983;9:79–90. doi: 10.1016/0378-5955(83)90136-3. [DOI] [PubMed] [Google Scholar]
- 3.Brownell WE, Bader CR, Bertrand D, de Ribaupierre Y. Evoked mechanical responses of isolated cochlear outer hair cells. Science. 1985;227:194–196. doi: 10.1126/science.3966153. [DOI] [PubMed] [Google Scholar]
- 4.Brownell WE. Outer hair cell electromotility and otoacoustic emissions. Ear Hear. 1990;11:82–92. doi: 10.1097/00003446-199004000-00003. [DOI] [PMC free article] [PubMed] [Google Scholar]
- 5.Oghalai JS, Patel AA, Nakagawa T, Brownell WE. Fluorescence-imaged microdeformation of the outer hair cell lateral wall. J Neurosci. 1998;18:48–58. doi: 10.1523/JNEUROSCI.18-01-00048.1998. [DOI] [PMC free article] [PubMed] [Google Scholar]
- 6.Ratnanather JT, Zhi M, Brownell WE, Popel AS. The ratio of elastic moduli of cochlear outer hair cells derived from osmotic experiments. J Acoust Soc Am. 1996;99:1025–1028. doi: 10.1121/1.414631. [DOI] [PubMed] [Google Scholar]
- 7.Chertoff ME, Brownell WE. Characterization of cochlear outer hair cell turgor. Am J Physiol. 1994;266:C467–C479. doi: 10.1152/ajpcell.1994.266.2.C467. [DOI] [PubMed] [Google Scholar]
- 8.Hallworth R. Modulation of outer hair cell compliance and force by agents that affect hearing. Hear Res. 1997;114:204–212. doi: 10.1016/s0378-5955(97)00167-6. [DOI] [PubMed] [Google Scholar]
- 9.Ratnanather JT, Zhi M, Brownell WE, Popel AS. Measurements and a model of the outer hair cell hydraulic conductivity. Hear Res. 1996;96:33– 40. doi: 10.1016/0378-5955(96)00014-7. [DOI] [PubMed] [Google Scholar]
- 10.Crist JR, Fallon M, Bobbin RP. Volume regulation in cochlear outer hair cells. Hear Res. 1993;69:194–198. doi: 10.1016/0378-5955(93)90107-c. [DOI] [PubMed] [Google Scholar]
- 11.Oghalai JS, Zhao HB, Kutz JW, Brownell WE. Voltage- and tension-dependent lipid mobility in the outer hair cell plasma membrane. Science. 2000;287:658– 661. doi: 10.1126/science.287.5453.658. [DOI] [PMC free article] [PubMed] [Google Scholar]
- 12.Oghalai JS, Tran TD, Raphael RM, Nakagawa T, Brownell WE. Transverse and lateral mobility in outer hair cell lateral wall membranes. Hear Res. 1999;135:19–28. doi: 10.1016/s0378-5955(99)00077-5. [DOI] [PubMed] [Google Scholar]
- 13.Oghalai JS. Chlorpromazine inhibits cochlear function in guinea pigs. Hear Res. 2004;198:59– 68. doi: 10.1016/j.heares.2004.03.013. [DOI] [PubMed] [Google Scholar]
- 14.Wenzel GI, Anvari B, Mazhar A, Pikkula B, Oghalai JS. Laser-induced collagen remodeling and deposition within the basilar membrane of the mouse cochlea. J Biomed Opt. 2007;12:021007. doi: 10.1117/1.2714286. [DOI] [PMC free article] [PubMed] [Google Scholar]
- 15.Wenzel GI, Xia A, Funk E, et al. Helper-dependent adenovirus-mediated gene transfer into the adult mouse cochlea. Otol Neurotol. 2007;28:1100–1108. doi: 10.1097/MAO.0b013e318158973f. [DOI] [PubMed] [Google Scholar]
- 16.Xia A, Visosky AM, Cho JH, Tsai MJ, Pereira FA, Oghalai JS. Altered traveling wave propagation and reduced endocochlear potential associated with cochlear dysplasia in the BETA2/NeuroD1 null mouse. J Assoc Res Otolaryngol. 2007;8:447– 463. doi: 10.1007/s10162-007-0092-9. [DOI] [PMC free article] [PubMed] [Google Scholar]
- 17.Paylor R, Glaser B, Mupo A, et al. Tbx1 haploinsufficiency is linked to behavioral disorders in mice and humans: implications for 22q11 deletion syndrome. Proc Natl Acad Sci USA. 2006;103:7729–7734. doi: 10.1073/pnas.0600206103. [DOI] [PMC free article] [PubMed] [Google Scholar]
- 18.Patuzzi RB, Yates GK, Johnstone BM. The origin of the low-frequency microphonic in the first cochlear turn of guinea-pig. Hear Res. 1989;39:177–188. doi: 10.1016/0378-5955(89)90089-0. [DOI] [PubMed] [Google Scholar]
- 19.Frank G, Kossl M. Acoustical and electrical biasing of the cochlea partition. Effects on the acoustic two tone distortions f2−f1 and 2f1−f2. Hear Res. 1997;113:57– 68. doi: 10.1016/s0378-5955(97)00131-7. [DOI] [PubMed] [Google Scholar]
- 20.Patuzzi RBMA. Automatic monitoring of mechanoelectrical transduction in the guinea pig cochlea. Hear Res. 1998;125:1–16. doi: 10.1016/s0378-5955(98)00125-7. [DOI] [PubMed] [Google Scholar]
- 21.Robles L, Ruggero MA, Rich NC. Basilar membrane mechanics at the base of the chinchilla cochlea. I. Input-output functions, tuning curves, and response phases. J Acoust Soc Am. 1986;80:1364–1374. doi: 10.1121/1.394389. [DOI] [PubMed] [Google Scholar]
- 22.Cooper NP, Rhode WS. Nonlinear mechanics at the apex of the guinea-pig cochlea. Hear Res. 1995;82:225–243. doi: 10.1016/0378-5955(94)00180-x. [DOI] [PubMed] [Google Scholar]
- 23.Cooper NP, Rhode WS. Basilar membrane mechanics in the hook region of cat and guinea-pig cochleae: sharp tuning and nonlinearity in the absence of baseline position shifts. Hear Res. 1992;63:163–190. doi: 10.1016/0378-5955(92)90083-y. [DOI] [PubMed] [Google Scholar]
- 24.Bobbin RP, Ceasar G. Kynurenic acid and gamma-D-glutamylaminomethylsulfonic acid suppress the compound action potential of the auditory nerve. Hear Res. 1987;25:77– 81. doi: 10.1016/0378-5955(87)90081-5. [DOI] [PubMed] [Google Scholar]
- 25.Suckfull M, Winkler G, Thein E, Raab S, Schorn K, Mees K. Changes in serum osmolarity influence the function of outer hair cells. Acta Otolaryngol. 1999;119:316–321. doi: 10.1080/00016489950181314. [DOI] [PubMed] [Google Scholar]
- 26.Jefferis AF, Johnstone BM. Plasma osmolality variations and their effect on the hearing threshold of the guinea pig. J Laryngol Otol. 1987;101:236–244. doi: 10.1017/s0022215100101598. [DOI] [PubMed] [Google Scholar]
- 27.Noi O, Makimoto K. Comparative effects of glycerol and Urografin on cochlear blood flow and serum osmolarity. Hear Res. 1998;123:55– 60. doi: 10.1016/s0378-5955(98)00099-9. [DOI] [PubMed] [Google Scholar]
- 28.Ren T, Brown NJ, Zhang M, Nuttall AL, Miller JM. A reversible ischemia model in gerbil cochlea. Hear Res. 1995;92:30–37. doi: 10.1016/0378-5955(95)00192-1. [DOI] [PubMed] [Google Scholar]
- 29.Yamamoto H, Makimoto K. Sensitivity of the endocochlear potential level to cochlear blood flow during hypoventilation. Ann Otol, Rhinol Laryngol. 2000;109:945–951. doi: 10.1177/000348940010901008. [DOI] [PubMed] [Google Scholar]
- 30.Kirk DL, Patuzzi RB. Transient changes in cochlear potentials and DPOAEs after low-frequency tones: the ‘two-minute bounce’ revisited. Hear Res. 1997;112:49– 68. doi: 10.1016/s0378-5955(97)00105-6. [DOI] [PubMed] [Google Scholar]
- 31.Rosen AS, Andrew RD. Glucose concentration inversely alters neocortical slice excitability through an osmotic effect. Brain Res. 1991;555:58– 64. doi: 10.1016/0006-8993(91)90859-t. [DOI] [PubMed] [Google Scholar]
- 32.Puria S, Guinan JJ, Jr, Liberman MC. Olivocochlear reflex assays: effects of contralateral sound on compound action potentials versus ear-canal distortion products. J Acoust Soc Am. 1996;99:500–507. doi: 10.1121/1.414508. [DOI] [PubMed] [Google Scholar]
- 33.Kujawa SG, Liberman MC. Effects of olivocochlear feedback on distortion product otoacoustic emissions in guinea pig. J Assoc Res Otolaryngol. 2001;2:268–278. doi: 10.1007/s101620010047. [DOI] [PMC free article] [PubMed] [Google Scholar]
- 34.Bobbin RP. Caffeine and ryanodine demonstrate a role for the ryanodine receptor in the organ of Corti. Hear Res. 2002;174:172–182. doi: 10.1016/s0378-5955(02)00654-8. [DOI] [PubMed] [Google Scholar]
- 35.Skellett RA, Crist JR, Fallon M, Bobbin RP. Caffeine-induced shortening of isolated outer hair cells: an osmotic mechanism of action. Hear Res. 1995;87:41– 48. doi: 10.1016/0378-5955(95)00076-g. [DOI] [PubMed] [Google Scholar]
- 36.Kakehata S, Santos-Sacchi J. Membrane tension directly shifts voltage dependence of outer hair cell motility and associated gating charge. Biophys J. 1995;68:2190–2197. doi: 10.1016/S0006-3495(95)80401-7. [DOI] [PMC free article] [PubMed] [Google Scholar]
- 37.Iwasa KH, Chadwick RS. Elasticity and active force generation of cochlear outer hair cells. J Acoust Soc Am. 1992;92:3169–3173. doi: 10.1121/1.404194. [DOI] [PubMed] [Google Scholar]
- 38.Oliver D, He DZ, Klocker N, et al. Intracellular anions as the voltage sensor of prestin, the outer hair cell motor protein. Science. 2001;292:2340–2343. doi: 10.1126/science.1060939. [DOI] [PubMed] [Google Scholar]
- 39.Rybalchenko V, Santos-Sacchi J. Cl-flux through a non-selective, stretch-sensitive conductance influences the outer hair cell motor of the guinea-pig. J Physiol. 2003;547(Pt 3):873–891. doi: 10.1113/jphysiol.2002.036434. [DOI] [PMC free article] [PubMed] [Google Scholar]
- 40.Kennedy HJ, Crawford AC, Fettiplace R. Force generation by mammalian hair bundles supports a role in cochlear amplification. Nature. 2005;433:880– 883. doi: 10.1038/nature03367. [DOI] [PubMed] [Google Scholar]
- 41.Iwasa KH. Effect of stress on the membrane capacitance of the auditory outer hair cell. Biophys J. 1993;65:492– 498. doi: 10.1016/S0006-3495(93)81053-1. [DOI] [PMC free article] [PubMed] [Google Scholar]
- 42.Hirono M, Denis CS, Richardson GP, Gillespie PG. Hair cells require phosphatidylinositol 4,5-bisphosphate for mechanical transduction and adaptation. Neuron. 2004;44:309–320. doi: 10.1016/j.neuron.2004.09.020. [DOI] [PubMed] [Google Scholar]
- 43.Leake PA, Snyder RL. Uptake of horseradish peroxidase from perilymph by cochlear hair cells. Hear Res. 1987;25:153–171. doi: 10.1016/0378-5955(87)90088-8. [DOI] [PubMed] [Google Scholar]
- 44.Siegel JH, Brownell WE. Synaptic and Golgi membrane recycling in cochlear hair cells. J Neurocytol. 1986;15:311–328. doi: 10.1007/BF01611434. [DOI] [PubMed] [Google Scholar]