

Abstract
In this paper, we investigate the oscillatory dynamics of the tank-treading motion of healthy human erythrocytes in shear flows with capillary number Ca = O(1) and small to moderate viscosity ratios 0.01 ≤ λ ≤ 1.5. These conditions correspond to a wide range of surrounding medium viscosities (4 to 600 mPa s) and shear flow rates (2 to 560 s−1), and match those used in ektacytometry systems. For a given viscosity ratio, as the flow rate increases, the steady-state erythrocyte length L (in the shear plane) increases logarithmically while its depth W (normal to the shear plane) decreases logarithmically. In addition, the flow rate increase dampens the oscillatory erythrocyte inclination but not its lengths oscillations (which show relative variations of about 5–8%). For a given flow rate, as the viscosity ratio increases, the erythrocyte length L contracts while its depth W increases (i.e. the cell becomes less deformed) with small decrease in the lengths variations. The average orientation angle of the erythrocyte shows a significant decrease with the viscosity ratio as does the angle oscillation while the oscillation period increases. These trends continue in higher viscosity ratios resulting eventually in the transition from a (weakly oscillatory) tank-treading motion to a tumbling motion. Our computations show that the erythrocyte width S, which exists in the shear plane, is practically invariant in time, capillary number and viscosity ratio, and corresponds to a real cell thickness of about 2.5 μm. Comparison of our computational results with the predictions of (low degree-of-freedom) theoretical models and experimental findings, suggests that the energy dissipation due to the shape-memory effects is more significant than the energy dissipation due to the membrane viscosity. Our work shows that the oscillatory tank-treading motion can account for more than 50% of the variations found in ektacytometry systems; thus, researchers who wish to study inherent differences between erythrocytes within a population must devise a way of monitoring individual cells over time so that they can remove the oscillation effects.
1. INTRODUCTION
The flow dynamics of red blood cells has long been recognized as a fundamental problem in physiology and biomechanics owing to the main function of these cells to exchange oxygen and carbon dioxide with the tissues in blood capillaries [1, 2]. Since the seminal work of Fischer, Stöhr-Liesen and Schmid-Schönbein [3], it is known that the erythrocytes elongate and orient to an ellipsoidal-like shape while their membrane tank-treads around the cell when the cells are subjected to a moderate or strong shear flow in a more viscous suspending liquid. Recently, Abkarian, Faivre and Viallat [4], by employing a cell imaging method parallel to the shear plane, found that at low shear stress (μG ≈ 0.1 Pa) erythrocytes present an oscillation of their inclination (which they called swinging motion) superimposed to the long-observed steady tank-treading motion. Based on these experimental observations, Abkarian et al. [4] as well as Skotheim and Secomb [5] developed low degree-of-freedom theoretical models to describe the tank-treading, swinging and tumbling motion of non-spherical capsules, such as erythrocytes, in shear flows. The results of these two papers have motivated computational studies on the shear flow dynamics of non-spherical elastic capsules and erythrocytes, e.g. [6–9].
In this paper, we study further the oscillatory dynamics of the tank-treading motion of erythrocytes in moderate shear flows utilizing our non-stiff cytoskeleton-based continuum erythrocyte algorithm [10]. In particular, we considered shear flows with capillary number Ca = O(1) and small to moderate viscosity ratios 0.01 ≤ λ ≤ 1.5. These conditions correspond to a wide range of surrounding medium viscosities (4 to 600 mPa s) and shear flow rates (2 to 560 s−1), and match those used in ektacytometry systems [3, 11, 12]. We identify the effects of the shear flow and the viscosity ratio on the oscillatory tank-treading motion of erythrocytes including lengths and orientation variations. In addition, we compare our computational results with the predictions of the theoretical models of Keller and Skalak [13], Abkarian et al. [4], and Skotheim and Secomb [5], to provide further insight on their accuracy but also on the physics included in these models.
Our work also provides insight helpful in the biomedical area. In section 5, we study and provide further information and insight on properties measured in ektacytometry systems. We note that ektacytometry systems which measure the deformability of erythrocytes [3, 11, 12] are useful medical tools for studying the inherent differences between erythrocytes as well as several disorders or diseases [14]. In addition, our results on the influence of the viscosity ratio provide insight on the effects of the paraproteinemia, i.e. a family of disorders associated with elevated plasma protein levels and thus higher plasma viscosity [1].
2. PROBLEM DESCRIPTION AND COMPUTATIONAL ALGORITHM
A human erythrocyte is essentially a capsule (i.e. a membrane-enclosed fluid volume) where the liquid interior (cytoplasm) is a concentrated hemoglobin solution that behaves as a Newtonian fluid with viscosity μc ≈ 6–10 mPa s [15, 16]. The erythrocyte membrane is a complex multi-layered object consisting of a lipid bilayer (which is essentially a two-dimensional incompressible fluid with no shear resistance [1]) and an underlying elastic network of spectrin (which exhibits shear resistance like a two-dimensional elastic solid [17]). Measurements through micro-pipette aspiration and optical tweezers as well as applications of different models have found the membrane shear modulus to vary in the range Gs = 1–13 μN/m [18].
In healthy blood and in the absence of flow, the average human erythrocyte assumes a biconcave discoid shape of surface area Sc = 135 μm2, with a diameter of 7.8 μm and a thickness varying in 0.8 – 2.6 μm at physiological osmolarity, resulting in a volume of Vc = 94 μm3 [1, 19]. Working with experimental observations from interference microscopy, Evans and Fung [19] gave the following empirical equation to describe the half-thickness f(r) as a function of the radial distance r from the central axis of symmetry
| (1) |
At physiological osmolarity (300 mO), R0 = 3.91 μm, C0 = 0.81 μm, C2 = 7.83 μm, and C4 = −4.39 μm. In our computations, this shape is employed as the elastic reference shape (i.e. the shape of the erythrocyte under quiescent conditions), in agreement with experimental findings which have demonstrated the erythrocyte shape memory, i.e. the fact that after tank-treading an erythrocyte will always reform its two dimples in the same distinct loci on the membrane [20].
To describe the erythrocyte dynamics in a simple shear flow u∞ = G (z, 0, 0) (where G is the shear rate) in the Stokes regime, we utilize our recently developed non-stiff cytoskeleton-based continuum erythrocyte modeling [10] and our interfacial spectral boundary element algorithm for membranes [21, 22]. Here we present a concise description of our method; more details may be found in the aforementioned references.
Our membrane description is based on the well-established continuum approach and the theory of thin shells while to describe the tensions on the erythrocyte membrane we employ the Skalak et al. constitutive law [23] which accounts for both shearing and area-dilatation resistance. The problem's dimensionless parameters include the (elastic) capillary number Ca = μGa/Gs (i.e. the ratio of viscous forces in the surrounding fluid to shearing forces in the membrane), and the viscosity ratio λ = μc/μ. Here Gs is the membrane shear modulus, μ the viscosity of the surrounding liquid, and a the radius of a sphere with the same volume as the erythrocyte (i.e. a = 2.8 μm at physiological osmolarity).
We emphasize that the state-of-the-art continuum-based computational algorithms focus on the lipid bilayer where they enforce local area-incompressibility via a large area-dilatation modulus; this results in a stiff problem and thus a high computational cost especially for three-dimensional investigations [7, 24, 25]. To overcome this obstacle, we have developed a cytoskeleton-based continuum erythrocyte algorithm which accounts for the global area-incompressibility of the spectrin skeleton (being enclosed beneath the lipid bilayer in the erythrocyte membrane) via a non-stiff, and thus efficient, adaptive pre-stress procedure [10].
The numerical solution of the interfacial problem is achieved through our interfacial spectral boundary element algorithm for membranes [21, 22]. The initial biconcave discoid interface is divided into a moderate number NE of elements (e.g. see figure 1); on each element all geometric and physical variables are discretized using (NB − 1)-order Lagrangian interpolation based on the zeros of orthogonal polynomials. The accuracy of our results was verified by employed smaller time steps and different grid densities for several representative cases. (In particular, we employed NE = 10 spectral elements with NB = 11 – 14 basis points; for the time integration we employed the 4th-order Runge-Kutta scheme with time step in the range Δt = 0.5 × 10⁻⁴ – 0.5 × 10⁻³.) These convergence runs showed that the interfacial shape was determined with a maximum relative error of 3 × 10⁻³ in all cases studied.
FIG. 1.

Shape transition from a biconcave disc to an ellipsoid for an erythrocyte in a simple shear flow for capillary number Ca = 1.5 and viscosity ratio λ = 0.1. The erythrocyte shape is plotted row-wise at times t = 0, 0.2, 0.4, 0.6, 1, 2 as seen slightly askew from the shear (i.e. xz) plane.
We note that our cytoskeleton-based continuum erythrocyte modeling is general and thus able to describe any type of erythrocyte flow dynamics. However, in the present study our results are restricted owing to numerical instabilities associated with membrane buckling. (The buckling instability for shear flows is discussed in section 4 in Ref.[26].) Thus in this study we present results for Ca = 1.25–2.15 and viscosity ratios 0.01 ≤ λ ≤ 1.5. We emphasize that these conditions correspond to a wide range of surrounding medium viscosities (4 to 600 mPa s) and shear flow rates (2 to 560 s−1), and match those used in ektacytometry systems, e.g. as shown in figures 4 and 5 in our earlier study [10] where we compare our computational results with ektacytometry findings [3, 12].
FIG. 4.

(a) The average value at steady state of the erythrocyte semi-lengths L, W and S versus the capillary number Ca in a linear-log plot for viscosity ratio λ = 0.1. (b) The amplitude of the semi-lengths oscillations ΔL = Lmax − Lmin, ΔW = Wmax − Wmin and ΔS = Smax − Smin versus Ca in a linear-log plot for λ = 0.1. Also shown is the variation with the capillary number of the average erythrocyte deformation D in (a) and its amplitude ΔD = Dmax − Dmin in (b) at steady state.
FIG. 5.

The maximum Φmax, minimum Φmin and time-average Φ orientation angles (left y-axis) as well as the amplitude of the angle oscillations ΔΦ = Φmax−Φmin (right y-axis) at steady-state versus the capillary number Ca for viscosity ratio λ = 0.1.
It is of interest to note that our computations do not account for the membrane viscosity which is O(10−7)Ns/m [27, 28]. Incorporation of the membrane viscosity raises additional questions on the surface viscosity model appropriate for the erythrocyte membrane as well as on the way (linear or more generally non-linear) a surface viscosity model should be added to the membrane stresses. Because of this, we do not consider explicitly in our computational model the viscosity of the erythrocyte membrane, as earlier continuum models have also done [5, 7, 24, 25].
3. TANK-TREADING MOTION OF ERYTHROCYTES IN STRONG SHEAR FLOWS
In this paper we investigate computationally the erythrocyte dynamics in a simple shear flow u∞ = G(z, 0, 0) for high capillary numbers Ca = O(1) and small to moderate viscosity ratios 0.01 ≤ λ ≤ 1.5. These conditions correspond to a wide range of medium viscosities (4 to 600 mPa s) and shear flow rates (2 to 560 s−1), and match those used in ektacytometry systems [3, 11, 12]. The Reynolds number for both the surrounding and the cytoplasm flows is always negligible owing to the cell's small size.
At the flow initiation, the erythrocyte has its equilibrium biconcave discoid shape at physiological osmolarity given by Eq.(1). In addition, the initial position of the undeformed geometry is at an orientation angle Φ = 20° with the flow direction, i.e. the x-axis. All reported times are scaled with the flow time scale G−1.
It is of interest to note that our computations depend only on two dimensionless parameters, the capillary numbers Ca and the viscosity ratio λ. In order to associate our results with actual variables (e.g. surrounding medium viscosity and shear flow rate), we use μc = 6 mPa s, a = 2.8 μm as well as the average value of the membrane shear modulus found by optical tweezers at low strains, Gs = 2.5 μN/m [29], since our computations involve rather small and moderate deformations. (In our work the cell dimensions vary in the range −20% to 40%.) Employing smaller or higher values of Gs does not change our results but associate our computations with smaller or higher, respectively, shear rates.
After an initial transient period, the erythrocyte assumes an inclined ellipsoidal conformation owing to the shear flow while its membrane tank-treads around the cell owing to the rotational component of the shear flow, as found in experimental systems, e.g. [3, 12, 30]. The erythrocyte semi-axes (i.e. length L, width S and depth W) are calculated as the semi-axes of the ellipsoid which has the same inertia tensor as that of the erythrocyte [22]. In addition, we monitor the cell deformation in the plane of shear defined as D = (L − S)/(L + S) as well as its orientation angle Φ defined as the angle between the longest semi-axis L and the flow direction, i.e. the x-axis. (Note that in this work the orientation angle Φ is reported in degrees.)
A. Oscillatory Tank-Treading Motion
The transition from a biconcave disc to an ellipsoidal shape for capillary number Ca = 1.5 and viscosity ratio λ = 0.1 happens from t = 0 to t = 2 as illustrated in figures 1 and 2. In addition, owing to the rotational component of the shear flow, the erythrocyte membrane tank-treads. However, unlike the case of capsules with a spherical reference shape, the biconcave reference shape introduces periodic oscillations into the tensions produced as the deformed erythrocyte tank-treads, i.e. the dimple regions of the original biconcave geometry deform differently than the edge regions as they pass around the surface contour [4, 5]. Thus, at steady-state, the lengths L and W of the deformed erythrocyte oscillate as shown in figure 2(a). However, after an initial transient period, its width S exhibits minimal oscillation, remaining essentially fixed in time.
FIG. 2.

An erythrocyte in a simple shear flow for capillary number Ca = 1.5 and viscosity ratio λ = 0.1. (a) The erythrocyte's length L and depth W oscillate over time while its width S attains a steady-state value and exhibits almost no oscillation. Also shown is the oscillatory behavior of the erythrocyte deformation D. (b) The orientation angle Φ oscillates over time.
In figure 2(a) we also plot the erythrocyte deformation D in the plane of shear which shows a similar oscillatory behavior with the erythrocyte length L. It is of interest to note that the amplitude of oscillations for D is much smaller than that for L owing to its definition, i.e. D = (L−S)/(L+S), and the cell's small width S. Thus, the oscillatory behavior of the erythrocyte shape is better revealed via monitoring the cell lengths L and W, rather than the deformation parameter D.
As seen in figure 2(b), the cell inclination Φ oscillates around a mean value. The period Posc for the lengths and angle oscillations is the same, but there is a phase lag. As shown in figure 2 for Ca = 1.5 and λ = 0.1, the oscillatory period for both oscillations is GPosc = 8.4 while the time lag between two successive peaks for lengths and angle oscillations is GΔPosc = 2.1, giving a phase lag of π/2 (or 90°) between the angle and lengths oscillations. This phase lag was also identified experimentally by Walter et al. for capsules with small deviations from sphericity [31]. Thus, the 90° phase lag reflects, in general, the deformation dynamics of capsules with nonspherical reference shape.
By employing a cell imaging method parallel to the shear plane, Abkarian et al. [4] observed the oscillatory inclination of the erythrocyte at low flow rates which they called swinging motion; as shown in their figure 1 the cell rocks back and forth between the maximum and minimum orientation angle. It is of interest to note that Abkarian et al. did not observe the lengths oscillations (or local details of the interfacial shape) probably due to insufficient resolution. Our computations reveal more details of this oscillatory motion. In figure 3(a, b) we present the cross-section in the shear plane for the deformed shape. Because of the phase lag between length and angle oscillations, the edge of the interfacial geometry traces an approximately circular path as shown in figure 3(b).
FIG. 3.

An erythrocyte in a simple shear flow for capillary number Ca = 1.5 and viscosity ratio λ = 0.1. (a) Cross-sections in the shear plane at times t = 13 ( ), 15 (– – –), 17 (- - -), and 19 (– · –) representing one period of oscillation. (By t = 21.5, not shown, the cross-section matches t = 13 again.) (b) The delineated region from (a) magnified. The arrow indicates the direction of motion for the edge of the cross sections. (c) The erythrocyte shape shown clockwise at the same times as in (a) illustrates that the swinging period corresponds to one-half of the tank-treading period.
Figure 3(c) shows three-dimensional images for the same times as in figure 3(a, b). It is apparent from the spectral grid that a membrane point moves halfway around the cell surface during one complete length or angle oscillation; i.e. the oscillation period for the lengths and the inclination angle corresponds to one-half of the tank-treading period (owing to the symmetry of the biconcave reference shape), as experimentically found recently for erythrocytes in weak shear flows [4].
B. Effects of the Flow Strength
In ektacytometry systems, the deformation parameter Dxy has been found to increase logarithmically with the capillary number in moderate and strong flow rates, e.g. [11]. (More about the ektacytometry deformation Dxy is presented in section 5 A.) However, because the deformed erythrocyte is observed only from above the shear plate device, i.e. the erythrocyte is seen as its elliptical projection on the xy-plane [3, 11, 12], this gives only limited information about how the actual three-dimensional shape changes with the flow rate. The same is true for experimental devices observed the cells parallel to the shear plane [4]. Therefore, our computations can address this shortcoming of the experimental techniques, by providing results for the three-dimensional erythrocyte deformation.
Figure 4(a) shows the semi-lengths of the erythrocyte averaged over time at steady state as a function of capillary number. Like the behavior observed for the ektacytometry deformation Dxy, the lengths change logarithmically over this range of capillary numbers. The erythrocyte length L increases with the capillary number as expected since the shear flow extends the cell; its depth W decreases with the flow rate while almost no change is observed in the cell width S. (Note that L and S lie on the shear plane while W is perpendicular to this plane.)
In addition, we have determined the amplitude of the semi-lengths oscillations as a function of the flow rate Ca. As shown in figure 4(b), the length variation ΔL increases logarithmically with the flow rate; however the variation of the cell's width and depth is practically constant in the range of capillary numbers studied in the present work. It is of interest to note that our computations reveal a relative variation for the erythrocyte dimensions ΔL/L ≈ ±6% and ΔW/W ≈ ±8% which is in agreement with experimental observations. As pointed out in the computational work of Sui et al. [7], the experimental observations of Fischer, Stöhr-Liesen and Schmid-Schönbein [3] show that the erythrocyte length varies with an amplitude of about 5%.
The maximum, time-average and minimum orientation angles of the erythrocyte at steady state decrease slightly with the flow rate as shown in figure 5. In addition, the angle variation also decreases with the capillary number, as shown in the same figure. Therefore, our results for the lengths and angle oscillations plotted in figures 4(b) and 5 reveal that increasing the flow rate appears to dampen the oscillatory erythrocyte inclination but not its lengths oscillations.
We note that our conclusions for the effects of the flow strength is not valid only for λ = 0.1 presented in this section but for all viscosity ratios studied in this work, e.g. 0.01 ≤ λ ≤ 1.5.
As mentioned earlier, Sui et al. [7] studied computationally the oscillatory tank-treading and tumbling motion of erythrocytes in shear flows with Ca = O(1) utilizing an immersed boundary/lattice Boltzmann method which is restricted to unity viscosity ratio. The earlier study is valid for Reynolds number 0.1 (i.e. not exactly at the Stokes-flow limit) and considers an erythrocyte between two parallel solid plates with periodic boundary conditions in the flow and lateral directions. We note that our results are in good agreement with the computations of the earlier study. Sui et al. [7] reported very similar oscillatory variation of the erythrocyte lengths and inclination as in our figure 2. However, they did not investigate the phase lag effects on the erythrocyte edges shown here in figure 3 or the logarithmic change with the flow rate of the cell lengths and lengths variation shown in our figure 4.
C. Effects of the Viscosity Ratio
We investigate now the effects of the viscosity ratio λ on the steady-state properties of the erythrocytes. The average lengths of the erythrocyte, plotted in figure 6(a), show that, at constant flow rate, the cell becomes less deformed as the viscosity ratio increases. That is, when λ increases, the erythrocyte length L contracts and its depth W grows. As in the case of increasing capillary number, the cell width S appears practically constant with viscosity ratio. The increase of the viscosity ratio also results in a considerable decrease of the length variation ΔL and a smaller decrease of the depth variation ΔW as seen in figure 6(b); on the other hand the variation of the cell width ΔS is always very small and practically independent of the viscosity ratio. It is of interest to note that for the highest viscosity ratio studied (i.e. λ = 1.5), the relative variations of the erythrocyte dimensions have decreased (compared to those for λ = 0.1 presented earlier) to ΔL/L ≈ ±5% and ΔW/W ≈ ±6%.
FIG. 6.

(a) The average value at steady state of the erythrocyte semi-lengths, L, W and S, as a function of the viscosity ratio λ for capillary number Ca = 2 and λ in the range [0.01, 1.5]. (b) The amplitude of the semi-lengths oscillations ΔL = Lmax − Lmin, ΔW = Wmax − Wmin and ΔS = Smax − Smin at steady state versus λ for Ca = 2. Also shown is the variation with the viscosity ratio of the average erythrocyte deformation D in (a) and its amplitude ΔD = Dmax − Dmin in (b) at steady state.
The average orientation angle Φ decreases with the viscosity ratio, as shown in figure 7(a), and the extent of the decrease is much greater than that observed with increasing capillary number over the range of flow rates shown in figure 5. Increasing the viscosity ratio also dampens the angle oscillation, or swinging motion, as seen in figure 7(b). The overall effect of increasing the viscosity ratio λ is thus to bring the ellipsoid in the shear plane closer and closer to the horizontal orientation, i.e. the flow direction.
FIG. 7.

(a) The time-average orientation angle Φ at steady state as a function of the viscosity ratio Φ for capillary number Ca = 1.5, 2, 2.5 and Φ in the range [0.01, 1.5]. (b) As in (a) but for the amplitude of the angle oscillations ΔΦ = Φmax−Φmin.
Therefore, our results provide further insight on the well-known transition of the erythrocytes from tank-treading to tumbling at high enough viscosity ratios, e.g. [5, 13, 32]. As shown in figure 8(a), by increasing the viscosity ratio from λ = 0.1 to λ = 1, decreases the average inclination angle, dampens the angle oscillation, and increases the oscillation period. Examining the initial behavior of the orientation angle for higher viscosity ratios shown in figure 8(b), these trends continue eventually resulting in the transition from a (weakly oscillatory) tank-treading motion to a tumbling motion which appears to be well established at λ = 5. (We note that further computational investigation of the erythrocyte's tumbling motion is currently restricted owing to buckling instability discussed in section 2.)
FIG. 8.

Time evolution of the orientation angle Φ for an erythrocyte in a simple shear flow for capillary number Ca = 2. (a) Our results shown for λ = 0.1 and λ = 1 illustrate that by increasing the viscosity ratio decreases the average angle, dampens the oscillation, and increases the oscillation period. (b) By increasing further the viscosity ratio, the trends found in (a) continue, eventually resulting in the transition from oscillatory tank-treading to tumbling.
It is of interest to note that (simplified) two-dimensional computational models have been developed which capture the tank-treading and tumbling motion of erythrocytes, including the reduction of the cell's orientation angle Φ with the viscosity ratio λ [32–34], and the reduction of the amplitude of the angle oscillations ΔΦ with the flow rate Ca [34]. However, we note that the increase of the time-average orientation angle Φ with the flow rate during tank-treading shown in figure 4 in the two-dimensional study of Tsubota and Wada [34] contradicts with the three-dimensional computations of the present study and of Sui et al. [7] which found the opposite behavior.
4. COMPARISON WITH ERYTHROCYTE MODELS
Theoretical models have been developed to describe and explain the tank-treading, swinging and tumbling motion of erythrocytes (and other ellipsoidal particles) in shear flows [4, 5, 13]. These models restrict the number of degrees of freedom to a few necessary to describe the basic particle motion and thus do not solve the entire (non-linear) dynamics problem in shear flows.
The model of Keller and Skalak [13] treats the erythrocyte as an ellipsoidal capsule of fixed shape and is able to describe the (steady) tank-treading and tumbling motion as well as the tank-treading-to-tumbling transition as the viscosity ratio increases. The subsequent models of Skotheim and Secomb [5], and Abkarian et al. [4] take into account the shape-memory effects of capsules with non-spherically symmetric quiescent shapes (such as that of the erythrocyte). These models are able to also describe the shear rate effects on the tank-treading-to-tumbling transition.
The model of Keller and Skalak has received a lot of attention in the last three decades; comparisons with experimental observations have showed that this model predicts qualitatively only the viscosity effects on the erythrocyte motion [13]. By contrast, currently no comparisons with experimental or computational results on erythrocytes exist for the other two (recent) models [4, 5] to find their accuracy in predicting the erythrocyte basic motion. The only exception we are aware of is the work of Abkarian et al. [4] itself where the authors compared their model predictions with their experimental results for erythrocytes in weak shear flows (where the cell appears like an oblate biconcave disc/spheroid). Abkarian et al. were able to quantitatively predict experimental findings (such as the cell's orientation angle and tank-treading frequency) but they had to use unrealistic values of erythrocyte's physical properties, i.e. values of the membrane's shear modulus Gs two to three orders of magnitude smaller than the real one (i.e. the average value of the shear modulus corresponding to a population of cells).
It is of interest to note that Bagchi and Kalluri [9] compared their computational results on the oscillatory inclination of initially oblate elastic capsules in weak and moderate shear flows with the predictions of the Keller and Skalak, and Skotheim and Secomb models. However, Bagchi and Kalluri utilized as input parameters in these two models the initial capsule shape (and not its deformed shape at the oscillatory steady state). This probably increased the disagreement of the models predictions with the computational results since the shape deformation plays a significant role in the inclination dynamics [9].
Therefore, in this section we compare our computational results with the predictions of the theoretical models [4, 5, 13] to provide further insight on their accuracy but also on the physics included in these models for the oscillatory tank-treading motion of erythrocytes.
To solve these models for a given capillary number Ca and viscosity ratio λ, we employed the ratios of the average erythrocyte dimensions at steady-state, S/L and W/L, from our computational results. (Note that these length ratios are input parameters in the models [4, 5, 13]; for real erythrocytes this information can be approximately determined from ektacytometry data [11, 28].) In addition, for the model of Skotheim and Secomb [5], to determine the ratio of the change in the elastic energy to the work done by the external fluid during one rotation, Ue, we employed an elastic energy change E0 = 10−17J as estimated in Ref.[5], and the erythrocyte's average physical properties (i.e. cell volume Vc = 94 μm3, characteristic radius a = 2.8 μm and membrane shear modulus Gs = 2.5 μN/m).
Figure 9 shows the comparison of our computational results with those from the models of Keller and Skalak (KS), and Skotheim and Secomb (SS) for capillary number Ca = 1.5 and viscosity ratio λ in the range [0.01, 1.5]. As seen in figure 9(a), both models predict qualitatively the correct dependence of the average orientation angle Φ with the viscosity ratio while the models disagreement with our computations increases with the viscosity ratio. It is of interest to note that the incorporation of the shape-memory effects in the SS model does not improve its predictions on the erythrocyte orientation; thus the cell average orientation is still determined by the original physics included in the KS model.
FIG. 9.
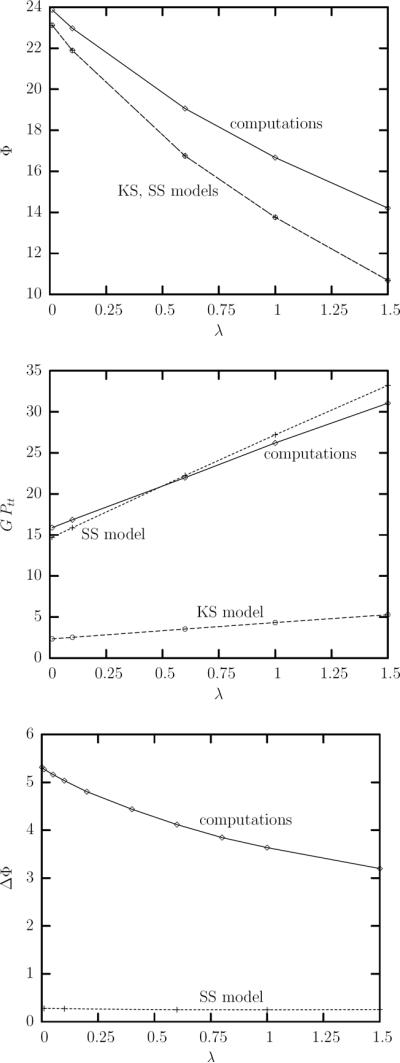
Comparison of our computational results with the predictions of the models by Keller and Skalak (KS), and Skotheim and Secomb (SS). (a) The time-average orientation angle at steady state as a function of the viscosity ratio for capillary number Ca = 1.5 and λ in the range [0.01, 1.5]. (b) As in (a) but for the tank-treading period Ptt (multiplied with the shear rate G). (c) As in (a) but for the amplitude of the angle oscillations ΔΦ = Φmax − Φmin.
Comparing our computational results with the models prediction for the erythrocyte tank-treading period Ptt in figure 9(b), we found that the KS model underestimates significantly the tank-treading period while the predictions of the SS model are quite accurate. Thus, the shape-memory effects included in the SS model are important for the accurate determination of the tank-treading speed. In particular, the shape memory coupled with the shearing resistance of the erythrocyte membrane reduces significantly (i.e. by a factor of 5–6) the tank-treading speed compared to a similar ellipsoidal capsule with a spherical equilibrium shape.
Figure 9(c) shows that in the parameter range studied in this work (i.e. Ca = O(1) and small to moderate λ), the SS model underpredicts significantly the amplitude of the angle oscillations ΔΦ. (Note that the KS model always predicts zero oscillations). This underprediction cannot be improved by explicitly considering the steady-state oscillatory variation of the erythrocyte lengths in the SS model since the model predicts an angle variation ΔΦ almost independent of the viscosity ratio (which does affect the erythrocyte lengths as shown in figure 6(a)). Therefore, a more detailed physical model is needed for the accurate determination of the oscillatory erythrocyte inclination.
Comparing our computational results with those from the model of Abkarian et al. (AFV) [4] we found that, the AFV model predicts erroneously a tumbling motion when we employed realistic values of the erythrocyte properties. (In particular, we used a characteristic radius a = 2.8 μm, membrane shear modulus Gs = 2.5 μN/m, cytoplasm viscosity μc = 6 mPa s as well as a membrane viscosity μm = 1 Pa s and membrane thickness hm = 50 nm as proposed in the AFV model [4].) We believe that this erroneous prediction results from the model's overpredictiction of the effects of the membrane viscosity and especially of the shape memory.
To explain our conclusion, we note that the KS and SS models as well as our computational algorithm do not consider explicitly the viscosity of the erythrocyte membrane. However, one can account indirectly for the effects of the membrane viscosity by considering λ to be an “effective” viscosity ratio that includes the membrane viscosity. As discussed in Ref.[5], the dissipation due to the membrane viscosity has been estimated to be between 2 and 4 times the dissipation in the cytoplasm [27, 28]; thus one may choose λ = 4 μc/μ which corresponds to a membrane dissipation equal to 3 times the dissipation in the cytoplasm. On the other hand, the AFV model considers explicitly the membrane viscosity μm and has modified the viscosity term f2−f1 (where f2 and f1 are geometric constants) appearing in the KS and SS models to be, in our notation, f2−μc/μ f1(1+μm Schm/(μc Vc). Using Sc = 135 μm2, Vc = 94 μm3, μc = 6 mPa s and hm = 50 nm, results in an effective viscosity ratio for the AFV model of λ ≈ 13 μc/μ significantly higher than the earlier estimations [27, 28].
However, even when we neglect the effects of the membrane viscosity in the AFV model (by setting μm = 0), the model still predicts erroneously a tumbling motion (in the parameter range considered in this work) owing to its overprediction of the shape-memory effects. To explain this observe that, matching the shape-memory term appearing in the SS and AFV models results in an elastic energy charge for the AFV model E0 = 0.5f1 Sc Gs. Using Sc = 135 μm2, Gs = 2.5 μN/m and considering that f1 = (S/L − L/S)2 takes on values f1 ≈ 14 – 16 in the parameter range studied in this work (but also for a biconcave erythrocyte), we obtain that for the AFV model E0 ≈ (235 – 270) × 10−17J, i.e. a much higher estimation than E0 = 10−17J proposed by Skotheim and Secomb [5]. Based on the success of the SS model in predicting the tank-treading period shown in figure 9(b), we are more prone to accept the shape-memory treatment/estimation of the SS model.
5. APPLICATIONS
A. Ektacytometry Deformation
Ektacytometry systems have been developed to measure the deformability of the erythrocyte by observing the deformation behavior of individual cells, or average deformabilities for populations of cells [3, 11, 12]. In these devices the flow pattern is a simple shear flow (or a good approximation of) while the deformed erythrocyte is not observed in the plane of shear but from above the shear plate device. In our computations, u∞ = G(z, 0, 0) and thus the plane of shear is the xz-plane. In our terminology, we can say that ektacytometry observes the deformed erythrocyte projected as an ellipse on the xy-plane. The deformation parameter computed from the largest and smallest semi-axes of this ellipse, Lx and Ly respectively, and reported by researchers using ektacytometry, we will denote Dxy. Note that Dxy = (Lx − Ly)/(Lx + Ly) while Lx = L cosΦ and Ly = W when the erythrocyte shape is a perfect ellipsoid. Since ektacytometry does not follow individual cells over time but uses a large number of them, and since the erythrocytes' shape oscillates with time in a shear flow, the experimentically reported deformation Dxy corresponds to the average value of the cells deformation in the xy-plane over time and over the erythrocyte population.
Figure 10(a) shows our computational results for the time-averaged deformation Dxy at steady-state for a range of high capillary numbers and for viscosity ratio λ = 0.01, 0.1, 0.2, 1. This figure also includes the experimental findings reported in figure 3 of Hardeman et al. [11]. Note that the viscosity ratio for ektacytometry systems usually ranges between 0.1 and 0.2 while the reported experimental measurements via the LORCA ektacytometer have negligible standard deviation [11]. The experimental findings were converted to the capillary number domain using Gs = 3.3, 2.4, 1.7 μN/m, i.e. we used the range of membrane shear modulus Gs = 1.7–3.3 μN/m valid for most red blood cells at low strains [29], since ektacytometry systems as well as our computations involve rather small and moderate deformations. (In our work the cell dimensions vary in the range −20% to 40%.) When we convert the experimental data using Gs = 2.4 μN/m, they coincide with the computational curves for low viscosity ratio which may suggest that the sample used in the experimental measurement had a shear modulus very close to the average value found by optical tweezers at low strains, Gs = 2.5 μN/m [29].
FIG. 10.

(a) The average value at steady state of the ektacytometry deformation Dxy versus the capillary number Ca from our computational results (solid lines) in a linear-log plot for viscosity ratio λ = 0.01, 0.1, 0.2, 1. (b) As in (a) but for the projection semi-lengths Lx and Ly. Also included in (a) the experimental findings (dashed lines) reported in figure 3 of Hardeman et al. [11] which have been converted to the capillary number domain using Gs = 3.3, 2.4, 1.7 μN/m.
Figure 10(a) shows that for a given viscosity ratio λ, the ektacytometry deformation Dxy increases logarithmically with the capillary number Ca in excellent agreement with experimental findings [11, 30]. This figure also reveals that low viscosity ratios do not affect much the dependence of Dxy on the flow rate Ca. For low viscosity ratios used in the ektacytometry systems, using a log-scale for capillary number, our computations produce a slope consistent with the experimental results [11]. On the other hand, as the viscosity ratio increases to moderate values, e.g. λ = 1, for a given flow rate the cell deformation decreases. It is of interest to note that for moderate viscosity ratios, Dxy still increases logarithmically with the capillary number, but the slope of the dependence is lower.
The large decrease of the ektacytometry deformation Dxy as the viscosity ratio increases from low to moderate values, reported in our figure 10(a), is in agreement with the experimental findings of Mohandas et al. [30] shown in their figure 2 where a similar deformation decrease was found when the viscosity of the surrounding liquid decreased from μ = 33.5 mPa s to μ = 11.7mPa s. We emphasize that the effects of the viscosity ratio on the ektacytometry deformation is consistent with that observed for elastic capsules in shear flows [35].
The effects of flow rate Ca and viscosity ratio λ on the ektacytometry deformation Dxy result from the similar effects of these two parameters on the projection semi-lengths Lx and Ly, as shown in figure 10(b). For a given flow rate, the large decrease of Dxy, when the viscosity ratio increases from low to moderate values, results from the associated decrease of Lx and increase of Ly. In addition, our computations reveal a relative variation for the erythrocyte projection semi-lengths ΔLx/Lx ≤ ±8% and ΔLy/Ly ≤ ±6% owing to the oscillatory motion, for all viscosity ratios and flow rates studied in this work (not shown).
B. The Deformability Distribution
The deformability distribution within a population of erythrocytes is useful for studying the inherent differences between erythrocytes as well as several disorders or diseases since even small fractions of less deformable or rigid cells can cause circulatory problems [14]. To do this efficiently, Dobbe et al. [14] designed an automated rheoscope that uses image analysis techniques to determine the erythrocyte deformability distribution by analyzing a large number of cells in shear flow. Note that they retain the geometric orientation of ektacytometry, i.e. they still view the erythrocyte as an ellipse projected on the xy-plane. The viscosity ratio they used and the mean deformabilities they observed are consistent with ektacytometry [11]. Dobbe et al. designed their experiments so that they can capture data about individual erythrocytes within a population, but they do not monitor individual cells over time. They compiled their results to produce deformability distributions for different shear stresses.
Dobbe et al. attributed the range of deformabilities they found to inherent differences among the cells themselves. While these differences may exist, we have already shown that the deformation for a single cell in shear flow oscillates over time. Dobbe et al. observed many cells, but they did not follow individual cells over time. Thus, some of the variation they observed should be due to the oscillatory deformation behavior. To examine this contribution, we display in table I the amplitude of the deformation Dxy from our computations (determined as maximum minus minimum Dxy) for viscosity ratio λ = 0.1 and several flow rates. The amplitude is essentially constant over this set of capillary numbers.
TABLE I.
The amplitude of the ektacytometry deformation Dxy (determined as maximum minus minimum Dxy from our computations at steady state) for viscosity ratio λ = 0.1 and several capillary numbers Ca. Also shown is Dxy amplitude computed from Table 3 in Dobbe et al. [14], using 2.576 standard deviations around the mean value (which includes 99% of the entire set of the experimental values).
| Capillary Number Ca | Dxy Amplitude |
|---|---|
| 1.25 | 0.127 |
| 1.50 | 0.128 |
| 1.75 | 0.128 |
| 2.00 | 0.127 |
| 2.25 | 0.126 |
| Dobbe et al. [14] | 0.219 |
Dobbe et al. [14] display in their figure 4 and table 3 results for a shear stress of μG = 3 Pa, corresponding to Ca ≈ 3.5, i.e. above our flow rates for this viscosity ratio but close enough so that the relative magnitudes of the deformability range can still be compared. Using the reported mean and standard deviation, we estimate a deformation amplitude of 0.219 by taking 2.576 standard deviations around the mean in the experimental results which accounts for 99% of the entire set of the experimental values. The amplitude produced by oscillations alone, with no inherent differences between erythrocytes within a population, is therefore 58% of the experimentally observed amplitude.
This indicates that the deformation oscillations at steady state has a larger contribution to the range of deformabilities observed than was previously appreciated. Therefore, researchers who wish to study inherent differences between erythrocytes within a population must devise a way of monitoring individual cells over time so that they can remove the oscillation effects.
6. CONCLUSIONS
In this paper, we have utilized our non-stiff cytoskeleton-based continuum erythrocyte algorithm [10] combined with our interfacial spectral boundary element algorithm for membranes [21, 22] to study the oscillatory dynamics of the tank-treading motion of erythrocytes in moderate shear flows. In particular, we have considered shear flows with capillary number Ca = O(1) and small to moderate viscosity ratios 0.01 ≤ λ ≤ 1.5. These conditions correspond to a wide range of surrounding medium viscosities (4 to 600 mPa s) and shear flow rates (2 to 560 s−1), and match those used in ektacytometry systems [3, 11, 12]. Furthermore, the logarithmic dependence of the erythrocyte dimensions with the flow rate, presented in sections 3 B and 5 A, is expected to be valid for much higher flow rates owing to the similar dependence of the ektacytometry deformation found in moderate and strong flow rates, e.g. [11].
It is of interest to note that our computational algorithm allows visualization of the three-dimensional oscillatory behavior of the erythrocyte and thus analysis of the flow dynamics beyond the geometric constraints inherent in ektacytometry systems [11, 12] and other experimental techniques (such as imaging methods parallel to the shear plane [4]) which see the cells from one view-angle only, and thus provide limited information on the erythrocyte dynamics.
As discussed in section 3, for a given viscosity ratio, as the flow rate Ca increases, the steady-state erythrocyte length L increases logarithmically as expected since the shear flow extends the cell; its depth W decreases logarithmically with the flow rate while almost no change is observed in the cell width S. Owing to the oscillatory nature of the tank-treading motion, the erythrocyte length and depth show significant variation (e.g. for λ = 0.1 the relative variations are ΔL/L ≈ ±6% and ΔW/W ≈ ±8%), with negligible variation in the cell width S. In the parameter space studied in this work, the orientation angle Φ of the erythrocyte at steady state decreases slightly with the flow rate, with more significant decrease in the angle variation. Thus increasing the flow rate appears to dampen the oscillatory erythrocyte inclination but not its lengths oscillations.
For a given flow rate, as the viscosity ratio λ increases, the erythrocyte length L contracts and its depth W increases (i.e. the cell becomes less deformed) while the cell width S is practically constant. The increase of the viscosity ratio also results in a small decrease of the length and depth variations, ΔL and ΔW. The average orientation angle Φ of the erythrocyte shows a significant decrease with the viscosity as does the angle oscillation while the oscillation period increases. These trends continue in higher viscosity ratios resulting eventually in the transition from a (weakly oscillatory) tank-treading motion to a tumbling motion.
For all the flow rates and viscosity ratios studied in this paper, the amplitude of oscillations for the erythrocyte deformation D is much smaller than that for the erythrocyte length L and depth W, owing to its definition D = (L−S)/(L+S) and the cell's small, and practically invariant, width S. Thus, the oscillatory behavior of the erythrocyte shape is better revealed via monitoring the cell dimensions L and W, rather than the deformation parameter D.
It is of interest to note that, using a cell imaging method parallel to the shear plane, Abkarian et al. [4] observed the oscillatory inclination of the erythrocyte at low flow rates but not that lengths oscillations (or local details of the interfacial shape) probably due to insufficient resolution. Our computations reveal more details of this oscillatory motion; owing to the phase lag of 90° between length and angle oscillations, the edge of the interfacial geometry traces an approximately circular path as shown in figure 3(b).
Our computations have shown that the erythrocyte width S, which exists in the shear plane, is practically invariant in time, capillary number and viscosity ratio. Therefore, the shape changes observed as time oscillations or due to changes in the flow rate and the viscosity ratio are associated only with the erythrocyte length L (in the shear plane) and its depth W (normal to the shear plane). The (practically constant) erythrocyte width S has a normalized magnitude of approximately 0.32, corresponding to a real cell thickness of about 2.5 μm. It is of interest to note that this value is only slightly less than the smallest possible diameter of about 2.8 μm for a capillary through which erythrocytes can pass in the microcirculation [15]. We emphasize that the cell thickness of 2.5 μm in these shear flows is associated with the three-dimensional dynamics of tank-treading, i.e. with higher values in the other two cell dimensions, while the capillary dynamics is more axisymmetric, and thus the smallest capillary diameter should be higher than the smallest thickness in tank-treading.
In section 4 we have compared our computational results with the predictions of the low degree-of-freedom theoretical models of Keller and Skalak (KS) [13], Abkarian et al. (AFV) [4], and Skotheim and Secomb (SS) [5], to provide further insight on their accuracy but also on the physics included in these models. Several conclusions can be drawn from the comparison of these models with our computational results.
First, the KS and SS models predict qualitatively the decrease of the average orientation angle with the viscosity ratio but the models disagreement with our computations increases with the viscosity ratio. It is of interest to note that the incorporation of the shape-memory effects in the SS model does not improve its predictions on the erythrocyte orientation; thus the cell average orientation is still determined by the original physics included in the KS model. Second, the KS model is shown to underestimate significantly the tank-treading period while the predictions of the SS model are quite accurate. Thus, the shape-memory effects included in the SS model are important for the accurate determination of the tank-treading motion; in particular the shape memory effects reduce significantly the tank-treading speed (by a factor of 5–6) compared to a similar ellipsoidal capsule with a spherical equilibrium shape. Third, the SS model underpredicts significantly the amplitude of the angle oscillations ΔΦ, while the KS model always predicts zero angle oscillations. In addition, none of the three models consider length oscillations. Therefore, a more detailed physical model is needed for the accurate determination of the length and angle variations of the tank-treading erythrocyte. Fourth, we have found that in the parameter space studied in this work (which corresponds to oscillatory tank-treading motion), the AFV model predicts erroneously a tumbling motion when we employ realistic values of the erythrocyte properties. We believe that this erroneous prediction results mainly from the model's overpredictiction of the shape memory effects. This erroneous prediction of the AFV model should be expected since Abkarian et al. were able to quantitatively predict experimental findings, such as the cell's orientation angle and tank-treading frequency, but they had to use two to three orders of magnitude smaller shear modulus Gs than the real one [4].
As discussed in our earlier work [10], our comparison of our computational results with experimental findings [3, 12] suggests that the membrane viscosity slows down the tank-treading motion by a factor close to 2. This is associated with the energy dissipation due to the membrane viscosity and suggest that this energy dissipation is of the same order as that of the oscillatory tank-treading erythrocyte (with zero membrane viscosity). (We emphasize that this conclusion is consistent with the estimation of Fischer [27] that in the tank-treading erythrocytes the energy dissipation in the membrane is of the same order of magnitude as in the cytoplasm.) As mentioned earlier, the comparison of our computational results with the predictions of the KS and SS models for the erythrocyte tank-treading speed included in figure 9(b), shows that the shape-memory effects slow down the tank-treading speed by a factor of 5–6. Thus, the energy dissipation due to the shape-memory effects is more significant than the energy dissipation due to the membrane viscosity. This conclusion may affect earlier studies on non-spherical capsules (e.g. erythrocytes) which were based on models not accounting for the shape-memory effects such as the Keller and Skalak model [13].
Finally, our work also provides insight helpful in the biomedical area. Our results on the influence of the viscosity ratio provide insight on the effects of the paraproteinemia, i.e. a family of disorders associated with elevated plasma protein levels and thus higher plasma viscosity [1]. In addition, in section 5 we study and provide further information and insight on properties measured in ektacytometry systems. We note that ektacytometry systems which measure the deformability of erythrocytes [3, 11, 12] are useful medical tools for studying the inherent differences between erythrocytes as well as several disorders or diseases [14]. Our main conclusion is that variations observed in these systems is not merely due to differences between individual cells as initially thought, e.g. [14], but also due to the time-variant oscillatory tank-treading motion of the erythrocytes which occurs under the ektacytometry conditions. (As discussed in section 5 B, the oscillatory tank-treading motion can account for more than 50% of the variations found in ektacytometry systems [14].) Thus, researchers who wish to study inherent differences between erythrocytes within a population must devise a way of monitoring individual cells over time so that they can remove the oscillation effects.
Acknowledgments
This work was supported in part by the National Science Foundation and the National Institutes of Health. Most computations were performed on multiprocessor computers provided by the National Center for Supercomputing Applications Applications (NCSA) in Illinois.
References
- [1].Baskurt OK, Meiselman HJ. Blood rheology and hemodynamics. Sem. Thromb. Hem. 2003;29:435–450. doi: 10.1055/s-2003-44551. [DOI] [PubMed] [Google Scholar]
- [2].Popel AS, Johnson PC. Microcirculation and Hemorheology. Annu. Rev. Fluid Mech. 2005;37:43–69. doi: 10.1146/annurev.fluid.37.042604.133933. [DOI] [PMC free article] [PubMed] [Google Scholar]
- [3].Fischer TM, Stöhr-Liesen M, Schmid-Schönbein H. The red cell as a fluid droplet: tank tread-like motion of the human erythrocyte membrane in shear flow. Science. 1978;202:894–896. doi: 10.1126/science.715448. [DOI] [PubMed] [Google Scholar]
- [4].Abkarian M, Faivre M, Viallat A. Swinging of red blood cells under shear flow. Phys. Rev. Lett. 2007;98:188302. doi: 10.1103/PhysRevLett.98.188302. [DOI] [PubMed] [Google Scholar]
- [5].Skotheim JM, Secomb TW. Red blood cells and other nonspherical capsules in shear flow: oscillatory dynamics and the tank-treading-to-tumbling transition. Phys. Rev. Lett. 2007;98:078301. doi: 10.1103/PhysRevLett.98.078301. [DOI] [PubMed] [Google Scholar]
- [6].Kessler S, Finken R, Seifert U. Swinging and tumbling of elastic capsules in shear flow. J. Fluid Mech. 2008;605:207–226. [Google Scholar]
- [7].Sui Y, Chew YT, Roy P, Cheng YP, Low HT. Dynamic motion of red blood cells in simple shear flow. Phys. Fluids. 2008;20:112106. [Google Scholar]
- [8].Sui Y, Low HT, Chew YT, Roy P. Tank-treading, swinging, and tumbling of liquid-filled elastic capsules in shear flow. Phys. Rev. E. 2008;77:016310. doi: 10.1103/PhysRevE.77.016310. [DOI] [PubMed] [Google Scholar]
- [9].Bagchi P, Kalluri RM. Dynamics of nonspherical capsules in shear flow. Phys. Rev. E. 2009;80:016307. doi: 10.1103/PhysRevE.80.016307. [DOI] [PubMed] [Google Scholar]
- [10].Dodson WR, III, Dimitrakopoulos P. Tank-treading of erythrocytes in strong shear flows via a non-stiff cytoskeleton-based continuum computational modeling. Biophys. J. 2010;99:2906–2916. doi: 10.1016/j.bpj.2010.08.048. [DOI] [PMC free article] [PubMed] [Google Scholar]
- [11].Hardeman MR, Goedhart PT, Dobbe JGG, Lettinga KP. Laser-assisted optical rotational cell analyser (LORCA): I. A new instrument for measurement of various structural hemorheological parameters. Clin. Hemorheol. 1994;14:605–618. [Google Scholar]
- [12].Fischer TM. Tank-tread frequency of the red cell membrane: dependence on the viscosity of the suspending medium. Biophys. J. 2007;93:2553–2581. doi: 10.1529/biophysj.107.104505. [DOI] [PMC free article] [PubMed] [Google Scholar]
- [13].Keller SR, Skalak R. Motion of a tank-treading ellipsoidal particle in a shear flow. J. Fluid Mech. 1982;120:27–47. [Google Scholar]
- [14].Dobbe JGG, Streekstra GJ, Hardeman MR, Ince C, Grimbergen CA. Measurement of the distribution of red blood cell deformability using an automated rheoscope. Cytometry. 2002;50:313–325. doi: 10.1002/cyto.10171. [DOI] [PubMed] [Google Scholar]
- [15].Skalak R, Özkaya N, Skalak TC. Biofluid Mechanics. Annu. Rev. Fluid Mech. 1989;21:167–204. [Google Scholar]
- [16].Mohandas N, Chasis JA. Red blood cell deformability, membrane material properties and shape: regulation by transmembrane, skeletal and cytosolic proteins and lipids. Sem. Hem. 1993;30:171–192. [PubMed] [Google Scholar]
- [17].Hamill OP, Martinac B. Molecular basis of mechanotransduction in living cells. Phsiol. Rev. 2001;81:685–740. doi: 10.1152/physrev.2001.81.2.685. [DOI] [PubMed] [Google Scholar]
- [18].Guido S, Tomaiuolo G. Microconfined flow behavior of red blood cells in vitro. C. R. Physique. 2009;10:751–763. doi: 10.1016/j.medengphy.2015.05.007. [DOI] [PubMed] [Google Scholar]
- [19].Evans E, Fung Y-C. Improved measurements of the erythrocyte geometry. Microvasc. Res. 1972;4:335–347. doi: 10.1016/0026-2862(72)90069-6. [DOI] [PubMed] [Google Scholar]
- [20].Fischer TM. Shape memory of human red blood cells. Biophys. J. 2004;86:3304–3313. doi: 10.1016/S0006-3495(04)74378-7. [DOI] [PMC free article] [PubMed] [Google Scholar]
- [21].Dodson WR, III, Dimitrakopoulos P. Spindles, cusps and bifurcation for capsules in Stokes flow. Phys. Rev. Lett. 2008;101:208102. doi: 10.1103/PhysRevLett.101.208102. [DOI] [PubMed] [Google Scholar]
- [22].Dodson WR, III, Dimitrakopoulos P. Dynamics of strain-hardening and strain-softening capsules in strong planar extensional flows via an interfacial spectral boundary element algorithm for elastic membranes. J. Fluid Mech. 2009;641:263–296. [Google Scholar]
- [23].Skalak R, Tozeren A, Zarda RP, Chien S. Strain energy function of red blood cell membranes. Biophys. J. 1973;13:245–264. doi: 10.1016/S0006-3495(73)85983-1. [DOI] [PMC free article] [PubMed] [Google Scholar]
- [24].Pozrikidis C. Numerical simulation of the flow-induced deformation of red blood cells. Ann. Biomed. Eng. 2003;31:1194–1205. doi: 10.1114/1.1617985. [DOI] [PubMed] [Google Scholar]
- [25].Doddi SK, Bagchi P. Three-dimensional computational modeling of multiple deformable cells flowing in microvessels. Phys. Rev. E. 2009;79:046318. doi: 10.1103/PhysRevE.79.046318. [DOI] [PubMed] [Google Scholar]
- [26].Lac E, Barthès-Biesel D, Pelekasis NA, Tsamopoulos J. Spherical capsules in three-dimensional unbounded Stokes flows: effect of the membrane constitutive law and onset of buckling. J. Fluid Mech. 2004;516:303–334. [Google Scholar]
- [27].Fischer TM. On the energy dissipation in a tank-treading human red blood cell. Biophys. J. 1980;32:863–868. doi: 10.1016/S0006-3495(80)85022-3. [DOI] [PMC free article] [PubMed] [Google Scholar]
- [28].Tran-Son-Tay R, Sutera SP, Rao PR. Determination of red blood cell membrane viscosity from rheoscopic observations of tank-treading motion. Biophys. J. 1984;46:65–72. doi: 10.1016/S0006-3495(84)83999-5. [DOI] [PMC free article] [PubMed] [Google Scholar]
- [29].Hénon S, Lenormand G, Richert A, Gallet F. A new determination of the shear modulus of the human erythrocyte membrane using optical tweezers. Biophys. J. 1999;76:1145–1151. doi: 10.1016/S0006-3495(99)77279-6. [DOI] [PMC free article] [PubMed] [Google Scholar]
- [30].Mohandas N, Clark MR, Jacobs MS, Shohet SB. Analysis of factors regarding erythrocyte deformability. J. Clin. Invest. 1980;66:563–573. doi: 10.1172/JCI109888. [DOI] [PMC free article] [PubMed] [Google Scholar]
- [31].Walter A, Rehage H, Leonhard H. Shear induced deformation of microcapsules: shape oscillations and membrane folding. Coll. Surf. A. 2001;183:123–132. [Google Scholar]
- [32].Beaucourt J, Rioual F, Seón T, Biben T, Misbah C. Steady to unsteady dynamics of a vesicle in a flow. Phys. Rev. E. 2004;69:011906. doi: 10.1103/PhysRevE.69.011906. [DOI] [PubMed] [Google Scholar]
- [33].Takagi S, Yamada T, Gong X, Matsumoto Y. The deformation of a vesicle in a linear shear flow. J. Appl. Mech. 2009;76:021207. [Google Scholar]
- [34].Tsubota K, Wada S. Effect of the natural state of an elastic cellular membrane on tank-treading and tumbling motions of a single red blood cell. Phys. Rev. E. 2010;81:011910. doi: 10.1103/PhysRevE.81.011910. [DOI] [PubMed] [Google Scholar]
- [35].Ramanujan S, Pozrikidis C. Deformation of liquid capsules enclosed by elastic membranes in simple shear flow: large deformations and the effect of fluid viscosities. J. Fluid Mech. 1998;361:117–143. [Google Scholar]