

Abstract
Motivation: Next-generation sequencing affords an efficient analysis of transposon insertion libraries, which can be used to identify essential genes in bacteria. To analyse this high-resolution data, we present a formal Bayesian framework for estimating the posterior probability of essentiality for each gene, using the extreme-value distribution to characterize the statistical significance of the longest region lacking insertions within a gene. We describe a sampling procedure based on the Metropolis–Hastings algorithm to calculate posterior probabilities of essentiality while simultaneously integrating over unknown internal parameters.
Results: Using a sequence dataset from a transposon library for Mycobacterium tuberculosis, we show that this Bayesian approach predicts essential genes that correspond well with genes shown to be essential in previous studies. Furthermore, we show that by using the extreme-value distribution to characterize genomic regions lacking transposon insertions, this method is capable of identifying essential domains within genes. This approach can be used for analysing transposon libraries in other organisms and augmenting essentiality predictions with statistical confidence scores.
Availability: A python script implementing the method described is available for download from http://saclab.tamu.edu/essentiality/.
Contact: michael.dejesus@tamu.edu or ioerger@cs.tamu.edu
Supplementary information: Supplementary data are available at Bioinformatics online.
1 INTRODUCTION
Transposon mutagenesis is a frequently used laboratory method for determining essential genes in bacterial organisms. Essential genes are those genes necessary for growth under a wide variety of environmental conditions. Knowledge of essential genes is important for the discovery of new antibacterial drugs because these genes are potential targets for inhibitors (Hasan et al., 2006). One way of determining essential genes is to identify regions of the genome in which insertional mutations produce non-viable cells. To do this, a high-density library of transposon mutants is constructed. The synthetic transposons used in these studies are small fragments of DNA (typically 1–2 kb), which can be inserted into different locations in the chromosome through the action of a distally encoded transposase enzyme (Hayes, 2003). For example, derivatives of the Himar1 transposon are widely used and have been characterized to insert at arbitrary TA dinucleotides without any other obvious sequence specificity bias (Lampe et al., 1996; Rubin et al., 1999). The total number of TA sites within a gene often varies ∼10–100 sites depending on gene length and GC content. When a transposon inserts at one of these TA sites within a gene, it presumably disrupts the function of the gene. In a large library of transposon insertion mutants, genes harbouring insertions are presumed to be non-essential. Genes lacking insertions may be essential, as they cannot tolerate disruption; however, this depends on the size of gene and degree of saturation of the library (Lamichhane et al., 2003). Typically, 10–15% of open reading frames (ORFs) in a bacterial genome are found to be essential (Gerdes et al., 2003), including genes involved in core metabolism, cell-wall biosynthesis, protein translation and DNA replication (all of which are known targets of existing drugs). Differential analysis of essential genes in bacteria passaged through a host could be used to identify genes specifically required for infection (Sassetti and Rubin, 2003).
In the original implementation, the location of transposon insertions in individual mutants was read out via microarray hybridization. A primer-extension step, using a primer complimentary to one end of the transposon, was used to amplify the adjacent genomic region, and the relative abundance of these nucleic acid probes was quantified via hybridization to oligonucleotide representing each gene (Sassetti et al., 2003). Both the resolution and the quantitative accuracy of this method were limited. More recently, use of hybridization to analyse transposon libraries has been replaced by deep sequencing using next-generation sequencers, which yield millions of short reads (typically 50–100 bp). Mapping of reads amplified from transposon boundaries can give precise coordinates of insertions within the genome (Gawronski et al., 2009; Griffin et al., 2011; Langridge et al., 2009). The high-resolution data afforded by deep sequencing present some unique challenges for analysis of gene essentiality. It has previously been observed that even essential genes can tolerate transposon insertions in the extreme N- and C-termini of the ORF (Akerley et al., 1998; Christen et al., 2011; Smith et al., 1996). Previous analyses have often used an ad hoc criterion, such as exclusion of insertions in the first/last 5–20% of the coding region (Gawronski et al., 2009). For similar reasons, insertions are sometimes tolerated in linker regions between domains, or one domain but not another of an essential protein (Lamichhane et al., 2005). For example, transposon insertions in the N-terminus of Mmpl5 caused attenuation of infection in mouse lungs, whereas insertions in the C-terminus did not (Lamichhane et al., 2005). Thus, it is inaccurate to assume that only genes completely lacking transposon insertions are essential.
In previous work, we described a novel statistical method for analysing transposon insertion data to characterize the essentiality of genes within an organism (Griffin et al., 2011). The method was based on identifying the longest consecutive stretch of TA sites lacking insertions in a gene and estimating the likelihood of such an open region occurring by chance through the extreme-value (Gumbel) distribution. This model was based on an analogy to runs of tails in a sequence of coin tosses, where each TA site is viewed as an independent Bernoulli trial given the background insertion frequency in non-essential genes. This analysis was shown to correlate well with previous characterizations of genes essential for in vitro growth of Mycobacterium tuberculosis. The primary advantage of this method is that essentiality is based on statistically significant stretches of TA sites lacking insertions, regardless of the presence of insertions at other regions within the gene. This is in contrast to other models, such as a multinomial model, where the order of insertions is not taken into consideration (Blades and Broman, 2002), and it may miss regions characteristic of essential domains. One limitation of our previous method is that it depends on an a priori estimate of the insertion frequency in non-essential genes. Although this can be approximated (over all TA sites in the whole genome) or tuned iteratively (by separating out essential genes), a more rigorous statistical treatment is desirable.
One possible way to approximate the parameters of this model and find estimates of essentiality is to use the expectation-maximization (EM) algorithm. Although the EM algorithm converges relatively quickly, it depends on maximizing the likelihood of the given distribution. This is not feasible for the product of Gumbel distributions, as no closed-form expression for the derivative exists.
In this article, we present a formal Bayesian analysis of transposon insertion data that simultaneously estimates the likelihood of essentiality for each gene and the non-insertion frequency for each class, given in the data. We develop a formula for the joint and conditional densities based on the likelihood for each gene. We describe how to use a Metropolis–Hastings (MH) sampling procedure to estimate the parameters from the data, by sampling from the joint probability densities. This method produces a formal estimate of essentiality for each gene from the posterior probability given the observed insertion data, marginalizing over the unknown insertion frequencies in essential and non-essential genes.
2 METHODS
The sequence data obtained from transposon mutagenesis experiments consist of a set of reads mapping to TA dinucleotides sites within the genome. The read counts at each TA site are discretized to a binary value of 1 (‘insertion’) or 0 (‘non-insertion’) depending on the presence or absence of transposon reads mapping to those locations. Although the number of reads mapping to a location may contain useful additional information about essentiality, it can also be subject to variability because of phenomena such as polymerase chain reaction bias. Thus, we take the presence/absence of insertions within genes to be sufficient for identifying essential regions in our model. TA sites are assumed to be independent from each other and treated as a set of Bernoulli trials (analogous to coin-tossing, with insertions and non-insertions representing outcomes of tails or heads), which is a reasonable assumption in non-essential genes, where the probability of insertion at adjacent sites is thought to be independent.
From these data, we obtain the maximum number of consecutive TA sites lacking insertions within the genes and the number of nucleotides spanned by this sequence. Although the geometric distribution governs the distribution of the number of non-insertions observed in a row, the Gumbel (extreme-value distribution) can be used to characterize the longest run of non-insertions observed in a gene. The Gumbel distribution serves as a likelihood function for non-essential genes, as the longest runs of non-insertion should follow what we expect given the global non-insertion frequency. On the other hand, essential genes, whose maximum runs of non-insertions should be longer than expected, are instead modelled through a normalized sigmoid function. This likelihood function reflects the fact that any gene can be essential (with more or less uniform probability), except those genes with spans of non-insertion that are too small to represent a domain. Using this model of the data, we derive posterior densities for the essentiality of each gene and use the MH algorithm to obtain an Markov Chain Monte Carlo (MCMC) sample of values of these densities from which to estimate their posterior probabilities.
2.1 Bayesian mixture model
Let  represent our observations for the ith gene for
  , where ni represents the total number of TA sites, ri represent the longest run of non-insertions observed and si represents the span of nucleotides of the longest run of non-insertions. Each gene is modelled as coming from one of two classes, 1 and 0, representing essential and non-essential genes, respectively. The complete set of essentiality assignments is represented by the latent variable
  (Boolean vector), with the essentiality assignment of an individual ith gene represented by the Boolean variable Zi, which takes on binary values of 1 and 0 for the two possible classes. We assume a Bernoulli probability,
  , that governs probability of non-insertion across non-essential genes. Finally,
  , the mixing coefficient, represents the prevalence of essential and non-essential genes within the mixture (with
  ).
).
2.1.1 Likelihood for non-essential genes
The data, Yi, for each gene consist of observations ri and si, representing the maximum run of non-insertions (TA sites without insertions) in a row, and the number of nucleotides spanned by this gap of non-insertions. The joint likelihood of these observations is
To the likelihood of observing a maximum run of non-insertions, ri, is modelled through the Gumbel distribution:
| (1) |
where  , and m and τ are the location and scale parameters, respectively, of the underlying distribution. In analogy to coin-tossing, these parameters are functions of the probability of non-insertion,
  , and of the total number of trials, n, derived by determining the expected maximum value in a series of independent samples from a geometric distribution (Schilling, 1990):
| (2) |
Note that the expected length of the maximum run of non-insertions increases logarithmically with n (the total number of TA sites in the gene). As ri and si are highly correlated (Fig. 1), we model their dependence as linear-Gaussian, with covariance matrix  estimated a priori from empirical data:
| (3) |
were  and
and  are the parameters of the normal distribution, derived from the linear-Gaussian relationship (i.e.
  ) observed in the data.
Fig. 1.

Relationship between length of run of non-insertions (#TA sites) and span (nucleotides)
The joint likelihood of the observations at non-essential genes is therefore:
| (4) |
2.1.2 Likelihood for essential genes
We model the likelihood at essential genes based on a sigmoid function that is uniform as long as the gene contains a gap that is as large as a typical protein domain, as a gap could be any size, even as large as the entire ORF. Using this likelihood allows our method to disambiguate those cases where the run of non-insertions actually represents a smaller or larger segment of the genome than suggested by the number of consecutive TA sites without insertions.
The number of nucleotides spanned by a given run on non-insertions, si, is modelled by a normalized sigmoid (logistic) function:
| (5) |
where δ is the mean number of nucleotides spanned by an average protein domain, κ is equal to 0.1 and C is normalization constant. Previous studies of the length of domains within proteins have found the average size to be ∼100 amino acids or 300 bp (Wheelan et al., 2000). Using this threshold for δ, the likelihood of observing a given span si is more or less uniform, except it is near 0 if the longest run of non-insertions spans less than ∼300 bp. Supplementary Figure S2 shows how sensitive the model is to the these parameters.
As with non-essential genes, the likelihood of observing a span of nucleotides ri given si is modelled through a linear-Gaussian dependence similar to Equation (3), but with an inverse relationship [i.e.  ]. The joint likelihood of the observations at essential genes is, therefore,
| (6) |
2.1.3 Prior distributions
Our previous expectation for the probability of non-insertion at non-essential genes,  , is represented by a beta distribution, with hyper-parameters
  and
and  :
:
The previous probability of an individual essentiality assignment, Zi, depends on the probability that the ith gene is essential or non-essential; therefore, it is characterized by a Bernoulli distribution with that depends on  :
:
Similarly, the previous probability of an essentiality assignment for all genes, Z is a product of Bernoulli trials with probability  :
:
where G is the total number of genes and Kz is the sum of the binary vector of essentiality assignments (i.e.  ). Finally, our previous expectations for the mixing coefficient
  are given by a beta distribution:
2.1.4 Joint distribution
To derive the posterior probability density functions necessary for our Bayesian inferences of essentiality, we first define the full joint distribution, 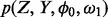 . The full joint distribution is equal to the product of the data-likelihood and the previous expectations for the variables:
 . We assume independence among genes; therefore, the likelihood can be written as a product of the observations over individual genes:
 |
(7) |
2.1.5 Conditional distributions
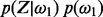
Using the full joint probability (7), we derive a conditional distribution for the probability of non-insertion at non-essential genes,  , using proportionality to cancel out those parameters that are constant with respect to
  :
:
 |
(8) |
Similarly, we derive a conditional distribution for the individual essentiality values Zi, specifying both possible essentiality assignments (i.e.  and
and  ):
):
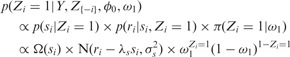 |
(9) |
 |
(10) |
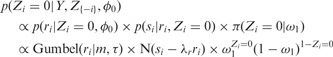
2.2 Metropolis–Hastings sampling
We wish to obtain posterior estimates of essentiality for all genes, integrating over possible values of the unknown variables (e.g.  ). To accomplish this, we generate a Markov chain Monte-Carlo sample of values from the conditional densities of interest. By sampling from these conditional densities, we can obtain posterior estimates of essentiality, Zi, without having to know or calculate the probability of non-insertions,
  , before hand; effectively integrating over this parameter.
Because the conditional distribution of Zi admits only two possible outcomes (i.e. essential and non-essential), this density can be sampled from a Bernoulli distribution with outcomes proportional to the normalized conditional probability (9, 10):
However, the posterior distribution for the parameter  (8) is the product of multiple Gumbel distributions and a Beta distribution, which are not conjugate with each other and cannot be easily sampled. To sample from this posterior density, we use a random-walk MH algorithm. The MH algorithm is capable of sampling from arbitrary distributions of interest by proposing new candidate values from a Gaussian distribution centred on the last accepted value,
  , with small variance, v, and accepting or rejecting candidate values probabilistically. Algorithm 1 presents the sampling scheme used to sample the posterior densities of
  and Zi. An MH step is taken to sample
  , and then we sample Zi for each gene.
Algorithm: Random-walk Metropolis–Hastings.
Result: MCMC Samples of density  and
and  assign starting value to
  and initialize Z based on proportion of insertions within individual genes (i.e. If
  then
then  else
else  );
);
Algorithm 1: Random-walk Metropolis–Hastings Algorithm for sampling  and Z
and Z
After the samples of parameter value,  , and essentiality assignments, Zi, are obtained, their posterior estimates can be obtained by averaging over the final sample, minus a burn-in stage to ensure the sampling procedure has mixed well.
3 RESULTS
We applied our method to deep-sequencing data from transposon-insertion libraries of the H37Rv strain of M.tuberculosis. The full details of the construction of this library are presented in Griffin et al. (2011). Briefly, the libraries were prepared by transforming H37Rv using the MycoMarT7 phage, leading to ∼105 independent insertion events. Colony forming units were inoculated into 200 ml of minimal media and 0.1% glycerol and grown at 37°C. The libraries were sequenced with an Illumina GAII sequencer and a read length of 36 bp (6–8 million reads per library).
The H37Rv genome has 4 411 654 bp, and it contains 3989 ORFs (Cole et al., 1998). This equates to an average of 15.9 TA sites per ORF, spaced ∼61 bp apart on average. Reads from two independent libraries were obtained, which were then summed together to achieve a higher sampling density of the TA sites. Of the 74 605 total TA sites in the genome, 38 984 (53.12%) had reads mapping to them, showing evidence of a transposon insertion at those locations. Of these insertion sites, 32 701 of them occurred within ORFs. We assume that sites with a small number of reads (i.e. one) could represent spurious reads possibly because of sequencing errors; therefore, those sites were treated as lacking any insertions. However, Supplementary Figure S9 shows the read counts fit an overdispersed Poisson distribution, suggesting most are legitimate insertions. Sites with just one insertion are discarded anyway to be safe, requiring insertions to be confirmed by at least two reads. This might lower the effective density of the dataset; however, this does not affect the method. Of the 3989 ORFs in H37Rv, 41 do not contain any TA sites. An additional set of 237 genes were deemed too short because of the fact that they do not contain enough TA sites (i.e  ), or the span of nucleotides was too short (i.e.
  ). Therefore, a total of 278 genes are reported as ‘no-data’ because our analysis is not appropriate for these genes.
The sampling procedure was run for 50 000 iterations, providing estimates of essentiality for all viable genes, as well as estimates of the parameter  . To ensure that the algorithm mixed well and the samples obtained were uncorrelated, the first 1000 samples were treated as a ‘burn-in’ period and discarded; only keeping every 20th sample after there. Supplementary Section S2 contains an analysis of the convergence of the MH procedure used. The value for
  (non-insertion frequency in non-essential genes) was estimated to be
  (SD). Performance on a lower-density dataset, also H37Rv grown on glycerol, is described in Supplementary Section S3. This lower-density library contains fewer transposon insertions in coding regions [i.e. 23 399 (36.3%) compared with 31 715 (50.4%) in the library described earlier in the text], and it has longer runs of non-insertions among the genes (
 ). Rather than predicting more essential genes, our analysis is more conservative in its predictions, as it is less confident of the essentiality of the genes given the sparsity of the insertions.
3.1 Essentiality results
After obtaining the sample from the MH procedure, the posterior probability of essentiality for all genes is estimated by averaging over the sample of essentiality values,  . To set significance thresholds while correcting for multiple comparisons (i.e. to control false discovery rate, FDR), we use a method described by Muller et al. (2006), which emulates the Benjamini–Hochberg procedure for Bayesian posterior probabilities. Limiting the FDR at 0.05, genes with
  are classified as non-essential, and genes with
  are classified as essential. Supplementary Table S1 contains our predictions for all 3989 ORFs in H37Rv. In total, 667 genes are categorized as essential, and 2693 are non-essential by this criterion. These include genes experimentally validated to be essential for growth in vitro [i.e. prrA and prrB (Haydel et al., 2012), phoP (Goyal et al., 2011) and mshA and mshC (Buchmeier and Fahey, 2006] and genes known to be non-essential [i.e. rpfA (Kana et al., 2008), glnD (Read et al., 2007), echA5 and fadB3 (Williams et al., 2011)]. The remaining genes represent those for which the method is unable to reach an essentiality assignment with confidence. Figure 2 shows a cumulative plot of the
  values for all the genes, with the horizontal lines representing the thresholds of essentiality and non-essentiality. To assess the sensitivity of this result to the fixed parameters in the likelihood function for essential genes, we obtained results for different values of δ and κ parameters of the sigmoid function. Supplementary Figure S2 shows a cumulative plot of
  values for different combinations of these parameters. The κ parameter has little effect on the final result. On the other hand, a 2-fold increase and decrease of the δ parameter significantly changes the slope of the graph as well as the number of non-essential genes estimated. This is consistent with the fact that the δ parameter represents the expected span of nucleotides for essential domains. This has been empirically determined to be ∼300 nt.
Fig. 2.

Cumulative plot of posterior probabilities  . The average Zi value for each gene was plotted in ascending order, for each of the different combinations of parameters investigated. The horizontal lines represent the final thresholds for essentiality:
  and
and 
Table 1 reports statistics for the different categories of genes. On average, essential genes contained significantly longer maximum runs of non-insertion (17.57) than non-essential genes, and these runs spanned a larger number of nucleotides (1039.81 bp), which is consistent with our expectations for essentiality. Non-essential genes contained a larger number of insertions on average (15.69). Although essential genes contained only a small number of insertions (1.68), this number was greater than zero, indicating that the method is capable of detecting essential genes with a small number of insertions, provided they contain a long enough run of non-insertions suggestive of an essential region.
Table 1.
Statistics for essentials, non-essentials and uncertain genes
| Category | Total |
Average |
|||
|---|---|---|---|---|---|
| Genes | TA Sites | Insertions | Max run | Span | |
| Essentials | 667 | 21.32 | 1.68 | 17.57 | 1039.8 |
| Uncertain | 342 | 16.61 | 6.45 | 5.75 | 410.4 |
| Non-essentials | 2693 | 15.69 | 10.78 | 2.05 | 54.5 |
Non-essential genes are those with  ; essential genes are those with
  . Average span is in nucleotides.
3.2 Concordance with previous results
The essentiality of the entire M.tuberculosis H37Rv genome has been characterized previously using transposon-site hybridization (Sassetti and Rubin, 2003; Sassetti et al., 2003). We compare our essentiality inferences with previous results to verify that our method achieves results that are consistent with expectations of the essentiality in M.tuberculosis. Sassetti et al. used transposon-site hybridization (TraSH) to characterize the genes necessary for optimal growth in vitro, for a library of transposon mutants grown on 0.02% glucose and rich-media (7H10). Although our method analyses deep sequencing of transposon libraries, TraSH uses hybridization of gene-specific probes to quantify the level of fluorescence being emitted by hybridization probes to determine which genes are being interrupted in the library of mutants. Table 2 contains a comparison between the two methods.
Table 2.
Comparison of essentiality predictions with TraSH analysis
| Category | Bayesian method |
|||||
|---|---|---|---|---|---|---|
| Essential | Uncertain | Non- essential | No- data | Total | ||
| Sassetti-03 | Essentials | 429 | 75 | 81 | 29 | 614 |
| Growth defect | 9 | 4 | 28 | 1 | 42 | |
| Non-essential | 94 | 151 | 2131 | 144 | 2520 | |
| No-data | 135 | 112 | 453 | 113 | 813 | |
| Total | 667 | 342 | 2693 | 287 | 3989 | |
The results obtained by Sassetti et al. are compared with those obtained with our Bayesian method for all 3989 genes in M.tuberculosis.
Sassetti et al. also included an additional category of genes representing those whose interruption causes growth defects (i.e. slower growth); our method does not make this distinction. Excluding these, the two methods show agreement in 69.9% of essentials and 84.6% of non-essentials for 81.7% genes across both categories. There were only 81 genes predicted to be essential by TraSH but not by our method; 94 genes predicted to be non-essential by TraSH but found to be essential by our method.
Some of these differences could be due to the different growth conditions of the libraries. For example, because our library was grown on glycerol, we find genes necessary for glycerol metabolism as essential, such as GlpK (glycerol kinase). Other differences may be due to incomplete sequence coverage (e.g. gaps in PE_PGRS genes, which are highly GC-rich and hard to sequence). Two of the 62 PE_PGRS genes in the H37Rv genome were classified as essential by our model because of large regions without insertions, although genes in this family are generally believed to be non-essential (Banu et al., 2002). Overrepresentation of PE_PGRS gene among essentials was also noted in other transposon library analyses using sequencing (Lamichhane et al., 2003).
One notable difference is that Sassetti et al. found glcB to be non-essential; however, the insertion pattern shown in Figure 3 clearly indicates that this gene was unable to tolerate insertions in the libraries of mutants analysed. GlcB encodes for malate synthase in M.tuberculosis, which was originally thought to be necessary only for growth on fatty acids as part of a glyoxylate shunt (McKinney et al., 2000), but it has recently been shown to be essential on other carbon sources like dextrose by chemical inhibition (Krieger et al., 2012). A complete absence of transposon insertions in Rv1837c was also observed in the DeADMAn studies (Lamichhane et al., 2003). Our data suggest that GlcB is also essential for growth on glycerol (in liquid culture with minimal media), showing a significant run of non-insertions (25 of 27—spanning 2078 nt, p( ) = 1.0). It should be noted that in the original TraSH data, GlcB had a hybridization ratio of 0.41, which was near the threshold for essentiality (
 ).
).
Fig. 3.

Insertion pattern for Rv1837c. Figures created using the Integrative Genomics Viewer (IGV)—distributed by the Broad Institute. http://www.broadinstitute.org/igv/
3.3 Comparison with other statistical models
In contrast to other models where the order of insertions does not matter, the Gumbel distribution is capable of identifying regions lacking insertions within genes that are significantly longer than expected, despite the presence of insertions elsewhere in the gene. Models of essentiality that focus solely on the proportion of insertions or the number of reads within genes may miss these essential regions if enough insertions are observed elsewhere within the gene.
To evaluate this important distinction, we compare our method with the method proposed by Blades and Broman (2002). This method does not take the order of insertions into consideration, but instead it is based on a multinomial likelihood function that characterizes the number of mutants with insertions unique to a gene, as well the number of mutants with insertions that occur in regions that overlap with adjacent genes (which adds uncertainty as to which gene was disrupted). Using this multinomial likelihood, Blades and Broman implement a Gibbs sampling procedure that estimates posterior probabilities of essentiality for all the genes.
We obtained the R package ‘negenes’, which contains the implementation of this method maintained by Karl W. Broman (http://www.biostat.wisc.edu/kbroman/software/). The Gibbs sampler was run on the same H37Rv glycerol dataset analysed earlier in the text, for 50 000 iterations. The first 1000 samples were ignored as part of the burn-in period, and only every 22th sample was kept to remove any auto-correlation in the sampling process. Following Lamichhane et al. (2003), we used the number of insertions within the N-terminal 80% of the ORF, as representative of the number of viable mutants with insertions in genes.
After obtaining the probability of essentiality from the Gibbs sampler, we set thresholds for essentiality by correcting for multiple comparisons and controlling the false discovery rate as we did for the Gumbel method (implementing a procedure analogous to the one proposed by Benjamini and Hochberg). We use these thresholds to classify the genes as essential, non-essential or uncertain.
The Blades and Broman method predicts 244 essential genes and 3195 non-essential genes. As the small number of essential genes could be due to the selected threshold, a less conservative threshold for essentiality (posterior probability  ) results in 458 genes being predicted as essential, still well below the 614 essential genes characterized by Sassetti et al. (2003). A full breakdown of the results is found in Supplementary Table S5.
The lower number of essentials predicted by the Blades and Broman method is due to the fact that the presence of even a few insertions in a gene (i.e.  ) is enough to make it seem non-essential under this multinomial model. For example, GyrB (β subunit of DNA gyrase), a known essential gene and target of fluoroquinolones, is found to be non-essential by the Blades and Broman method, as it is observed to have insertions at the N-terminus. In contrast, our method finds GyrB to be essential, as it contains a significant stretch of TA sites lacking any insertions (40 consecutive TA sites lacking insertions of 43 TA sites in the gene), which is what we would expect from an essential gene. Although this could be potentially overcome by ignoring insertions at the ends of the N- and C- termini (e.g. considering only 5–80% of the coding region as recommended by Gawronski et al., 2009), a strength of our model is that it does not need to discard these regions a priori.
The dataset was also analysed with the ESSENTIALS software, which uses a negative binomial distribution to analyse read counts within each gene (Zomer et al., 2012). ESSENTIALS only predicts 434 genes in the H37Rv genome to be essential (using a −8.13-fold change cut-off determined by the software) and 3363 genes to be non-essential. Thus, similar to the Blades and Broman method, the ESSENTIALS software also underpredicts the number of essential genes compared with what is expected for this organism (i.e. ∼600, based on prior TraSH studies). However, 93.5% of the genes predicted to be essential by the ESSENTIALS software (406/434) overlap with the genes predicted to be essential by our Bayesian method, effectively representing a subset (60% of our 667). In all, 311 of the 434 genes were correctly labelled as essential according to the original TraSH experiments, capturing 50% of the 614 essential genes previously characterized. The primary reason that other genes that are believed to be essential are not identified as such by the ESSENTIALS software seems to be because many of these genes often contain some insertions at a few sites in the ORF (such as at the N- and C- termini or in a non-essential domain); thus their read counts are higher than expected for an essential gene (according to their model).
3.4 Essential domains
One of the advantages of our method for analysing this high-resolution transposon insertion data is that it can reveal essential regions or domains within proteins. The regions devoid of insertions detected by our method often correspond to well-defined protein folding domains. To date, the X-ray crystallographic structures of only 8.5% of proteins in H37Rv have been determined (Ehebauer and Wilmanns, 2011). Thus, to test the model’s ability to detect essential domains, we compare these regions with Pfam predictions of protein domains within H37Rv genes. Pfam is able to make predictions of domains based on amino acid sequence homology using hidden Markov models to represent protein families (Finn et al., 2010).
Using Pfam, we obtained predictions of 5091 protein domains, 1126 of which were in genes predicted to be essential by our method. To determine whether the significant runs of non-insertions observed coincide with protein domain boundaries, we calculated a ratio of overlap between the nucleotides spanned by a maximum run of non-insertions and the domain boundaries predicted by Pfam (Table 3). For a Pfam domain spanning coordinates  , if the closest matching region lacking insertions is
  , then the overlap score is
  . Of the 1126 domains found within essential genes, 976 (86.68%) of them overlapped significantly (i.e. score
  ) with the domain boundaries, suggesting that the majority of Pfam domains are contained within the runs of non-insertions observed. Another set of 104 domains (9.24%) had no significant overlap (i.e. score
  ), potentially representing those domains that are within non-essential regions of essential genes. The remaining 46 (4.08%) domains represent those with an intermediate overlap (i.e. score between
  ), representing a small set of genes for which the Pfam boundary prediction may be inconsistent.
Table 3.
Statistics for Pfam domain predictions
| Category | Total |
Average |
||
|---|---|---|---|---|
| Domains | Length | TA sites | Overlap | |
| Non-essentials | 3240 | 464.45 | 7.47 | 0.28 |
| Uncertain | 512 | 457.90 | 6.30 | 0.47 |
| Essentials | 1126 | 518.78 | 8.31 | 0.89 |
In some cases, the pattern of transposon insertions is capable of identifying individual domains as essential through a sequence of TA sites lacking insertions that closely matches the boundaries of the predicted Pfam domain. To identify such cases, we matched the Pfam domain predictions to the closest run of non-insertions and calculated a consistency score that reflects the consistency between the two regions. This consistency score was based on comparing the distance (in nucleotides) between the boundaries of the domain prediction  and the boundaries of the run of non-insertions
  . We restricted attention to genes for which the run of non-insertions corresponding to the domain is statistically significant (P < 0.05 using a cumulative Gumbel distribution), and whose distance between boundaries (upstream or downstream) is <50 bp (i.e.
  ). We identified 95 known domains that were mostly devoid of transposon insertions internally, but for which insertions were observed at TA sites right near the boundaries (shown in Supplementary Table S2). Many of these constitute essential single-domain proteins, although several occur in larger multi-domain proteins with both essential and non-essential regions. To identify genes that contain both essential and non-essential domains, we selected a subset of genes that are labelled as essential by our Bayesian analysis, but for which there is still a relatively large (i.e. #TAs
  ) area remaining containing an insertion frequency that is not significantly essential (i.e. P-value of
  ) according to the cumulative binomial distribution. This gave a set of 36 genes (presented in Supplementary Table S3) that represent interesting cases where there is a combination of both essential and non-essential regions.
Among the genes that our method identifies as having both essential and non-essential domains are Rv3910 and Rv0018c. These two genes have been shown to be essential for growth in mycobacteria and are involved in regulating cell wall (peptidoglycan) synthesis. Rv3910 encodes for two C-terminal protein domains (an intracellular pseudokinase and an extracellular sugar-binding domain) and an N-terminal MviN-like domain, which is required for the late stages of peptidoglycan biosynthesis (Fig. 4). MviN proteins have been proposed to be involved in the export of the lipid-II precursor, and this Mtb orthologue is regulated by a phosphorylation-dependent interaction with FhaA (Rv0020c) (Gee et al., 2012). Insertions in Rv3910 are found only in the C-terminal domains, but not the N-terminal membrane domain, implying only the latter domain is necessary for growth ( ), based on a run of 34 consecutive non-insertions within its essential domain, spanning 1439 nt, as significant. This has been confirmed experimentally by Gee et al. (2012). Rv0018c (PstP: serine/threonine phosphatase) contains an essential catalytic domain within its N-terminus (Fig. 5), and it has been shown to dephosphorylate Rv0020 (FhaA) counteracting phosphorylation by PknB (Pullen et al., 2004). It contains a run of 12 consecutive non-insertions in the N-terminal catalytic domain, spanning 695 nt, which our method identifies as significant [
 ].
].
Fig. 4.
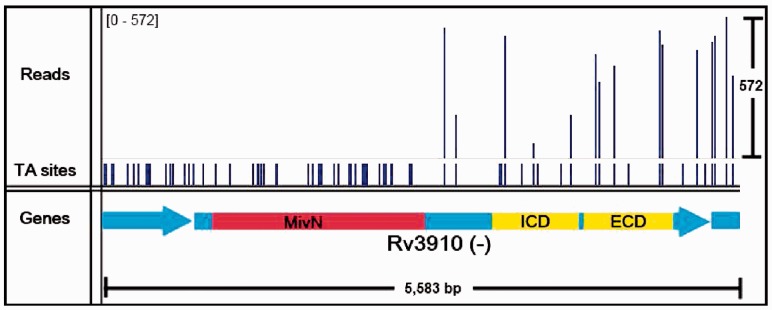
Insertion pattern for Rv3910. The essential MviN domain is shown in red, whereas the non-essential extracellular and intracellular domains are shown in yellow
Fig. 5.

Insertion pattern for Rv0018c. The essential catalytic domain is shown in red
4 DISCUSSION
The availability of next-generation sequencing data for analysing transposon mutagenesis libraries necessitates a new method capable of analysing the high-resolution data and determining essentiality. We developed a Bayesian statistical model that can be used to analyse this data and make rigorous predictions about the essentiality of individual genes, as well as identify stretches of non-insertions indicative of essential domains. Using this method, we have analysed sequence data from a library of mutants of M.tuberculosis bacteria and found high concordance with previous results.
The key insight in our method is the use of the Gumbel distribution to assess the statistical significance of runs of non-insertion that are significantly longer than expected, and, therefore, indicative of essential regions. By highlighting these essential regions, our method can help identify essential domains within genes that might otherwise be missed by characterizing the proportion of insertions alone. An approach based on analysing the size of insertion gaps was suggested by Christen et al. (2011); however, they used a simpler exponential model for assessing statistical significance. Using our method, we found multiple genes with essential domains that match Pfam predictions of domains, and whose essentiality is supported in the literature (e.g. Rv0018c and Rv3910). Moreover, because our method depends on consecutive sub-sequences of TA sites lacking insertions, and not on the simple presence or absence of insertions within a gene, our method is not sensitive to insertions at the N- or C- terminus of a gene, which essential genes have been shown to occasionally tolerate (Akerley et al., 1998; Christen et al., 2011; Smith et al., 1996).
Although previous analyses have used deep-sequencing data to determine essentiality, these have relied on ad hoc criteria to ignore insertions at the N- or C- terminus or have made assumptions about parameters to quantify the confidence of their essentiality predictions. However, by using a Bayesian statistical framework, our method can simultaneously estimate model parameters and posterior probabilities of essentiality without requiring a priori estimates of these unknown variables.
Although our method can successfully determine regions in the genome that contain unusually long gaps lacking any insertions, it does not take the number of reads observed at each site into account (i.e. read counts). Our binary interpretation of the insertion data is based on mere presence or absence of reads, and it ignores any potential information that the number of reads mapping to a particular site might bear. An alternative approach based on quantifying read counts within genomic regions might yield biologically relevant information on essentiality. For example, in another article (Zhang et al., 2012), a model was developed that calculates significance scores for sums of read counts at TA sites using a non-parametric test. This approach yields qualitatively similar results to our model in terms of which genes are classified as essential and non-essential. One advantage of an approach based on read counts is that it could potentially detect genes whose disruption leads to growth defects, in that slower-growing mutants might produce fewer (but non-zero) read in a disrupted gene compared with the expected value. This was exploited to infer genes that play a role in cholesterol catabolism by Griffin et al. (2011). On the other hand, a single overamplified TA site in a region (with an excess of reads because of polymerase chain reaction bias) could lead to misinterpretation, whereas our model would be less sensitive to this kind of noise.
The method we have presented can be used to assess essentiality of genes, as well as intergenic (e.g. regulatory) regions and assign statistical confidence scores, in any organism, provided a transposon mutant library can be constructed and sequenced. Although mutant libraries analysed were constructed using the Himar1 transposon, this method could be used to analyse libraries constructed using the Tn5 transposon, where every nucleotide is a possible insertion site (Langridge et al., 2009). By sampling the probability of non-insertion from its posterior distribution, we can calculate estimates of essentiality for a diversity of mutagenesis experiments.
Funding: Robert A. Welch Foundation (A-0015 to J.C.S., in part); NIH (U01GM094568 to J.C.S., T.R.I. and E.J.R., in part).
Conflict of Interest: none declared.
Supplementary Material
REFERENCES
- Akerley BJ, et al. Systematic identification of essential genes by in vitro mariner mutagenesis. Proc. Natl Acad. Sci. USA. 1998;95:8927–8932. doi: 10.1073/pnas.95.15.8927. [DOI] [PMC free article] [PubMed] [Google Scholar]
- Banu S, et al. Are the PE-PGRS proteins of Mycobacterium tuberculosis variable surface antigens? Mol. Microbiol. 2002;44:9–19. doi: 10.1046/j.1365-2958.2002.02813.x. [DOI] [PubMed] [Google Scholar]
- Blades NJ, Broman KW. Technical report MSU-CSE-00-2. Johns Hopkins University: Department of Biostatistics Working Papers; 2002. Estimating the number of essential genes in a genome by random transposon mutagenesis. [Google Scholar]
- Buchmeier N, Fahey RC. The mshA gene encoding the glycosyltransferase of mycothiol biosynthesis is essential in Mycobacterium tuberculosis Erdman. FEMS Microbiol. Lett. 2006;264:74–79. doi: 10.1111/j.1574-6968.2006.00441.x. [DOI] [PubMed] [Google Scholar]
- Christen B, et al. The essential genome of a bacterium. Mol. Syst. Biol. 2011;7:528. doi: 10.1038/msb.2011.58. [DOI] [PMC free article] [PubMed] [Google Scholar]
- Cole ST, et al. Deciphering the biology of Mycobacterium tuberculosis from the complete genome sequence. Nature. 1998;393:537–544. doi: 10.1038/31159. [DOI] [PubMed] [Google Scholar]
- Ehebauer MT, Wilmanns M. The progress made in determining the Mycobacterium tuberculosis structural proteome. Proteomics. 2011;11:3128–3133. doi: 10.1002/pmic.201000787. [DOI] [PMC free article] [PubMed] [Google Scholar]
- Finn RD, et al. The Pfam protein families database. Nucleic Acids Res. 2010;38:D211–D222. doi: 10.1093/nar/gkp985. [DOI] [PMC free article] [PubMed] [Google Scholar]
- Gawronski JD, et al. Tracking insertion mutants within libraries by deep sequencing and a genome-wide screen for haemophilus genes required in the lung. PNAS. 2009;106:16422–16427. doi: 10.1073/pnas.0906627106. [DOI] [PMC free article] [PubMed] [Google Scholar]
- Gee CL, et al. A phosphorylated pseudokinase complex controls cell wall synthesis in mycobacteria. Sci. Signal. 2012;5:ra7. doi: 10.1126/scisignal.2002525. [DOI] [PMC free article] [PubMed] [Google Scholar]
- Gerdes SY, et al. Experimental determination and system level analysis of essential genes in Escherichia coli MG1655. J. Bacteriol. 2003;185:5673–5684. doi: 10.1128/JB.185.19.5673-5684.2003. [DOI] [PMC free article] [PubMed] [Google Scholar]
- Goyal R, et al. Phosphorylation of PhoP protein plays direct regulatory role in lipid biosynthesis of Mycobacterium tuberculosis. J. Biol. Chem. 2011;286:45197–45208. doi: 10.1074/jbc.M111.307447. [DOI] [PMC free article] [PubMed] [Google Scholar]
- Griffin JE, et al. High-resolution phenotypic profiling defines genes essential for mycobacterial growth and cholesterol catabolism. PLoS Pathog. 2011;7:e1002251. doi: 10.1371/journal.ppat.1002251. [DOI] [PMC free article] [PubMed] [Google Scholar]
- Hasan S, et al. Prioritizing genomic drug targets in pathogens: application to Mycobacterium tuberculosis. PLoS Comput. Biol. 2006;2:e61. doi: 10.1371/journal.pcbi.0020061. [DOI] [PMC free article] [PubMed] [Google Scholar]
- Haydel SE, et al. The prrAB two-component system is essential for Mycobacterium tuberculosis viability and is induced under nitrogen-limiting conditions. J. Bacteriol. 2012;194:354–361. doi: 10.1128/JB.06258-11. [DOI] [PMC free article] [PubMed] [Google Scholar]
- Hayes F. Transposon-based strategies for microbial functional genomics and proteomics. Annu. Rev. Genet. 2003;37:3–29. doi: 10.1146/annurev.genet.37.110801.142807. [DOI] [PubMed] [Google Scholar]
- Kana BD, et al. The resuscitation-promoting factors of Mycobacterium tuberculosis are required for virulence and resuscitation from dormancy but are collectively dispensable for growth in vitro. Mol. Microbiol. 2008;67:672–684. doi: 10.1111/j.1365-2958.2007.06078.x. [DOI] [PMC free article] [PubMed] [Google Scholar]
- Krieger I, et al. Structure-guided discovery of phenyl diketo-acids as potent inhibitors of M. tuberculosis malate synthase. Chem. Biol. 2012;19:1556–1567. doi: 10.1016/j.chembiol.2012.09.018. [DOI] [PMC free article] [PubMed] [Google Scholar]
- Lamichhane G, et al. A postgenomic method for predicting essential genes at subsaturation levels of mutagenesis: Application to Mycobacterium tuberculosis. PNAS. 2003;100:7213–7218. doi: 10.1073/pnas.1231432100. [DOI] [PMC free article] [PubMed] [Google Scholar]
- Lamichhane G, et al. Designer arrays for defined mutant analysis to detect genes essential for survival of Mycobacterium tuberculosis in mouse lungs. Infect. Immun. 2005;73:2533–2540. doi: 10.1128/IAI.73.4.2533-2540.2005. [DOI] [PMC free article] [PubMed] [Google Scholar]
- Lampe DJ, et al. A purified mariner transposase is sufficient to mediate transposition in vitro. Eur. Mol. Biol. Org. J. 1996;15:5470–5479. [PMC free article] [PubMed] [Google Scholar]
- Langridge GC, et al. Simultaneous assay of every salmonella typhi gene using one million transposon mutants. Genome Res. 2009;19:2308–2316. doi: 10.1101/gr.097097.109. [DOI] [PMC free article] [PubMed] [Google Scholar]
- McKinney JD, et al. Persistence of Mycobacterium tuberculosis in macrophages and mice requires the glyoxylate shunt enzyme isocitrate lyase. Nature. 2000;406:735–738. doi: 10.1038/35021074. [DOI] [PubMed] [Google Scholar]
- Muller P, Parmigiani G, Rice K. Proceedings of the ISBA 8th World Meeting on Bayesian Statistics. Benidorm, Spain: 2006. FDR and Bayesian multiple comparisons rules. [Google Scholar]
- Pullen KE, et al. An alternate conformation and a third metal in PstP/Ppp, the M. tuberculosis PP2C-Family Ser/Thr protein phosphatase. Structure. 2004;12:1947–1954. doi: 10.1016/j.str.2004.09.008. [DOI] [PubMed] [Google Scholar]
- Read R, et al. The role of GlnD in ammonia assimilation in Mycobacterium tuberculosis. Tuberculosis (Edinb) 2007;87:384–390. doi: 10.1016/j.tube.2006.12.003. [DOI] [PMC free article] [PubMed] [Google Scholar]
- Rubin EJ, et al. In vivo transposition of mariner-based elements in enteric bacteria and mycobacteria. PNAS. 1999;96:1645–1650. doi: 10.1073/pnas.96.4.1645. [DOI] [PMC free article] [PubMed] [Google Scholar]
- Sassetti CM, Rubin EJ. Genetic requirements for mycobacterial survival during infection. PNAS. 2003;100:12989–12994. doi: 10.1073/pnas.2134250100. [DOI] [PMC free article] [PubMed] [Google Scholar]
- Sassetti CM, et al. Genes required for mycobacterial growth defined by high density mutagenesis. Mol. Microbiol. 2003;48:77–84. doi: 10.1046/j.1365-2958.2003.03425.x. [DOI] [PubMed] [Google Scholar]
- Schilling MF. The longest run of heads. Coll. Math. J. 1990;21:196–207. [Google Scholar]
- Smith V, et al. Functional analysis of the genes of yeast chromosome V by genetic footprinting. Science. 1996;274:2069–2074. doi: 10.1126/science.274.5295.2069. [DOI] [PubMed] [Google Scholar]
- Wheelan SJ, et al. Domain size distributions can predict domain boundaries. Bioinformatics. 2000;16:613–618. doi: 10.1093/bioinformatics/16.7.613. [DOI] [PubMed] [Google Scholar]
- Williams KJ, et al. The Mycobacterium tuberculosis -oxidation genes echA5 and fadB3 are dispensable for growth in vitro and in vivo. Tuberculosis (Edinb) 2011;91:549–555. doi: 10.1016/j.tube.2011.06.006. [DOI] [PMC free article] [PubMed] [Google Scholar]
- Zhang YJ, et al. Global assessment of genomic regions required for growth in Mycobacterium tuberculosis. PLoS Pathog. 2012;8:e1002946. doi: 10.1371/journal.ppat.1002946. [DOI] [PMC free article] [PubMed] [Google Scholar]
- Zomer A, et al. ESSENTIALS: software for rapid analysis of high throughput transposon insertion sequencing data. PLoS One. 2012;7:e43012. doi: 10.1371/journal.pone.0043012. [DOI] [PMC free article] [PubMed] [Google Scholar]
Associated Data
This section collects any data citations, data availability statements, or supplementary materials included in this article.