Abstract
To determine if differences in topographic progression between unaffected keratoconus relatives and normal controls can predict factors associated with the development of keratoconus in a longitudinal study.
We recruited 369 unaffected keratoconus relatives and 119 normal controls in Los Angeles. Both eyes of subjects were examined at baseline clinically and by quantitative videokeratography and at a period ranging from 1 year to 8 years. Progression to keratoconus was evaluated by quantitative videokeratography variables.
Unaffected relatives had higher Central K (CK), I-S and KISA values and were younger than normal controls (CK: 44.70 vs 44.01, P<0.01; I-S: 0.76 vs 0.58, P<0.01, KISA: 29.97 vs 23.89, P=0.02; age: 34.8 vs 41.0, P<0.01) at baseline. All three indices significantly increased with age, and CK and KISA values were associated with a positive family history for keratoconus (P<0.001 for CK and P=0.05 for KISA), however, the two groups were not statistically different in progression of keratoconus. After grouped unaffected relatives as the high risk (age<=30 or Central K>=47.2 or I-S >=1.2 or KISA>=60) and the low risk (age>30 and Central K<47.2 and I-S <1.2 and KISA<60), relatives in the high risk group had a greater increase in CK and I-S values than those in the low risk group (CK: p=0.009; I-S: p<0.001), which indicated that there were significantly different rates of progression between two groups.
Unaffected relatives had higher videokeratography indices than normal controls, but overall they did not progress to keratoconus quicker than normal controls. However, relatives in a high risk group may have a greater risk of progression to keratoconus.
Keywords: keratoconus, progression, videokeratography
Introduction
Keratoconus is a clinical term used to describe a condition in which the cornea assumes a conical shape as a result of non-inflammatory thinning and protrusion. The estimated prevalence of keratoconus is about 50-230/100,000 in the general population (Rabinowitz, 1998). The age of onset is at puberty and the disorder is progressive until the third to fourth decade of life, when it usually arrests. It is a major indication for cornea transplantation in developed countries (Lois, 1997; Liu, 1997). The underlying biochemical processes and its cause remain poorly understood (Rabinowitz, 1998).
Although the etiology of keratoconus is still unknown, there is increasing evidence that supports a genetic basis for keratoconus (Rabinowitz, 2003; Wang et al, 2000; Edwards et al, 2001). Approximately 6-24% of cases reported in literature demonstrate clinically recognized familial aggregation (Rabinowitz, 2003; Edwards et al, 2001). Both dominant and recessive models have been observed in individual keratoconus pedigrees (Wang et al, 2000; Falls and Allen, 1969). In the vast majority of cases (in excess of 90%) keratoconus is bilateral. In many cases the disorder may start of unilateral, but over time the other eye becomes involved (Holland et al, 1997). This bilaterality also lends its support to a genetic basis for this disease. In addition, segregation analyses (Wang et al, 2000), twin studies (Zadnik et al, 1984), and gene mapping studies (Tyynismaa et al, 2002; Brancati et al, 2004; Hutchings et al, 2005; Tang et al, 2005; Li et al, 2006) have also indicated the important role of genetic factors.
Computer-assisted videophotokeratoscopy(VK) represent a sensitive means for detecting subtle changes of topography on the corneal surface and allows for detailed qualitative and quantitative analysis of corneal shape (Klyce, 1984; Rabinowitz and Rasheed, 1999) . Because placido disk based computer videokeratoscopes have the combined features of both a keratometer and photokeratoscope, recording curvature changes in both the central and paracentral cornea, they are well suited for detecting subtle topographic changes present in ‘early’ keratoconus and for documenting serial changes in corneal curvature over time (Wilson and Klyce, 1991; Maguire and Bourne, 1989; Maguire and Lowry, 1991). In recent years, several quantitative indices that assign numeric values to certain topographic patterns have been developed to reduce interpretation of complicated videokeratographs into more manageable easily interpretable quantitative indices (Rabinowitz and Rasheed, 1999; Wilson and Klyce, 1991; Maeda et al, 1994) . We have previously demonstrated that certain VK indices (Central K, I-S and KISA) are significantly increased in keratoconus patients and unaffected relatives of keratoconus patients (positive family history of keratoconus) as compared with normal controls (Wang et al, 2000). Thus, the progression of these indices may be an early sign of the development of keratoconus.
The purpose of this study was 1) to predict the factors associated with keratoconus progression of VK indices; and 2) to determine the difference between unaffected keratoconus relatives and normal controls in keratoconus progression in a longitudinal study.
Materials and Methods
Subjects
We prospectively recruited 369 clinically normal subjects with a positive keratoconus family history (unaffected keratoconus relatives) and 119 normal controls as a part of a longitudinal videokeratography and genetic study at the Cedars-Sinai Medical Center, Los Angeles, California. Institutional Review Board (IRB)/Ethics Committee approval was obtained.
The diagnosis of keratoconus was based on clinical examination and confirmed by videokeratography. Any subject who was clinically normal at baseline by clinical examination but had at least one relative diagnosed as clinical keratoconus was defined as a unaffected keratoconus relative, ie, an individual with a positive family history of keratoconus. Among 369 keratoconus relatives, 316 (85.6%) were first degree relatives (parent, sib and child), 42 (12.5%) were second degree relatives (grandparent, grandchild, uncle, aunt, nephew, and niece) and only 7 (1.9%) were third degree of relatives (first cousin).
Normal controls, with no known clinical evidence and no family history of keratoconus, were recruited from spouses or acquaintances of keratoconus patients, as well as employees of Cedars-Sinai Medical Center.
All keratoconus relatives and controls underwent clinical and videokeratography evaluation (Li et al, 2004). The clinical examinations included slit-lamp biomicroscopy, retinoscopy examinations, and fundus evaluation.
All subjects were followed longitudinally during the period 1993 to January 2004, with a minimum of two visits. Keratoconus relatives were examined annually by both clinical and videokeratography evaluation.
Videokeratography Measurements
Videokeratography was performed on both eyes of each subject with the Topographic Modeling System (TMS-1) (software version 1.61, Computed Anatomy, Inc., New York, NY) at baseline and each time during the follow-up visit. At least four pictures were taken of each eye to ensure the reproducibility of video images. The best videokeratograph of the four was selected based on the quality of the keratoscope photos by visual inspection.
Quantitative VK indices of CK, I-S and KISA on each eye were generated from the TMS-1. These have been described in detail elsewhere (Rabinowitz and Rasheed, 1999; Rabinowitz et al, 1996; Rabinowitz and McDonell, 1989).
Central K (CK) was calculated by averaging the dioptric power points on rings 2, 3, and 4 of the videokeratographs generated by the TMS-1.
I-S value, the amount of steepening of the inferior cornea compared with that of the superior cornea, was calculated by subtracting superior value from the inferior value.
KISA index was derived from 4 indices including the Central K value; the I-S value; and the AST index, which quantifies the degree of the regular corneal astigmatism (SimK1 – SimK2) as well as the skewed radial axis (SRAX) index, an expression of irregular astigmatism occurring in keratoconus. The algorithm for calculating the KISA index was initially derived as follows:
All the indices above have previously been described in detail in the peer reviewed literature (Rabinowitz and Rasheed, 1999; Rabinowitz et al, 1996; Rabinowitz and McDonell, 1989).
Statistical Methods
All data including demographic information, clinical examination and videokeratographic measures were entered into a relational database. Statistical analyses were performed with SAS version 8.0 (SAS Institute Ins, 1999). For quantitative traits, comparisons between two groups were tested by the Student t-test when variables had a normal distribution or by non-parametric Wilcoxon rank test when traits deviated from normal distribution. Logarithm transformation was used for I-S and KISA to obtain normal distribution for the statistical analysis. We used the chi-square test to compare proportions of qualitative traits between groups.
In order to estimate whether subjects developed keratoconus differently by VK indices over time, mixed effect linear models were used to account for intra-subject and intra-family correlations (Little, 1996). Using each quantitative index as a dependent variable, group variable, centered age during the follow-up, and their interaction were treated as fixed effects. Thus, the interaction term was used to represent the difference in progression. In addition, to refine our analysis, we took into consideration that not all relatives will develop keratoconus, by subdividing relatives based on their baseline VK index values and age. We grouped subjects into three groups: keratoconus relatives with high risk (age<=30 or CK>=47.2 or I-S >=1.2 or KISA>=60, noted as FH), keratoconus relatives with low risk (age>30 and CK<47.2 and I-S <1.2 and KISA<60, noted as FL), and normal controls, and compared the difference of progression between FH, FL and normal controls. The cutoff point of CK and I-S was based on the 2 standard deviations from normal subjects. KISA greater than 60 or age younger than 30 had clinical importance since subjects in any of these criteria had high risk for developing keratoconus. The interaction term was used to interpret the progression rate for the group variable. Repeated measures within subject were modeled using the spatial power structure which can estimate the covariance between two repeated measures at unequal follow-up intervals. Additional correlation of subjects within family and measures of two eyes within subject were modeled using random effects. In order to minimize the variation of age, centered age was used in the analysis which defined as age minus 30 because age younger than 30 is important for keratoconus progression. Gender and race were considered as possible covariates.
Results
Comparison between unaffected keratoconus relatives and normal controls at baseline
The median age in keratoconus relatives (32, range: 6-74) was lower than that in normal controls (39, range: 23-74), p<0.01. There were more Hispanics and fewer Blacks in keratoconus relatives (28% and 7%) than in controls (18% and 14%), p<0.01. No significant difference in gender (61% and 62% males in keratoconus relatives and normal controls) was found between two groups. Keratoconus relatives had higher CK and I-S values as compared with normal controls (CK: 44.70 vs 44.01; I-S: 0.76 vs 0.58; all p<0.01) at baseline (Table 1). After adjusting for age, gender and race, CK and I-S remained significant and KISA values were also significantly higher in keratoconus relatives (p=0.02). There was no significant difference in the time of follow-up between the two groups (keratoconus relatives: 4.0±2.1 years; normal controls: 3.8±2.5, P=0.29).
Table 1.
Videokeratography indices of unaffected keratoconus relatives and normal controls at the baseline (mean±SD)
| Variables | Relatives |
Normal | P (adjusted p )† | ||
|---|---|---|---|---|---|
| FH* (N=244) |
FL* (N=125) |
Total (N=369) |
controls (N=119) |
||
| CK | 44.76±1.68 | 44.59±1.27 | 44.70±1.55 | 44.01±1.41 | <0.01 (<0.01)† |
| I-S | 0.83±0.64 | 0.62±0.34 | 0.76±0.56 | 0.58±0.39 | <0.01 (<0.01) † |
| KISA | 33.88±38.18 | 22.34±16.92 | 29.97±33.00 | 23.89±19.36 | 0.19 (0.02) † |
FH: keratoconus relatives with high risk (age<30 or Central K>=47.2 or I-S >=1.2 or KISA>=60), other relatives were defined as low risk, i.e. FL.
Comparison was conducted between normal controls and all unaffected relatives. Univariate p value was estimated by student t-test for the indices with normal distribution and Wilcoxon rank test for the indices without normal distribution. Since the univariate comparison may not been meaningful because of the difference of age distribution, we conducted the tests again after adjustment for covariates. After adjusting for covariates, ie, age, gender and race, indices are significantly higher in the group with keratoconus family history, all p<0.05.
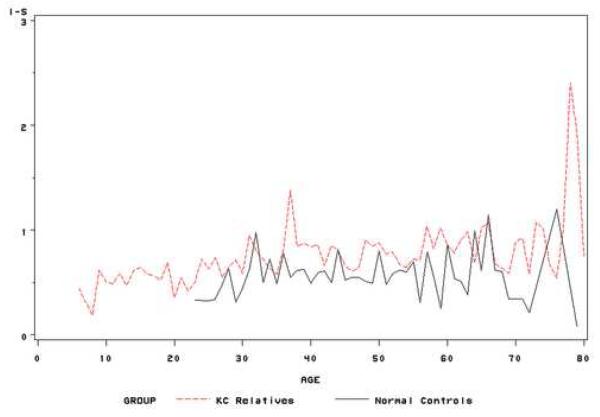
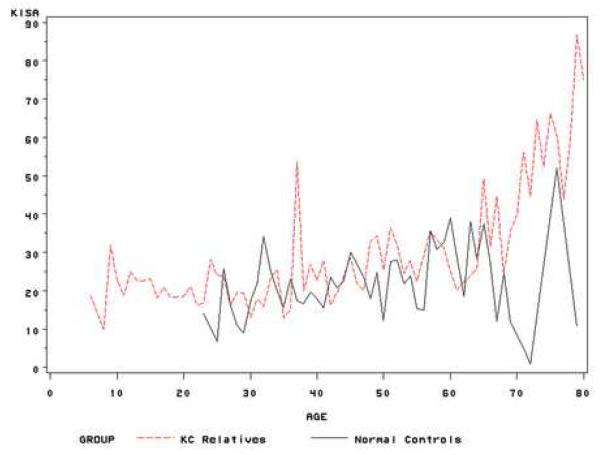
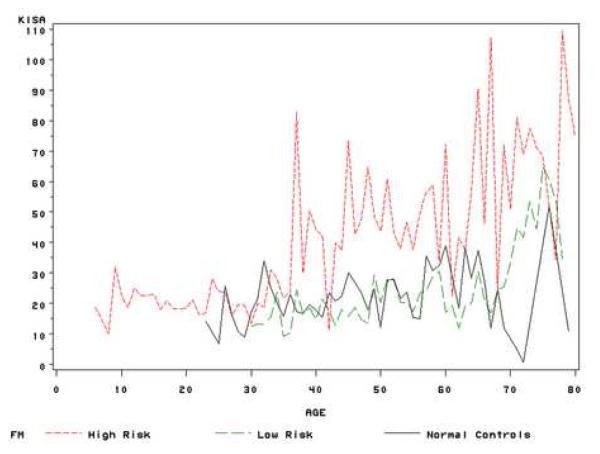
Using all subjects and their follow-up points, we estimated the means of the quantitative index values at each age stage (range: 8-79). Thus, subjects with multiple follow-up points contributed multiple times for this estimation. Although the means estimation at each age stage was sensitive to the sample size at this point, the curve of means of VK indices at each age stage could simply illustrate of nature history of these indices. Figure 1 showed the trend of three indices during the life time using the estimated means of these index values at each age stage. In general, the average CK and I-S are higher in keratoconus relatives than in normal controls at each age point. A similar trend is found for KISA index, though the variations are higher.
Figure 1.
(a) Mean of CK values at each age stage for unaffected keratoconus relatives and normal controls;
(b) Mean of I-S values at each age stage for unaffected keratoconus relatives and normal controls;
(c) Mean of KISA values at each age stage for unaffected keratoconus relatives and normal controls.
Predictive factors associated with keratoconus progression
In order to identify factors that may predict the progression of keratoconus, we evaluated the association between VK indices during the follow-up and possible predictive variables, including age at baseline, duration of follow-up, family history, gender, race and baseline CK, I-S and logKISA values. All three baseline indices were significantly associated with progression (all p<0.001). Family history of keratoconus were positively associated with CK (p=0.06) and KISA (p=0.04) at the borderline significance. Either baseline age and/or time of follow-up increased with VK indices. Thus, baseline CK, I-S and KISA values, positive family history and age during the time of follow-up were possible predictive factors of keratoconus progression.
Progression between unaffected keratoconus relatives and normal controls
To estimate the genetic influence on keratoconus progression, we refined the analysis considering baseline VK indices and age and time of follow-up. After incorporated the baseline age and time of follow-up together, we used family history and centered age during follow-up (time), as well as their interaction as the fixed effects in a mixed model. The interaction term was used to estimate the difference of progression between two groups. Time was significant in the model before and after adjusting for the covariates for all indices (all p<0.01). After removing the non-significant covariates, the only covariate that remained in the final models was gender for keratoconus and KISA (Table 2). Table 2 shows the fixed effects estimates of the final models for each index. Thus, after adjusting for covariates, both CK, and KISA were higher at each age stage in keratoconus relatives and all three indices increased over time in both groups, but not at a significantly different rate.
Table 2.
The final models for CK, I-S and KISA comparing unaffected keratoconus relatives and normal controls by the mixed model
| Index | Fixed effects | Coefficient | SE | P value |
|---|---|---|---|---|
| CK | Intercept | 44.72 | 0.08 | <0.001 |
|
|
||||
| Family history | 0.69 | 0.17 | <0.001 | |
| Centered age | 0.007 | 0.002 | 0.003 | |
| Interaction* | −0.03 | 0.008 | 0.68 | |
| Gender | −0.63 | 0.08 | <0.001 | |
|
| ||||
| Log(I-S) | Intercept | −0.38 | 0.02 | <0.001 |
| Family history | 0.06 | 0.04 | 0.13 | |
| Centered age | 0.004 | 0.001 | <0.001 | |
| Interaction* | 0.003 | 0.002 | 0.25 | |
| Log(KISA) | Intercept | 1.03 | 0.02 | <0.001 |
| Family history | 0.09 | 0.05 | 0.05 | |
| Centered age | 0.004 | 0.001 | <0.001 | |
| Interaction* | 0.001 | 0.003 | 0.59 | |
| Gender | 0.13 | 0.03 | <0.00 | |
Centered age by family history.
Progression between unaffected keratoconus relatives of high risk (FH), low risk (FL) and normal controls
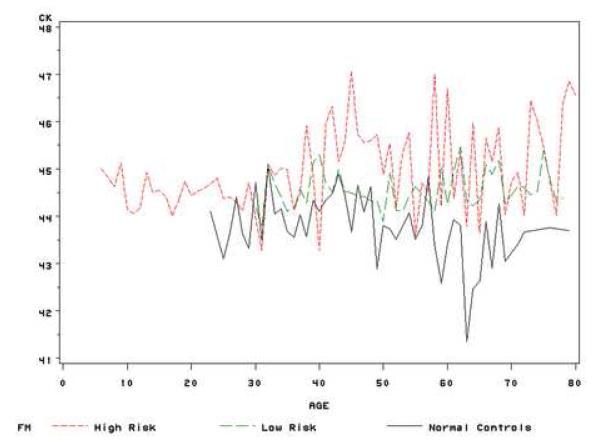
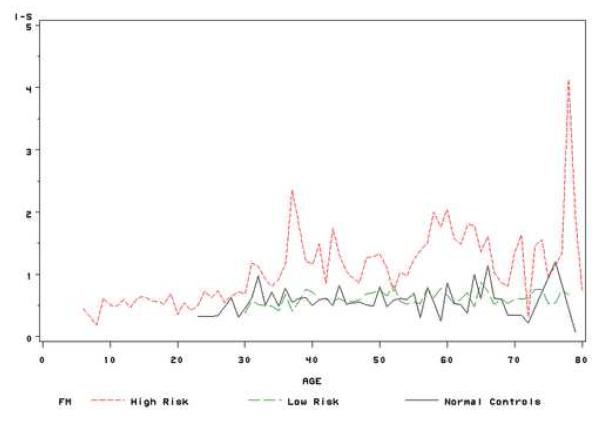
After subjects were assigned into three study groups: FH (age<=30 or CK>=47.2 or I-S >=1.2 or KISA>=60), FL (age>30 and CK<47.2 and I-S <1.2 and KISA<60) and normal controls, we tested the difference of progression between groups using the mixed model. Similar method as above, the interaction term of group and centered age during follow-up (time) in the mixed model represented the difference of progression between groups. After adjusting for gender and race, CK, I-S and KISA increased over time in all groups, but the increase was greater in the high risk group at each age compared with the other two groups, and both CK and I-S values showed significant differences in the rate of change among the groups. The keratoconus relatives with high risk had a greater increase in I-S values than those in the low risk group (FH vs FL: p<0.001) and normal controls (FH vs normal controls: p<0.001), while FH group also had a higher progression rate in CK values than those in FL group (p=0.009) (Table 3). Similar method as used in figure 1, figure 2 showed the average VK values of three groups during the life time. In general, the trends of three indices during the lifetime were similar between FL group and normal controls; while these values increased faster in the high risk group. These results indicate that keratoconus relatives with high risk factors, such as CK>=47.2 or I-S >=1.2 or KISA>=60 and at a young age (<30), may have a greater risk to progress to keratoconus than other relatives. Thus, these indices might be useful for early detection of individual family members at risk for keratoconus.
Table 3.
Multivariate analysis for progression to keratoconus related VK indices by the mixed model
| CK | I-S | KISA | ||||
|---|---|---|---|---|---|---|
|
| ||||||
| Coefficient† | P | Coefficient | P | Coefficient | P | |
| FH* vs Controls | 0.005 | 0.52 | 0.008 | <0.001 | 0.002 | 0.48 |
| FH vs FL* | 0.017 | 0.009 | 0.007 | <0.001 | −0.004 | 0.15 |
FH: keratoconus relatives with high risk (age<30 or Central K>=47.2 or I-S >=1.2 or KISA>=60), other relatives were defined as low risk, i.e. FL
Interaction term of centered age by group, which indicated the difference of progression rate.
Figure 2.
(a) Mean of CK values at each age stage for high risk relatives, low risk relatives and normal controls;
(b) Mean of I-S values at each age stage for high risk relatives, low risk relatives and normal controls;
(c) Mean of KISA values at each age stage for high risk relatives, low risk relatives and normal controls.
Discussion
The results of this longitudinal study indicate that: 1) unaffected keratoconus relatives have higher CK, I-S and KISA values than normal controls; and 2) relatives as a whole (not subdivided by age) do not progress at a statistically significant rate compared to normal controls, however, if subdividing these relatives by age and videokeratography variables, a subgroup of relatives are at higher risk of progression to keratoconus.
The use of quantitative videokeratography derived indices potentially represents a more reproducible way of quantifying keratoconus and its early phenotypes (Wilson and Klyce, 1991). Some studies suggest that topographic features might be useful in detecting keratoconus prior to the development of the slit lamp findings (Maguire and Bourne, 1989; Rabinowitz et al, 1990) . Several quantitative indices such as KPI, KCI%, CK, I-S and KISA have been used (Klyce, 1984; Rabinowitz and Rasheed, 1999; Rabinowitz and McDonnell, 1989). Rabinowitz et al (1990) developed three indices (CK, I-S and R versus L) and distinguished eyes with keratoconus from normals in a small preliminary study (28 family members of five patients with keratoconus). Their results supported that these three indices may be the descriptor of the earliest stages of keratoconus. However, the sensitivity and accuracy of quantitative indices for studying sub clinical changes and early keratoconus still needed to be confirmed by longitudinal studies and serial topographic analysis.
Using a longitudinal study design, our study provides useful information about the value of three quantitative indices: CK, I-S and KISA. All three indices increased during the life time and both CK and I-S increased at a higher rate in keratoconus high risk relatives than that in low risk relatives. In a previous study we demonstrated that I-S and KISA progressed quicker to keratoconus in the clinically normal fellow eyes of unilateral keratoconus patients (Li et al, 2004). We have not as yet exhaustively examined all quantitative indices for early keratoconus, however our studies suggests that all these indices may be valuable adjuncts for identifying the early stages of keratoconus by videokeratography before they progress to clinical keratoconus.
Using the baseline data only, we found that keratoconus unaffected relatives had higher values of all indices than those eyes of normal subjects. In addition, both CK and KISA showed a trend of association with the positive family history, but the p values were at the borderline. This indicates that genetic factors may play an important role, which is consistent with other genetic studies of keratoconus. To date, no studies have focused on the progression of keratoconus with family history using longitudinal data. Although most indices are higher in family members than normal controls during their lifetime, using these indices, progression to clinical keratoconus is not significantly different between two groups as a whole. However, after we grouped keratoconus relatives into a high risk group and a low risk group, the progression rate to keratoconus was significantly different in the high risk group. Thus, we suggest that the genetic factors are important in keratoconus etiology at early ages, and then lead those high risk subjects to progress to keratoconus faster than others.
We know very little about the underlying mechanisms causing ectasia. We assume however that the cornea thins because of an abnormality in corneal collagen crosslinking and subsequent stromal thinning resulting in protrusion or ectasia. While a genetic link has not been clearly demonstrated, formal genetic studies (segregation analyses) suggest that genetics plays a major role in the pathogenesis. Several molecular genetic studies are currently ongoing to try and identify mutations in families with keratoconus. While no mutations have been reported to date, recently several promising genetic loci have been identified (Wang et al, 2000; Tang et al, 2005; Li et al, 2006).
Further longitudinal studies in a larger population sample over a longer period of time are needed to confirm these preliminary findings, regarding quantitative indices and videokeratography patterns, as predictors for the development of keratoconus. Such studies are currently in progress.
Acknowledgments
Contract Grant Sponsor: Supported by the National Eye Institute, the National Institutes of Health and the Eye Birth Defects Research Foundation Inc;
Contract Grant Number: NEI 09052, GCRC NIH 50091.
Footnotes
Publisher's Disclaimer: This is a PDF file of an unedited manuscript that has been accepted for publication. As a service to our customers we are providing this early version of the manuscript. The manuscript will undergo copyediting, typesetting, and review of the resulting proof before it is published in its final citable form. Please note that during the production process errors may be discovered which could affect the content, and all legal disclaimers that apply to the journal pertain.
Reference
- Brancati F, Valente EM, Sarkozy A, Feher J, Castori M, Del Duca P, Mingarelli R, Pizzuti A, Dallapiccola B. A locus for autosomal dominant keratoconus maps to human chromosome 3p14-q13. J. Med. Genet. 2004;41:188–92. doi: 10.1136/jmg.2003.012872. [DOI] [PMC free article] [PubMed] [Google Scholar]
- Edwards M, McGhee CN, Dean S. The genetics of keratoconus. Clin.Exp. Ophthalmol. 2001;29:345–351. doi: 10.1046/j.1442-9071.2001.d01-16.x. [DOI] [PubMed] [Google Scholar]
- Falls HF, Allen AW. Dominantly inherited keratoconus. Journal of Genetic Human. 1969;17:317–324. [PubMed] [Google Scholar]
- Holland DR, Maeda N, Hannush SB, Riveroll LH, Green MT, Klyce SD, Wilson SE. Unilateral keratoconus: incidence and quantitative topographic analysis. Ophthalmology. 1997;104:1409–13. doi: 10.1016/s0161-6420(97)30123-7. [DOI] [PubMed] [Google Scholar]
- Hutchings H, Ginisty H, Le Gallo M, Levy D, Stoesser F, Rouland JF, Arne JL, Lalaux MH, Calvas P, Roth MP. Identification of a new locus for isolated familial keratoconus at 2p24. J. Med. Genet. 2005;42:88–94. doi: 10.1136/jmg.2004.022103. [DOI] [PMC free article] [PubMed] [Google Scholar]
- Klyce SD. Computer-assisted corneal topography: high-resolution graphic presentation and analysis of keratoscopy. Invest. Ophthalmol. Vis. Sci. 1984;25:1426–35. [PubMed] [Google Scholar]
- Li X, Rabinowitz YS, Rasheed K, Yang H. Longitudinal study of the normal eyes in unilateral keratoconus. Ophthalmology. 2004;111:440–6. doi: 10.1016/j.ophtha.2003.06.020. [DOI] [PubMed] [Google Scholar]
- Li X, Rabinowitz YS, Tang YG, Picornell Y, Taylor KD, Hu M, Yang H. Two-stage genome-wide linkage scan in keratoconus sib pair families. Invest. Ophthalmol. Vis. Sci. 2006;47:3791–5. doi: 10.1167/iovs.06-0214. [DOI] [PubMed] [Google Scholar]
- Little RC. SAS System for Mixed Model. SAS Institute Ins; Cary: 1996. pp. 1–633. [Google Scholar]
- Liu E, Slomovic AR. Indications for penetrating keratoplasty in Canada, 1986-1995. Cornea. 1997;16:414–9. [PubMed] [Google Scholar]
- Lois N, Kowal VO, Cohen EJ, Rapuano CJ, Gault JA, Raber IM, Laibson PR. Indications for penetrating keratoplasty and associated procedures, 1988-1995. Cornea. 1997;16:623–9. [PubMed] [Google Scholar]
- Maeda N, Klyce SD, Smolek MK, Thompson HW. Automated keratoconus screening with corneal topography analysis. Invest. Ophthalmol. Vis. Sci. 1994;35:2749–57. [PubMed] [Google Scholar]
- Maguire LJ, Bourne WM. Corneal topography of early keratoconus. Am. J. Ophthalmol. 1989;108:107–12. doi: 10.1016/0002-9394(89)90001-9. [DOI] [PubMed] [Google Scholar]
- Maguire LJ, Lowry JC. Identifying progression of subclinical keratoconus by serial topography analysis. Am. J. Ophthalmol. 1991;112:41–5. doi: 10.1016/s0002-9394(14)76210-5. [DOI] [PubMed] [Google Scholar]
- Rabinowitz YS, McDonnell PJ. Computer-assisted corneal topography in keratoconus. Refractive & Corneal Surgery. 1989;5:400–8. [PubMed] [Google Scholar]
- Rabinowitz YS, Garbus J, McDonnell PJ. Computer-assisted corneal topography in family members of patients with keratoconus. Arch. Ophthalmol. 1990;108:365–71. doi: 10.1001/archopht.1990.01070050063032. [DOI] [PubMed] [Google Scholar]
- Rabinowitz YS, Yang H, Brickman Y, Akkina J, Riley C, Rotter JI, Elashoff J. Videokeratography database of normal human corneas. Brit. J. Ophthalmol. 1996;80:610–6. doi: 10.1136/bjo.80.7.610. [DOI] [PMC free article] [PubMed] [Google Scholar]
- Rabinowitz YS. Keratoconus. Surv. of Ophthalmol. 1998;42:297–319. doi: 10.1016/s0039-6257(97)00119-7. [DOI] [PubMed] [Google Scholar]
- Rabinowitz YS, Rasheed K. KISA% index: a quantitative videokeratography algorithm embodying minimal topographic criteria for diagnosing keratoconus. J. Cataract. Refr. Surg. 1999;25:1327–35. doi: 10.1016/s0886-3350(99)00195-9. [DOI] [PubMed] [Google Scholar]
- Rabinowitz YS. The genetics of keratoconus. Ophthalmology Clinic of North America. 2003;16:607–620. doi: 10.1016/s0896-1549(03)00099-3. [DOI] [PubMed] [Google Scholar]
- SAS Insititute Ins . SAS/STAT User’s Guide. Version 8 SAS Institute Ins; Cary: 1999. [Google Scholar]
- Tang Y, Rabinowitz YS, Taylor KD, Li X, Hu M, Picornell Y, Yang H. A genomewide linkage scan in a multi-generation Caucasian pedigree identifies a novel susceptibility locus for keratoconus on chromosome 5q14.3-q21.1. Genet. Med. 2005;7:397–405. doi: 10.1097/01.gim.0000170772.41860.54. [DOI] [PubMed] [Google Scholar]
- Tyynismaa H, Sistonen P, Tuupanen S, Tervo T, Dammert A, Latvala T, Alitalo T. A locus for autosomal dominant keratoconus: linkage to 16q22.3-q23.1 in Finnish families. Invest. Ophthalmol. Vis. Sci. 2002;43:3160–4. [PubMed] [Google Scholar]
- Wang Y, Rabinowitz YS, Rotter JI, Yang H. Genetic epidemiological study of keratoconus: evidence for major gene determination. Am. J. Med. Genet. 2000;93:403–409. [PubMed] [Google Scholar]
- Wilson SE, Klyce SD. Quantitative descriptors of corneal topography: a clinical study. Arch. Ophthalmol. 1991;109:349–53. doi: 10.1001/archopht.1991.01080030051037. [DOI] [PubMed] [Google Scholar]
- Zadnik K, Mannis MJ, Johnson CA. An analysis of contrast sensitivity in identical twins with keratoconus. Cornea. 1984;3:99–103. [PubMed] [Google Scholar]


