

Abstract
During tissue morphogenesis, simple epithelial sheets undergo folding to form complex structures. The prevailing model underlying epithelial folding involves cell shape changes driven by Myosin-dependent apical constriction1. Here we describe an alternative mechanism that requires differential positioning of adherens junctions controlled by modulation of epithelial apical-basal polarity. Using live embryo imaging, we show that prior to the initiation of dorsal transverse folds during Drosophila gastrulation, adherens junctions shift basally in the initiating cells, but maintain their original subapical positioning in the neighboring cells. Junctional positioning in the dorsal epithelium depends on the polarity proteins Bazooka and Par-1. In particular, the basal shift that occurs in the initiating cells is associated with a progressive decrease in Par-1 levels. We show that uniform reduction of the activity of Bazooka or Par-1 results in uniform apical or lateral positioning of junctions and in each case dorsal fold initiation is abolished. In addition, an increase in the Bazooka/Par-1 ratio causes formation of ectopic dorsal folds. The basal shift of junctions not only alters the apical shape of the initiating cells, but also forces the lateral membrane of the adjacent cells to bend toward the initiating cells, thereby facilitating tissue deformation. Our data thus establish a direct link between modification of epithelial polarity and initiation of epithelial folding.
The anterior and posterior dorsal transverse folds, or the dorsal folds, are epithelial folds that form on the dorsal side of the gastrulating Drosophila embryo at stereotypical locations coincident with the second and fifth stripes of the Runt expression (Fig. 1a-f, Supplementary Movie 1, Supplementary Fig. 1a). While the anterior fold is eventually shallow and the posterior fold deep, the initial cell shape changes are similar in both and the underlying mechanisms appear to be cell-autonomous (Supplementary Movies 2, 3, Supplementary Fig. 1b, c).
Figure 1.

Morphology and cellular dynamics during dorsal fold formation. a, b, Scanning electron micrographs of the dorsal surface in an early (a) and a late (b) Drosophila gastrula. c-f, Confocal mid-sagittal sections of Neurotactin (green) and Runt (red) immunofluorescence in an early (c) and a late (d) gastrula. e, f, A magnified view of the highlighted areas in c and d. AF, anterior fold. CF, cephalic furrow. PF, posterior fold. PMG, posterior midgut. R2, second stripe of Runt. R5, fifth stripe of Runt. g, Two-photon time-lapse mid-sagittal section of E-Cadherin-GFP. Arrows, junctions of initiating cells in the anterior (pink) and posterior (cyan) folds undergo basal shift. h, Two-photon time-lapse mid-sagittal section of E-Cadherin-GFP and Resille-GFP in a posterior fold initiating cell with manual traces of cell outlines (green) and junctional position (red). Scale bars, 10 μm. i, 3-D rendering of a posterior fold based on Neurotactin immunofluorescence with an initiating cell is highlighted in gray (left panel, orange patches depict thresholded Bazooka staining). The Bazooka staining is used to subdivide the cell into the apical (orange) and basal (yellow) domains (right panel). j-l, Scatter plots of the average length, volume and surface area of apical domain against the average total cell length in a series of fixed late cellularizing embryos with solid and dashed trend lines for the initiating and neighboring cells. Error bars indicate s.d.
We monitored cell shape changes using two-photon laser scanning microscopy in live embryos that express a membrane marker Resille-GFP. Optical sectioning of embryos at the mid-sagittal plane reveals that two stripes of dorsal cells, each three to seven cells wide, narrow their apices and shorten cell length during early gastrulation, producing two clefts on the dorsal surface that represent the first morphological signs of dorsal fold formation (Supplementary Fig. 2a, Supplementary Movie 4, see also Fig. 4b for measurements of shortening). Cells that undergo apical narrowing retain dome-like apices (Supplementary Fig. 2b), contrasting the flattened apical surface caused by apical constriction during Drosophila ventral furrow formation2.
Figure 4.
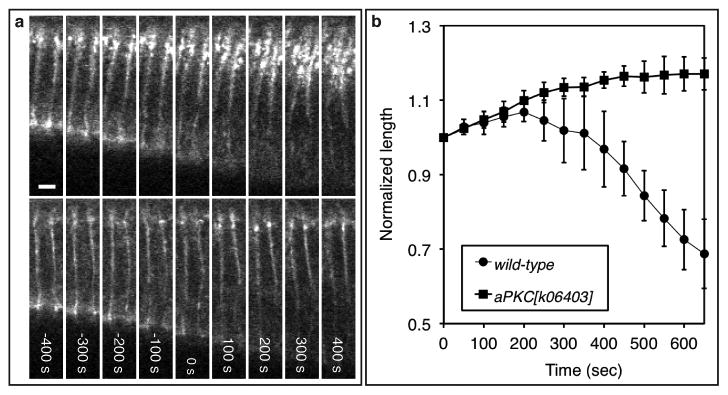
Loss of aPKC results in an expansion of the junctional domain and a failure to shorten the initiating cells. a, Two photon time-lapse images of E-Cadherin-GFP in an initiating (upper) and a neighboring cell (lower) in an aPKC mutant embryo. Scale bars, 5 μm. b, A time-course analysis of normalized cell length of the initiating cells in the wild-type (n = 5) and aPKC mutant (n = 4) embryos. Error bar indicates s.d.
We sought to identify dynamic cellular processes that precede cell shape changes. Unlike the canonical mode of epithelial folding in which spatially restricted activation of the molecular motor Myosin II drives localized apical constriction to initiate tissue deformation1,3, the basal levels of apical Myosin remain low and constant across the dorsal epithelium throughout the course of dorsal fold initiation with infrequent bursts of Myosin activity that do not differ between the initiating and neighboring cells (Supplementary Movie 5, Supplementary Fig. 3a, b). These results indicate that the initiation of dorsal fold formation is not associated with differential Myosin contractility.
In contrast, E-Cadherin, the core component of adherens junctions, displays a cell-type specific change in its positioning: in the initiating cells, junctions shift basally from the subapical regions where they are originally assembled, whereas in the neighboring cells junctions maintain their original subapical positioning (Fig. 1g, Supplementary Movie 6, 7, Supplementary Fig. 3c). Simultaneous imaging of E-Cadherin-GFP and Resille-GFP reveals that basal shift of junctions can be observed as early as 300 seconds before the onset of gastrulation during the last phase of cellularization, which precedes the apical narrowing and cell shortening that occur 100∼200 seconds after the onset of gastrulation (Fig. 1h, Supplementary Movie 8). During this seven-minute interval, junctions in the initiating cells shift approximately 10 μm basally to lie at 34±5% (n = 18) below the apical surface, whereas junctions in the neighboring cells show only a slight shift (∼3 μm) to lie at 15±4% (n = 27) below the apical surface (Supplementary Fig. 4). The basal shift of junctions in the initiating cells increases the asymmetry in the junctional positioning on the opposite sides of the neighboring cells that immediately flank the initiating cells. The lateral membrane of these cells becomes increasingly curved, correlating with the increased junctional asymmetry (Supplementary Fig. 5).
If the apparent basal shift of E-Cadherin positioning reflects an actual movement or remodeling of the junctions, it should be associated with an increase in the volume and surface area above the junctions. To test this hypothesis, we measured the two-dimensional (2-D) parameters of area and perimeter of the apical domain in the living embryos. As the junctions shift basally in the initiating cells, both of these parameters increase, consistent with a basal movement of the junctions within the cells (Supplementary Fig. 6). We corroborated these observations by developing computer software that reconstructs and quantifies three-dimensional (3-D) cell shape in fixed embryos (Fig. 1i). As the cell length increases during the last phase of cellularization, the length, volume and surface area of the apical domain in the initiating cells all increase significantly more than they do in the neighboring cells (Fig 1j-l), indicating that the junctional shift is accompanied by an expansion of the apical domain and that mobility of the E-Cadherin complex underlies the apparent basal shift of the junctions.
Adherens junctions are positioned to the subapical regions of the polarized epithelial cells by the concerted action of the scaffolding protein Par-3 (Bazooka in Drosophila), the atypical protein kinase C (aPKC) and the MARK family kinase Par-1: apically localized aPKC and basal-laterally localized Par-1 restricts Bazooka/Par-3 to the subapical regions, where it directs junctional assembly4-10. We found that the levels of Bazooka and aPKC are not differentially regulated across the dorsal epithelium and thus do not account for the observed junctional shift (Fig. 2a, Supplementary Movie 9, Supplementary Fig. 7). In contrast, live imaging of Par-1-GFP shows that the levels of Par-1 in the presumptive initiating cells, while initially similar (∼95%) to those in the neighboring cells prior to the onset of junctional shift, reduce progressively during the last phase of cellularization to reach ∼80% of its levels in the neighboring cells as gastrulation commences (Fig. 2b, c, Supplementary Movie 10, n = 7). This differential modulation of Par-1 levels appears to require the anterior-posterior patterning system (Supplementary Fig. 8, Supplementary Movies 11). To ask whether the reduction in Par-1 levels in the initiating cells correlate temporally with the junctional shift, we quantified the levels of Par-1 in fixed embryos and determined the position of junctions using Bazooka staining. As Bazooka becomes more basally positioned in the initiating cells, their Par-1 levels also become lower, whereas the Bazooka levels remain constant (Fig. 2d). These analyses confirm our live imaging data and establish a correlation between the position of junctions and the ratio of Bazooka/Par-1 (Fig. 2e).
Figure 2.

The dynamics of Bazooka and Par-1 during dorsal fold initiation. a, b, Two-photon time-lapse mid-sagittal section of Bazooka-GFP (a) or Par-1-GFP (b). Arrows and brackets, anterior (pink) and posterior (cyan) fold initiating cells. Scale bars, 10 μm. c, A time-course analysis of Par-1-GFP levels in the initiating cells relative to those in the neighboring cells (n = 7). d, A scatter plot of the average Bazooka positioning in the initiating cells normalized by that in the neighboring cells against the average levels of Bazooka or Par-1 relative to their respective levels in the neighboring cells with the corresponding trend lines. e, A scatter plot of the average Bazooka positioning along the apical-basal axis against the average Bazooka/Par-1 ratio within individual cells. Error bars indicate s.d.
This correlation suggests that Par-1 downregulation allows Bazooka to gradually localize more basally, which in turn directs basal repositioning of junctions. To test this hypothesis, we altered the levels of Bazooka and Par-1 to investigate the function of junctional positioning during the formation of dorsal folds. Uniform reduction of Bazooka activity by RNA interference (RNAi) causes accumulation of E-Cadherin-GFP at the edges between apical and lateral surfaces, resulting in an extreme apical positioning of junctions across the epithelium (Fig. 3a, Supplementary Movie 13), similar to embryos produced by the germline clones of a strong loss-of-function allele of bazooka (Supplementary Fig. 9). Conversely, in par-1 RNAi embryos, junctions are located in the lateral regions of all dorsal cells at an average position of 39±8% below the surface, slightly more basal than the junctions in the initiating cells in the wild-type (Fig. 3b, Supplementary Movie 14, 30 cells from 3 embryos). Importantly, in both bazooka and par-1 RNAi embryos, the junctional positioning is uniform across the entire dorsal epithelium and in each case, the initiation of dorsal folds is abolished despite the normal appearance of junction and epithelial structure (75% for bazooka RNAi, n = 8; 70% for par-1 RNAi, n = 10). Thus, dorsal fold formation appears to require a differential positioning of junctions between the initiating cells and their neighbors.
Figure 3.

Differential positioning of adherens junctions is necessary and overexpression of Bazooka can be sufficient for ectopic dorsal fold initiation. a-d, Two-photon time-lapse mid-sagittal section of E-Cadherin-GFP in a bazooka (a) or par-1 (b) RNAi embryo or BazookaS151A, S1085A-GFP in an embryo in which the endogenous Bazooka is present (c) or downregulated by bazooka 5′UTR RNAi (d). e, Confocal mid-sagittal section of Bazooka (red), Neurotactin (blue) and Runt (green) immunofluorescence in a Bazooka-GFP overexpression embryo. R#′s denote the Runt stripes. AF, anterior fold. PF, posterior fold. Scale bars, 10 μm.
Par-1 phosphorylates and thereby excludes Bazooka from the basal-lateral regions of a polarized epithelial cell. We examined the behavior of BazookaS151A, S1085A, a mutant form of Bazooka that cannot be phosphorylated by the Par-1 kinase4. When the endogenous Bazooka is present, the GFP-tagged BazookaS151A, S1085A shows a subapical (junctional) distribution similar to the GFP-tagged wild-type form (Fig. 3c, Supplementary Movie 15). However, when we knocked down the endogenous Bazooka using RNAi, BazookaS151A, S1085A initially displays a broad distribution along the apical-basal axis and eventually coalesces in the lateral regions of all dorsal cells (Fig. 3d, Supplementary Movie 16). A similar localization was observed for wild type Bazooka-GFP in par-1 RNAi embryos (Supplementary Movie 17) and in both cases, dorsal fold formation is blocked. These results suggest that serine 151 and 1085 of Bazooka are two main substrates of Par-1 during dorsal fold initiation, whose differential phosphorylation determines the heterogeneous positioning of Bazooka across the dorsal epithelium and is critical for dorsal fold initiation.
When we altered the ratio of Bazooka/Par-1 by a uniform increase in Bazooka levels throughout the epithelium, we saw shifts of junctions that lead to eventual formation of epithelial folds in regions that are outside the sites of anterior and posterior folds and typically near the third and seventh stripes of Runt expression (Fig. 3e, Supplementary Movie 18, Supplementary Fig. 10). An increase in the Bazooka levels alone in the cells that normally maintain a subapical positioning of junctions can thus be sufficient to drive junctional shift and epithelial folding presumably by exploiting subtle local heterogeneities in Par-1 levels (Supplementary Fig. 11).
In most epithelia, aPKC phosphorylates Bazooka and becomes segregated to establish the apical domain above the junctions7,9,10. We asked whether aPKC plays a role during junctional repositioning. In embryos that lack aPKC activity, the basal margin of the junctions shows its characteristic basal shift in the initiating cells, but the apical margin unexpectedly maintains its typical subapical positioning, leading to an abnormally wide junctional domain. In contrast, the width and positioning of the junctions in the neighboring cells appear normal (Fig. 4a, Supplementary Movie 19). These results suggest that aPKC controls the apical margin to maintain the size of the junctions, but is not required for the basal shift of junctions. These observations also decouple the junctional shift from an increase in the size of the apical membrane. The widening of junctional expanse was also observed in embryos that overexpress BazookaS980A, a mutant form of Bazooka that cannot be phosphorylated by aPKC (Supplementary Fig. 12)9. It appears that the segregation of aPKC from Bazooka establishes the apical domain, enabling junctional disassembly at the apical margin of the junctions.
Although the basal shift of junctions occurs in the initiating cells in the aPKC mutant embryo, these cells fail to shorten and the dorsal folds do not form properly (Fig. 4b, Supplementary Movie 19). It appears that as the basal margin of the junctions shifts basally in the initiating cells in response to a decrease in Par-1 levels, their apical margin needs to become disassembled in an aPKC-dependent manner so that the subsequent apical cell shape changes could occur.
In this report, we present evidence that dorsal fold initiation requires the establishment of distinct ratios of Bazooka/Par-1 that impose different positions for the adherens junctions in the initiating cells and their neighbors. We hypothesize that the differential positioning of junctions facilitates epithelial folding through two cellular processes (Supplementary Fig. 13). Within the initiating cells, the resultant increase in the non-adherent apical surface after junctional shift may be unstable such that a shrinkage of the apical domain is triggered to restore the balance between cell surface tension and local adhesive forces11. The shortened cells thus produced would then create a localized structural inhomogeneity in the epithelium where buckling would preferentially occur. Second, in the immediate flanking cells, a junctional asymmetry is produced since the basal positioning in the initiating cells on one side and the subapical positioning in the neighboring cells on the other must be accommodated. Because all junctions in an epithelium are mechanically coupled12, the asymmetry may cause the lateral surfaces to curve and cells to bend toward the shortened initiating cells. This bending would drive and deepen any buckles or folds initiated in the epithelial sheet.
Directional movement of cadherin complex along the apical-basal axis has been previously observed in cultured cells in vitro13 but, to our knowledge, Drosophila gastrulation provides the first case where such movement has been described in an intact developing organism. When the shifts occur in stripes as they do on the dorsal side of the Drosophila embryo, they appear to initiate infolding of the epithelium. In tissues in which the levels of cortical Myosin are low and constant, junctional repositioning regulated by Par-1/Bazooka interactions may play a more prominent role in epithelial folding than does differential activation of cortical contractility. Junctional repositioning may also represent an important mechanism in folding events that do not lead to internalization or delamination, or where the integrity of junctions within the epithelia must be maintained. How junctions are repositioned while maintaining junctional integrity is unclear, but in principle the process could involve remodeling via local endocytic trafficking, or lateral movement of the intact junctions in the membrane14. Regardless of the mechanism, dorsal fold formation represents an emergent model in which the insights into this alternative mode of epithelial folding could be further analyzed.
Methods Summary
Full methods are available in the online version of the paper at www.nature.com/nature.
Methods
Drosophila genetics
Drosophila stocks used for live imaging were: Resille-GFP15, myosin-GFP (Spaghetti squash-GFP)16, membrane-mCherry12, E-Cadherin-GFP17, Par-1 protein trap18, mat-tub-GFP-Par-119. UASp-Bazooka-GFP20 was driven maternally by one copy (67C) of the matαTub-Gal4VP16 driver in live imaging experiments and one or two copies (67C; 15) in overexpression experiments. UASp-BazookaS151A, S1085A-GFP4 and UASp-BazookaS980A-GFP9 were driven by matαTub-Gal4VP16 (67C; 15). Mutant stocks used were: runtLB5, torsoXR/torsoPM51, torso-like1/torso-like4, bicoidE1 nanosBN torso-like3. Germline clones of bazookaGD21 and aPKCK06402 were generated using the FLP-DFS technique with the ovoD2 FRT19A or FRTG13 ovoD1 chromosomes.
RNAi
Double stranded RNAs were synthesized using Megascript T7 kit (Ambion) from PCR products that contain the T7 promotor sequence (5′-TAATACGACTCACTATAGGGTACT-3′) at each end. The PCR products used in in vitro transcription reactions were amplified from 0-4 hours embryonic cDNA using the following primer pairs: bazooka, 5′-GACGTTTTCTTGCTAAGCGG-3′, 5′-TTTCGCAGTGTAGGTCCAAA-3′; bazooka 5′UTR (for knockdown of endogenous but not transgenic bazooka), 5′-AATGCGCGCGTGTATGAATCACAC-3′, 5′-ACGACCGCATCATCATCATCGTCG-3′; par-1, 5′-CACGTTCTGCGGTAGCC-3′, 5′-GCTTGGGATCGGCTAAATC-3. Double stranded RNAs were injected into the embryos during the syncytial blastoderm stage, typically 3-4 hours before imaging.
Live imaging, immunofluorescence and scanning electron microscopy
Two-photon live embryo imaging was performed on a custom-made system built on an upright Olympus BX51 microscope that is equipped with a Ti:Sapphire tunable laser ranged from 720 to 960nm (Coherent). Single-photon confocal imaging was performed on a Leica SP5 system. Immunofluorescence was performed on heat-methanol fixed embryos21. Antibodies used were mouse monoclonal anti-Neurotactin (BP106, Developmental Studies Hybridoma Bank, 1:20), rabbit anti-Runt (1:1000), rabbit anti-Armadillo (1:200), rabbit anti-Par-122 (1:500), rabbit anti-PKC ζ C20 (1:1000, Santa Cruz Biotechnology), and guinea pig anti-Bazooka23 (1:500) and were visualized by Alexa 488, 568 and 647 conjugated secondary antibodies (Molecular Probes). Scanning electron microscopy was performed on a Hitachi TM-1000 system as previously described12. Images were processed, assembled into figures and converted into movies using Image J, Adobe Photoshop and Adobe Illustrator.
Three-dimensional image processing and cell boundary reconstruction
The algorithm for 3-D reconstruction and analysis was implemented in C++ using Qt library and OpenGL for the GUI and Libtiff for loading image stacks. Image stacks of three-channel immunofluorescence were used. All channels of the 8-bit image volume were initially scaled to a 1:1:1 aspect ratio (voxel size, 0.16μm × 0.16μm × 0.16μm) and down-sampled by 80% (voxel size, 0.20μm × 0.20μm × 0.20μm) to reduce image noise. The contrast of Neurotactin immunofluorescence was enhanced by adaptive histogram adjustment using 8 equally spaced histograms along the Z-dimension and the 10th percentile as the minimum intensity value for intensity adjustment. Two passes of rank filtering were used to fill weak regions of Neurotactin staining, closing holes between cells: a rank filter using the 95th percentile intensity value in a sphere with radius 0.6μm, followed by a rank filter using the 10th percentile intensity value in a sphere with radius 0.8μm. Edges were found using a difference of Gaussians (DOG) approximation to a 3-D Marr-Hildreth edge detector where the zero-crossing was positioned at low threshold of 4 and high threshold of 30 to generate two binary image volumes24. A “rolling ball” algorithm applied to the high threshold volume was used to repair holes in the epithelium due to ongoing cellularization. The algorithm was computed efficiently using boundaries in a Euclidian distance transform (EDT)25. Briefly, a boundary at distance of 3μm was defined using the EDT. A second boundary, also at 3μm from the first boundary, was to approximate the result of rolling a sphere on the high threshold binary image generated from the Marr-Hildredth operator. The repaired boundary was applied to the low threshold binary image to obtain binary image where the outer boundary of the epithelium was repaired. This binary image was then thinned by 3-D surface thinning26. Connected components in the surface thinned binary image were found by depth first search. Components of fewer than 100 voxels were removed as noise. Cells were found in this image by hierarchical application of a seeded Watershed algorithm27,28. Seed regions were defined hierarchically by gradually applying an increasing threshold to an EDT of the thinned binary image until a Watershed segmented region reached a volume of less than 640μm3. Regions smaller than 40μm3 were removed as noise. The segmented cell regions were then converted into 3-D triangle meshes by the Marching Cubes algorithm29. Lastly, the resulting meshes were adapted to the intensity of the image by a finite difference approximation to an Active Surface30.
Image quantitation
Frequency of Myosin bursts (Supplementary Fig. 3b)
Confocal time-lapse images of Myosin-GFP and membrane-mCherry were used for this quantitation. These datasets have a Z resolution of 1 μm and cover a 10 μm distance from the apical cortex with a temporal resolution ranging between 15 and 22 seconds per frame. The intense Myosin structures were visually identified from each Z slice of the image stacks. The total number of Myosin bursts was the sum of Myosin bursts from all Z slices throughout the duration of imaging. The frequency was then calculated by dividing the total number of bursts by the imaging duration and the number of cells in which the bursts were counted. The imaging duration ranges between 436 to 689 seconds. The numbers of initiating and neighboring cells that were counted range between 30 to 41 and 51 to 86, respectively.
Time-course analyses of junctional positioning and apical domain size (Supplementary Fig. 4, 6)
Two-photon time-lapse images of E-Cadherin-GFP and Resille-GFP were used for these measurements. The onset of gastrulation was defined by the onset of anterior cell movement driven by posterior midgut invagination. For the analysis of junctional positioning, the central initiating cell of the anterior and posterior folds and a third cell that resides in the region between the anterior and posterior fold that displays minimal junctional movement were chosen to represent the initiating and neighboring cells. The vertical distance between the visually defined center of the junctional complex and the apex of the cell was measured in Image J to represent the positioning of the junctions. For the analysis of apical domain size, the central initiating cell of the posterior fold and a representative neighboring cell in the region between the anterior and posterior folds were chosen. The apical domain above the junctions was manually outlined based on the membrane fluorescence of Resille-GFP and measured for its area and perimeter in Image J.
Correlation analysis between differential junction displacement and lateral membrane curvature (Supplementary Fig. 5)
Two-photon time-lapse images of E-Cadherin-GFP were used. Cells that are in the immediate flanking regions of the initiating cells and display a dramatic asymmetry of junctional positioning on the opposite sides were chosen for these measurements. The differential junctional displacement, which defines the extent of junctional asymmetry, was calculated by subtracting the length of the apical domain on the distal side (y) from that on the proximal side (x). The lateral membrane curvature was defined as the ratio between the height (h) and the chord (C) of the arc of lateral membrane on the distal side of the cell.
3-D cell shape measurements (Fig. 1j-l)
Image stacks of a series of late cellularization embryos were processed for 3-D reconstruction as described above. The position of Bazooka was defined by the “Bazooka junctional triangles”. Briefly, an average intensity of Bazooka was first assigned for the voxels that intersect with a 3-D triangle mesh in the reconstructed cell boundary. The Bazooka junctional triangles were then selected based on an intensity threshold of the 99th percentile of the Bazooka intensity histogram. For each of the centroids of the Bazooka junctional triangles, a 3-D principal component analysis (PCA) was performed to determine the Bazooka mean position (a point on a plane) and the eigenvector corresponding to smallest eigenvalue (plane normal). These were then used to define the Bazooka junctional plane that subdivides the cell into the apical and basal domains. The geometric measurements were performed as follows: 3-D PCA was applied to all of the vertices of the triangle mesh and the long direction of the cell was defined using the eigenvector corresponding to the largest eigenvalue. The apical domain length was measured by first creating vectors between the cell centroid and each mesh vertex on the apical side of the Bazooka junctional plane. These vectors were then projected onto the long direction vector of the cell. The length of the longest projected vector was used as the apical domain length. The basal domain length was measured similarly, using triangle mesh vertices on the basal domain of the cell. The total cell length was computed by a sum of the apical and basal length. The apical volume was computed by voxelizing the 3-D triangle meshes, and summing the volumes of voxels apical to the Bazooka junctional plane. Similarly, the apical surface area was computed by summing the areas of the mesh triangles for which the triangle centroid falls on the apical side of the Bazooka junctional plane. The initiating cells were selected on the basis of their location and junctional positioning. Approximately 500 dorsal cells in the region between the first and the seventh stripe of Runt were ranked by the apical domain length and the top 150 cells were selected for further analysis. A second selection was performed to isolate those that are in close proximity to the second and fifth stripes of Runt. Of these cells, those whose apical domain length was above the average were used for analysis. For the early stage embryos that displayed no junctional shift, only the location-based selection was made. Cells that reside in the region between the anterior and posterior folds with junctional positioning that was below average were used as the neighboring cells.
Time-course analysis of Par-1 dynamics (Fig. 2c)
Two-photon time-lapse images of Par-1-GFP were used for these measurements. The average fluorescent intensity of Par-1-GFP in manually selected areas consisting 2 anterior or 4 posterior initiating cells was measured and normalized by that in areas consisting 4 neighboring cells that reside in the regions between the anterior and posterior folds. The onset of gastrulation was defined by the onset of anterior cell movement driven by posterior midgut invagination.
Quantitation of Bazooka and Par-1 immunofluorescence in 3-D reconstructed cells (Fig. 2d, e, Supplementary Fig. 11)
Image stacks of fixed embryos triply labeled for Bazooka, Par-1 and Neurotactin were processed for 3-D reconstruction as described above to define the Bazooka junctional triangles. Junctional intensity of Bazooka within a cell was measured within and normalized by the Bazooka junctional volume that was defined by the voxelization of Bazooka junctional triangles. The basal-lateral intensity of Par-1 in each cell was measured within and normalized by the volume within a two-voxel distance from the cell boundary basal to the Bazooka junctional plane. For Fig. 2d, e, the anterior and posterior fold initiating cells were selected on the basis of location and above average Bazooka positioning, while the neighboring cells were selected from the cells that reside in the region between the anterior and posterior folds with below average Bazooka positioning. For Supplementary Fig. 11, the wild-type and Bazooka overexpression embryos were fixed, stained and imaged in parallel under identical conditions. Cell selection was performed as in Fig. 2d, e.
Time-course analysis of cell shortening in the initiating cells (Fig. 4b)
Five and four initiating cells each from wild-type and aPKC mutant embryos were measured for their total cell length in Image J. The measurements were normalized by cell length at time zero, which was defined by the onset of anterior cell movement driven by the posterior midgut imagination.
Supplementary Material
Acknowledgments
We thank A. Martin, J. McDonald, D. St Johnston and J. Zallen for providing flies and antibodies; J. Goodhouse and S. Thiberge for assistance in microscopy; G. Deshpande, members of the Wieschaus and Schüpbach labs for helpful comments on the manuscript and discussion. This work is supported by a postdoctoral fellowship from Helen Hay Whitney Foundation to Y.-C.W., a National Institutes of Health/National Institute of General Medical Sciences P50 grant (GM071508) to Z.K. and M.K., and a National Institute of Child Health and Human Development grant (5R37HD15587) to E.F.W. E.F.W. is an investigator of the Howard Hughes Medical Institute.
Footnotes
Supplementary Information is linked to the online version of the paper at www.nature.com/nature.
Author Contributions: Y.-C.W conceived the project, performed all experiments and analyzed the data, except those experiments that involve scanning electron microscopy, which was performed by E.F.W. Z.K. and M.K. developed the software for 3-D reconstruction. Y.-C.W. and E.F.W. wrote the manuscript.
Reprints and permissions information is available at www.nature.com/reprints.
The authors declare that they have no competing financial interests.
References
- 1.Sawyer JM, et al. Apical constriction: a cell shape change that can drive morphogenesis. Dev Biol. 2010;341:5–19. doi: 10.1016/j.ydbio.2009.09.009. [DOI] [PMC free article] [PubMed] [Google Scholar]
- 2.Sweeton D, Parks S, Costa M, Wieschaus E. Gastrulation in Drosophila: the formation of the ventral furrow and posterior midgut invaginations. Development. 1991;112:775–789. doi: 10.1242/dev.112.3.775. [DOI] [PubMed] [Google Scholar]
- 3.Martin AC, Kaschube M, Wieschaus EF. Pulsed contractions of an actin-myosin network drive apical constriction. Nature. 2009;457:495–499. doi: 10.1038/nature07522. [DOI] [PMC free article] [PubMed] [Google Scholar]
- 4.Benton R, St Johnston D. Drosophila PAR-1 and 14-3-3 inhibit Bazooka/PAR-3 to establish complementary cortical domains in polarized cells. Cell. 2003;115:691–704. doi: 10.1016/s0092-8674(03)00938-3. [DOI] [PubMed] [Google Scholar]
- 5.Harris TJ, Peifer M. Adherens junction-dependent and -independent steps in the establishment of epithelial cell polarity in Drosophila. J Cell Biol. 2004;167:135–147. doi: 10.1083/jcb.200406024. [DOI] [PMC free article] [PubMed] [Google Scholar]
- 6.Harris TJ, Peifer M. The positioning and segregation of apical cues during epithelial polarity establishment in Drosophila. J Cell Biol. 2005;170:813–823. doi: 10.1083/jcb.200505127. [DOI] [PMC free article] [PubMed] [Google Scholar]
- 7.Krahn MP, Buckers J, Kastrup L, Wodarz A. Formation of a Bazooka-Stardust complex is essential for plasma membrane polarity in epithelia. J Cell Biol. 2010;190:751–760. doi: 10.1083/jcb.201006029. [DOI] [PMC free article] [PubMed] [Google Scholar]
- 8.McGill MA, McKinley RF, Harris TJ. Independent cadherin-catenin and Bazooka clusters interact to assemble adherens junctions. J Cell Biol. 2009;185:787–796. doi: 10.1083/jcb.200812146. [DOI] [PMC free article] [PubMed] [Google Scholar]
- 9.Morais-de-Sa E, Mirouse V, St Johnston D. aPKC phosphorylation of Bazooka defines the apical/lateral border in Drosophila epithelial cells. Cell. 2010;141:509–523. doi: 10.1016/j.cell.2010.02.040. [DOI] [PMC free article] [PubMed] [Google Scholar]
- 10.Walther RF, Pichaud F. Crumbs/DaPKC-dependent apical exclusion of Bazooka promotes photoreceptor polarity remodeling. Curr Biol. 2010;20:1065–1074. doi: 10.1016/j.cub.2010.04.049. [DOI] [PubMed] [Google Scholar]
- 11.Lecuit T, Lenne PF. Cell surface mechanics and the control of cell shape, tissue patterns and morphogenesis. Nat Rev Mol Cell Biol. 2007;8:633–644. doi: 10.1038/nrm2222. [DOI] [PubMed] [Google Scholar]
- 12.Martin AC, Gelbart M, Fernandez-Gonzalez R, Kaschube M, Wieschaus EF. Integration of contractile forces during tissue invagination. J Cell Biol. 2010;188:735–749. doi: 10.1083/jcb.200910099. [DOI] [PMC free article] [PubMed] [Google Scholar]
- 13.Kametani Y, Takeichi M. Basal-to-apical cadherin flow at cell junctions. Nat Cell Biol. 2007;9:92–98. doi: 10.1038/ncb1520. [DOI] [PubMed] [Google Scholar]
- 14.Cavey M, Lecuit T. Molecular bases of cell-cell junctions stability and dynamics. Cold Spring Harb Perspect Biol. 2009;1:a002998. doi: 10.1101/cshperspect.a002998. [DOI] [PMC free article] [PubMed] [Google Scholar]
- 15.Morin X, Daneman R, Zavortink M, Chia W. A protein trap strategy to detect GFP-tagged proteins expressed from their endogenous loci in Drosophila. Proc Natl Acad Sci U S A. 2001;98:15050–15055. doi: 10.1073/pnas.261408198. [DOI] [PMC free article] [PubMed] [Google Scholar]
- 16.Royou A, Sullivan W, Karess R. Cortical recruitment of nonmuscle myosin II in early syncytial Drosophila embryos: its role in nuclear axial expansion and its regulation by Cdc2 activity. J Cell Biol. 2002;158:127–137. doi: 10.1083/jcb.200203148. [DOI] [PMC free article] [PubMed] [Google Scholar]
- 17.Oda H, Tsukita S. Real-time imaging of cell-cell adherens junctions reveals that Drosophila mesoderm invagination begins with two phases of apical constriction of cells. J Cell Sci. 2001;114:493–501. doi: 10.1242/jcs.114.3.493. [DOI] [PubMed] [Google Scholar]
- 18.Lighthouse DV, Buszczak M, Spradling AC. New components of the Drosophila fusome suggest it plays novel roles in signaling and transport. Dev Biol. 2008;317:59–71. doi: 10.1016/j.ydbio.2008.02.009. [DOI] [PMC free article] [PubMed] [Google Scholar]
- 19.Shulman JM, Benton R, St Johnston D. The Drosophila homolog of C. elegans PAR-1 organizes the oocyte cytoskeleton and directs oskar mRNA localization to the posterior pole. Cell. 2000;101:377–388. doi: 10.1016/s0092-8674(00)80848-x. [DOI] [PubMed] [Google Scholar]
- 20.Benton R, St Johnston D. A conserved oligomerization domain in Drosophila Bazooka/PAR-3 is important for apical localization and epithelial polarity. Curr Biol. 2003;13:1330–1334. doi: 10.1016/s0960-9822(03)00508-6. [DOI] [PubMed] [Google Scholar]
- 21.Muller HA, Wieschaus E. armadillo, bazooka, and stardust are critical for early stages in formation of the zonula adherens and maintenance of the polarized blastoderm epithelium in Drosophila. J Cell Biol. 1996;134:149–163. doi: 10.1083/jcb.134.1.149. [DOI] [PMC free article] [PubMed] [Google Scholar]
- 22.McDonald JA, Khodyakova A, Aranjuez G, Dudley C, Montell DJ. PAR-1 kinase regulates epithelial detachment and directional protrusion of migrating border cells. Curr Biol. 2008;18:1659–1667. doi: 10.1016/j.cub.2008.09.041. [DOI] [PMC free article] [PubMed] [Google Scholar]
- 23.Simoes Sde M, et al. Rho-kinase directs Bazooka/Par-3 planar polarity during Drosophila axis elongation. Dev Cell. 2010;19:377–388. doi: 10.1016/j.devcel.2010.08.011. [DOI] [PMC free article] [PubMed] [Google Scholar]
- 24.Marr D, Hildreth E. Theory of Edge Detection. Proceedings of the Royal Society of London. Series B. Biological Sciences. 1980;207:187–217. doi: 10.1098/rspb.1980.0020. [DOI] [PubMed] [Google Scholar]
- 25.Maurer CR, Jr, Qi R, Raghavan V. A linear time algorithm for computing exact Euclidean distance transforms of binary images in arbitrary dimensions. IEEE Transactions on Pattern Analysis and Machine Intelligence. 2003;25:265–270. [Google Scholar]
- 26.Palágyi K, et al. A Sequential 3D Thinning Algorithm and Its Medical Applications Information Processing in Medical Imaging. Lecture Notes in Computer Science. 2001;2082:409–415. [Google Scholar]
- 27.Vincent L, Soille P. Watersheds in digital spaces: an efficient algorithm based on immersion simulations. IEEE Transactions on Pattern Analysis and Machine Intelligence. 1991;13:583–598. [Google Scholar]
- 28.Beucher S, Meyer F. The morphological approach to segmentation: the watershed transformation. Mathematical morphology in image processing. Optical Engineering. 1993;34:433–481. [Google Scholar]
- 29.Lorensen WE, Cline HE. Marching cubes: A high resolution 3D surface construction algorithm. SIGGRAPH '87: Proceedings of the 14th annual conference on computer graphics and interactive techniques. 1987;21:163–169. [Google Scholar]
- 30.Cohen LD, Cohen I. Finite Element Methods for Active Contour Models and Balloons for 2D and 3D Images. IEEE Transactions on Pattern Analysis and Machine Intelligence. 1991;15:1131–1147. [Google Scholar]
Associated Data
This section collects any data citations, data availability statements, or supplementary materials included in this article.